
Low-Cost and Accurate Computational System for Efficiency Measures over Photovoltaic Arrays
Volume 4, Issue 5, Page No 39-45, 2019
Author’s Name: Hector L. N ́u ́nez-Ram ̃ ́ırez*,a), Gloria G. Carvalho-Kassar1, Freddy C. Brito-Maestre2, Yaremi I. Gamboa-Maldonado3, Luis A. Santos-Avendano1, Carlelines Gavidia-Toro4, Orlando Villarroel-Ramos3, Dino Di Rosa-Ulloa4
View Affiliations
1Fundacion Centro Nacional de Desarrollo e Investigacion en Telecomunicaciones, Direccion de Fotonica, 01060A, Caracas, Venezuela.
2Universidad Central de Venezuela, Departamento de Comunicaciones, 01050, Caracas, Venezuela.
3Fundacion Centro Nacional de Desarrollo e Investigacion en Telecomunicaciones, Direccion de Propagacion y Antenas, 01060A, Caracas, Venezuela.
4Fundacion Centro Nacional de Desarrollo e Investigacion en Telecomunicaciones, Direccion de Electronica de Comunicaciones, 01060A, Caracas, Venezuela.
a)Author to whom correspondence should be addressed. E-mail: hectornunez2002@gmail.com
Adv. Sci. Technol. Eng. Syst. J. 4(5), 39-45 (2019); ![]() DOI: 10.25046/aj040505
DOI: 10.25046/aj040505
Keywords: Efficiency Measures, Photovoltaic Arrays, Software, Two-diode model

Export Citations
In this paper, we present a new Somewhat Homomorphic Encryption (SHE) scheme using computation over complex numbers. We then use Bootstrapping technique to make the scheme Fully Homomorphic (FH) and supports unbounded number of circuit depth. In addition to its homomorphic properties and security level, a main characteristic of the proposed new scheme is its simplicity as it is merely based on addition and multiplication operations over complex numbers. The new scheme is implemented under Python using SAGEMath library and evaluated. Then a crypt-analysis based on Approximate GCD problem is done. A comparison with the BGV, a well known Fully Homomorphic Encryption (FHE) scheme, shows that this new scheme is an e ion scheme.Great efforts have been shown in the literature to improve the efficiency of photovoltaic (PV) systems. In this workpaper, authors present the development of a computational system based on free software that allows to estimate with an accuracy superior to 99.9 percent the performance of the PV array connected to a current inverter block, from the physical models behind. For this purpose, a solar radiation measures was made in the laboratory, and also voltage, current and temperature tests over the whole system, adding a storage interface and serial data transmission port to drive and process the data from a computer. Once the system was tested and calibrated in laboratory, the I-V experimental curves of the PV system were obtained in real time, in order to define the most important parameters: short-circuit current, open-circuit voltage, maximum current and voltage, in a natural environment. Those parameters were the input data to the computational tool based on Scilab, which allow estimate the performance of PV system described, solving the non-linear equations of the physical models used. The performance results were compared with a similar computational tool developed in Matlab, as well as with a commercial solar simulator used by the manufacturer of PV module. A highly accurate computational system based in Scilab was obtained allows to evaluate the efficiency and the filling factor of an array for di evels in real time.
Received: 30 May 2019, Accepted: 14 July 2019, Published Online: 06 September 2019
1. Introduction
This workpaper is an extension of work originally presented in´ IEEE 2018 Open Innovations Conference (OI) [1], as a contribution on developing software to determine the behavior of photovoltaic arrays, e.g. [2, 3], in order to be able to size correctly a deployment in any cases: residential, commercial, industrial and even farming interesting works based in two-diode model simulation [4] – [9] use Matlab to evaluate the performing of photovoltaic arrays. However, this work shows the results of an alternative computational system, based on two-diode model used for polycrystalline silicon PV cells [10]– [13], that determines the performance of a cell under sunlight irradiance variations and hence the relevance of knowing the efficiency of the device under study. To achieve this goal, the behavior of a semiconductor in sunlight conditions have been considered as well as temperature changes, to determine the current density between the terminals of the cell, generally consisting of a n-type and p-type semiconductor materials, which are brought togheter in the well-known n-p junction. The current of carriers under the photovoltaic phenomenon are deduced by means of the equations that describe the physical model that lead us to a nonlinear equations system, which will be solved by software using different Scilab functions. The coefficients of equations have been determined through the most important parameters of any photovoltaic array: short-circuit current (Isc), open-circuit voltage (Voc), maximum current (Imax) and voltage (Vmax), all of them determined experimentally in Photonic Laboratory of Cendit. Once the equations are solved, the I-V and P-V curves of the array under test are obtained, and they are compared with the results obtained using Matlab and the solar simulator facility from one manufacturer of the module under study. However, the results obtained include the performance of the DC-AC current inverter, which is part of the system, using a complete bridge configuration, PWM controller and LC filtering at the output. The computer system developed shows not only the I-V and P-V curves of the device under test but also shows the efficiency and the filling factor of whole set.
This workpaper was developed in five sections: Physical and Mathematical Modeling to focuses phenomena and equations according with the photovoltaic arrays used; Experimental Setup to describe the procedures performed in the laboratory to obtain the data required; Software Development with the scope of describe the tools used and the programming developed, as well as the use of the obtained experimental data; Results and Conclusions to analyze, compare, discuss and verify the operation of the computational tool presented.
2. Physical and Mathematical Modelling
The physical properties of a commercial photovoltaic array made of polycrystalline silicon was considered in this case, constituted by a n-p junction of semiconductor materials under the physical fundamentals of cells of this type described in [14, 15]. Isolated, each semiconductor material retains its neutral charge. The holes are the majority carriers in the p-type material and their positive charge is compensated by negatively-charged ionized acceptor atoms, while the electrons are the majority carriers in the n-type material where there is a large concentration of free electrons compensated by positively-charged ionized donor atoms. If both semiconductor materials are placed together, a very large difference in electron concentration occurs that causes an hole diffusion current from p-type material towards the n-type material as well as an electron diffusion current from the n-type material through the metallurgical junction to the p-type material, but the region close to the junction become free of mobile charge carriers, reason why this area is denoted as a depletion or space-charge region. The diffusion generates minority carriers in each region. The gradual depletion of the charge carriers generates a charge zone made up of acceptors and donor atoms, which is no longer compensated by the free mobile carriers. As quasi-neutral regions are denoted the regions around of the depletion zone, where the neutral charge is maintained (see figures 1 and 2).
In the depletion region, under equilibrium conditions and darkness, an internal electric field is formed which forces the charge carriers to move in the opposite direction to the concentration gradient, therefore, the diffusion current continues its flow, while the forces act on the charge carriers, compensate each other, then the diffusion and drift (due to the internal electric field created around the junction) currents that originate from the carriers are compensated, reason why the net current density is zero (Idrift = Idif fusion). When an increase in temperature occurs, electron-hole pairs are generated, provided that thermal energy can undo the bonds, increasing the minority carriers within the material, which causes a current density due to thermal-generation.
 Figure 1: n-p junction (top: before junction).
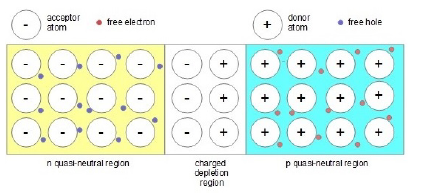 Figure 2: n-p junction (after junction).
The difussion currents (due to minority carriers) into n-type and p-type materials causes recombination currents since the minority carriers recombine with the majority carriers (the electron-hole pairs are undone). The recombination current is compensated by the thermal-generation current (Irec = Igen). The recombination strongly determines the performance of the photovoltaic cell, since the current that can be collected by the minority carriers within the semiconductor is reduced.
When the thermal equilibrium is broken, under illumination conditions, due to photons with enough energy (and frequency) to create an electron-hole pair, between the valence and conduction bands of the metallurgical junction, which increases the concentration of the minority carriers, is enabled the flow of holes from the n-type region to the p-type region, and vice versa in the case of the electrons. The flow of the photo-generated carriers determines a photo-generation current density (of intensity Iph), which is added to the current density by thermal generation when the temperature increases within the material.
Based on the above, the behavior of the photovoltaic cell in darkness can be described as a currents balance due to recombinations and thermal generation phenomena, by 1:
![]() where I01 and I02 are the saturation current in the quasi-neutral
where I01 and I02 are the saturation current in the quasi-neutral
regions and the saturation current in the depletion region, respectively, q is the carrier’s charge, k is the Boltzman’s constant, T is the temperature, V is the built potential due internal electric field in the junction, A is the ideality factor between both regions. In this case, note that the exponential function is like the Boltzman Approximation, which has been demonstrated in the literature.
On the other hand, under illumination condition, the photogeneration current Iph appears as shown in expression 2:
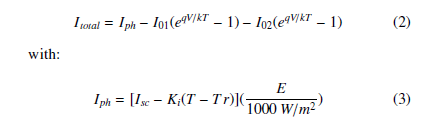 where Isc represents the short-circuit current, Itotal corresponds
to carriers net flow between the conducting terminals from the photovoltaic array, Ki is the short-circuit current coefficient, Tr represents the reference temperature and E is the irradiance.
The I-V and P-V curves, current-voltage and power-voltage respectively, can be obtained from equation (2), whose performance is shown in figure 3, where the Isc is pointed at the left extreme when V = 0 and Voc in the right extreme at Itotal = 0.
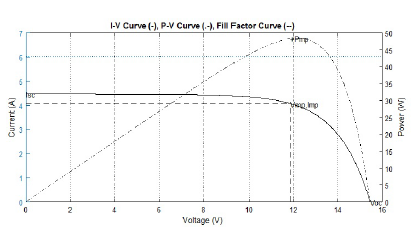 Figure 3: I-V Curve (blue), P-V Curve (red) and Fill Factor (yellow).
When the short-circuit condition is given, Imax not could be reached completly, in fact is a little lower due to the high resistivity presents between the ends of the junction, equivalent to a resistance in parallel to the current source and the diodes, denoted as shunt resistance (Rsh). In the other side, when the open-circuit condition is given the Vmax not could be reached due to the ohmic losses in the union of the contacts with the ends of the n-p junction, denoted as resistance in series (Rs) to the current source and diodes.
 The behavior of a single photovoltaic cell is given by the combination in parallel or series of a single photovoltaic cell, modifying expression (4) by the following:
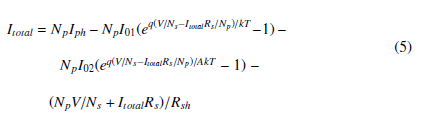
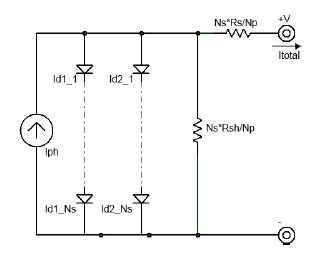 Figure 4: Equivalent circuit for a photovoltaic array.
where Iph is represented by a current source and the current under darkness (I01 and I02) by two diodes in parallel, justifying the ideal factor between both diodes denoted as A, Np and Ns, are the number of cells (from the array) in parallel or series , respectively.
The equivalent circuit to (5) is shown in Figure 4.
Using the short-circuit condition, V = 0 gives Itotal = Isc, then:
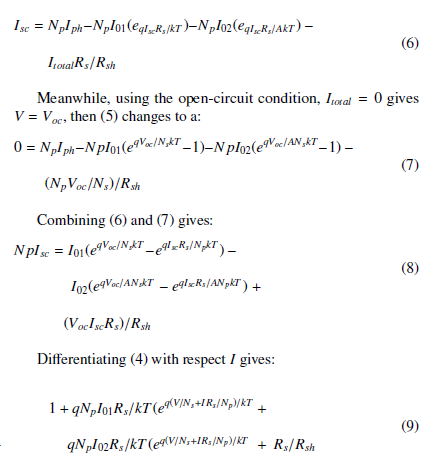
 Finally, to determine the values of I01, I02, Rs, Rsh, A, has been solved the equations system given by (8), (10), (11), (12), with the following conditions that regards the device under test:
 3. Experimental Setup
The values of Voc, Isc, Vmax and Imax for the photovoltaic array setup in laboratory, were acquired from I-V curves gives via experimental, under controlled temperature and solar levels, making the necessary measurements and following what is indicated by flow diagram shown in figure 5.
 Figure 5: Flow diagram of experimental setup.
In fact, this data was acquired using a device developed in the laboratory based on PIC 18F2550, which has enough memory capacity to operate an SD memory card for data storage, as well as an RS485 interface for trasmission in real time to a computer. The device was based on the scheme proposed in [16]. The device is constituted by three sensors:
- A photodiode to measure the solar irradiance, using the BPW31. – A temperature sensor, using the LM35.
- A voltmeter, using the ADC PIC module.
To calibrate the solar irradiance sensor, the TES 1333 was used, while for the temperature the infrared thermometer IDEAL 6165 and the multimeter Fluke 179 were used. For the acquisition of data, a script was generated in SCILAB to obtain the data via serial port, in order to plot in real time, for known conditions of irradiance (W/m2) and temperature (o C), I-V curves using a variable load variable (max. 10 A). The figures 6 and 7 show some photos about the experimental setup.
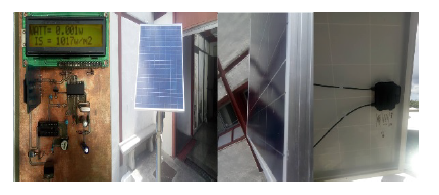 Figure 6: Captures of experimental setup (UNERVEN array).
 Figure 7: Captures of experimental setup (SIMENS array).
The technical specifications of photovoltaic (PV) module under test are indicated in table 1: Power (Max.), Voltage (Nominal), Series Cells (Ns) and Parallel Cells (Np).
Table 1: PV arrays under test (both polycrystalline).
| Parameter | UNERVEN MSF | SIEMENS PC-2-JF |
| Power | 195 W | 35 W |
| Voltage | 24 V | 17 V |
| Ns | 48 | 36 |
| Np | 1 | 1 |
The I-V curves for several solar irradiance levels during the useful solar day for each model of photovoltaic module under test are shown in figures 8 and 9.
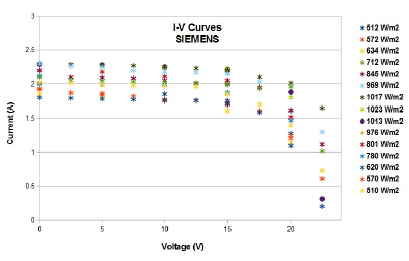 Figure 8: I-V experimental curves for UNERVEN SMF.
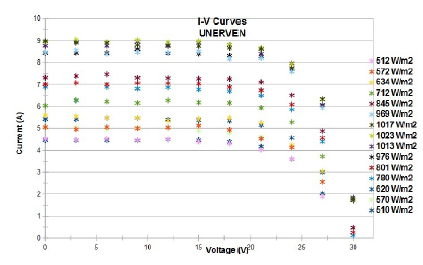 Figure 9: I-V experimental curves for SIEMENS PC-2-JF.
Table 2 shows the values obtained in laboratory for parameters:
Voc, Isc, Vmax and Imax, from photovoltaic arrays under test.
Table 2: Experimental values obtained.
| Parameter | UNERVEN | SIEMENS |
| Voc | 30.25 V | 23.18 V |
| Isc | 8.72 A | 2.41 A |
| Vm | 23.76 V | 2.12 A |
| Im | 8.15 A | 17.49 V |
4. Software Development
A SCILAB script was developed to solve nonlinear equations system constituted by expressions (8), (10), (11), (12), using the function fsolve [x0, F], with x0 defined as a vector with the initial values and F defined as a vector that describes equations mentioned before.
First of all, we have to define the equations to solve as a function:
function[f] = F(x)
kB = value; q = value; T = value; Voc = value; Isc = value;
Vm = value; Im = value;
Vt = value;
Rsh = value;
f(1) = x(1) ∗ (exp(Voc/Vt) − exp(Isc ∗ x(4)/Vt)) + x(2) ∗
(exp(Voc/(x(3) ∗ Vt)) − exp(Isc ∗ x(4)/(x(3) ∗ Vt))) − Isc + (Voc − Isc ∗ x(4))/Rsh; f(2) = −x(4) ∗ ((x(1)/Vt) ∗ exp(Voc/Vt) + x(2)/(x(3) ∗ Vt) ∗
exp(Voc/(x(3) ∗ Vt)) + 1/Rsh) − 1;
f(3) = x(1) ∗ (exp(Voc/Vt) − exp((Vm + Im ∗ x(4))/Vt)) + x(2) ∗
(exp(Voc/(x(3)∗Vt))−exp((Vm+Im∗ x(4))/(x(3)∗Vt)))+(Voc− Vm)/Rsh − Im ∗ (1 + x(4)/Rsh); f(4) = −x(4)∗((x(1)/Vt)∗exp(Isc∗ x(4)/Vt)+(x(2)/(x(3)∗Vt))∗
exp(Isc ∗ x(4)/(x(3) ∗ Vt)) + 1/Rsh) − 1; end function
Then, we have to define a script to solve the equations:
x0 = [minvalue; scalef actor;maxvalue]; y = f solve(x0, F); I1 = y(1);
I2 = y(2);
A = y(3);
Rs = y(4);
The expression defined by (5) is a trascendental equation that was solved in this case using Xcos from Scilab. Figure 10 shows how the four terms in (5) are determined. For more details see [1].
In the last blocks a DC-AC converter has been included and using a full-bridge configuration and a LC filter in the out, with PWM control. For more details in [1].
The I-V and P-V curves generated in Scilab, under Standard Test Conditions (STC) from the mathematical two-diodes model used for each array under test: SIEMENS and UNERVEN, are shown in figures 11 and 12.
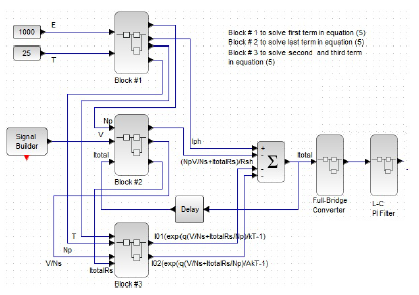 Figure 10: Xcos solution to simulate photovoltaic arrays with DC/AC inverter.
 Figure 11: I-V and P-V curves through Scilab (PV array: UNERVEN).
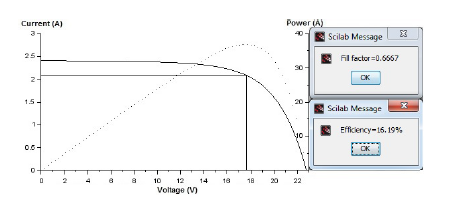 Figure 12: I-V and P-V curves through Scilab (PV array: SIEMENS).
5. Results
The I-V curves from different sources are shown in Figures 13 and 14: Solar Simulator (from UNERVEN, class A), Matlab Simulator (based on [1]) and Scilab Simulator, for each photovoltaic array under study on STC (1000 W/m2 , 25 oC). The solid line and the dash-dotted line are very close to each other, even if some approximation algorithm was not used to solve the equations of two-diode model as in recent workpapers cited above.
The I-V curves for several solar irradiation levels using Xcos from Scilab for each photovoltaic array under study are shown in Figures 15 and 16. Again, the solid line and the dash-dotted line are very close to each other, with an accuracy superior to 99.9 percent.
6. Conclusions
A computational tool has been put to test in laboratory, based on a free software platform, which allows evaluate in real time the efficiency not only of a photovoltaic array, but also the effects generated by a DC-AC inverter coupled like a load to the system as in real enviroment, using in the develop the physic models cited. Test were coducted in two commercial photovoltaic arrays, and aditionally, the performance results were compared with other tools (licensed) reaching a high accurate.
In contrast with experimental tools used (Solar Simulator Class
A from UNERVEN) and computational tool based on Matlab, using Scilab (free software) was improve the perfomance of photovoltaic arrays, even a real time estimation of fill factor and electrical efficiency as an additional feature respect to works cited above. works.
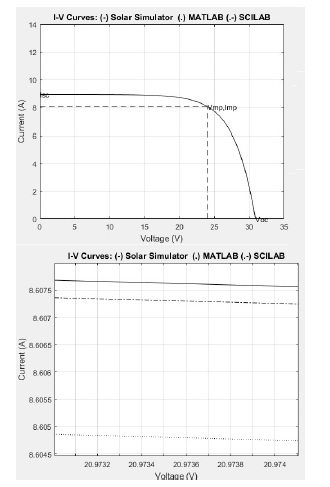 Figure 13: I-V Curves: Solar Simulator, Matlab, Scilab (PV array: UNERVEN).
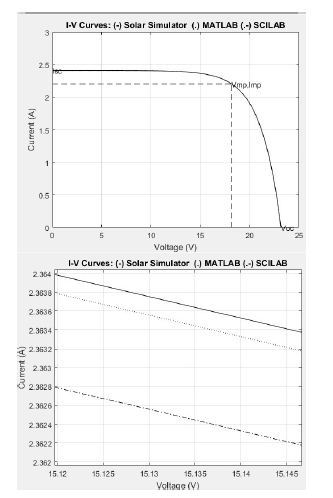 Figure 14: I-V Curves: Solar Simulator, Matlab, Scilab (PV array: SIEMENS).
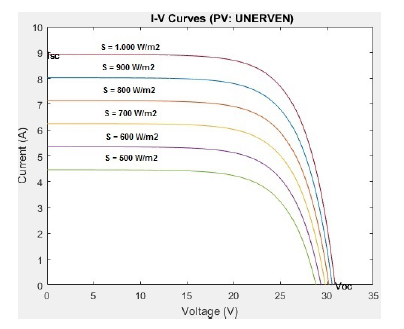 Figure 15: I-V Curves: for several irradiation levels (PV array: UNERVEN).
 Figure 16: I-V Curves: for several irradiation levels (PV array: SIEMENS).
Conflict of Interest
The authors declare no conflict of interest.
Acknowledgment
The authors would like to thank to Ministerio del Poder Popular para Ciencia y Tecnolog´ıa, Ministerio del Poder Popular para la Energ´ıa Electrica, Unerven – PDVSA Industrial, pro-´ fessors Humberto Rojas and Carlos Rojas from Facultad de Ciencias de la U.C.V.
- H. L. Nu´n˜ez Ram´irez, G. G. Carvalho Kassar, F. C. Brito Maestre, Y. I.Gamboa Maldonado, L. A. Santos Avendan˜o, C. Gavidia Toro,“Highly Ac- curate and Inexpensive Computational Tool for Improving Photovoltaic Ar- rays Performance and Efficiency Measures” in Proceedings of the IEEE
2018 Open Innovations Conference (OI), Johannesburg, South Africa, 2018. https://doi.org/10.1109/OI.2018.8535899 - S. Chowdhury, S. P. Chowdhury, G. A. Taylor, and Y. H. Song, “Mod- elling, simulation, performance analysis of a PV array in an embed- ded environment”, in Proceedings of the 42nd International Univer- sities Power Engineering Conference (UPEC), , Brighton, UK, 2007. https://doi.org/10.1109/UPEC.2007.4469048
- K. Ishaque, Z. Salam, and H. Taheri, “Simple, fast and accurate two-diode model for photovoltaic modules” Solar Energy Materials and Solar Cells, vol. 95(2), 586-594, 2011. https://doi.org/10.1016/j.solmat.2010.09.023
- N. Hashim and Z. Salam,“Critical evaluation of soft computing methods for maximum power point tracking algorithms of photovoltaic systems” IJPEDS,10(1), 548-561, 2019. https://doi.org/10.11591/ijpeds.v10.i1.pp548- 561
- A. Hemza, H. Abdeslam, C. Rachid and N. Aouan,“Simplified meth- ods for evaluating the degradation of photovoltaic module andmod- eling considering partial shading” Measurement, 138, 217-224, 2019. https://doi.org/10.1016/j.measurement.2019.01.098
- P. A. Gbadega and A. K. Saha, “Effects and Performance Indicators Eval- uation of PV Array Topologies on PV Systems Operation Under Partial Shading Conditions”, in Proceeding of the 2019 Southern African Univer- sities Power Engineering Conference, Bloemfontein, South Africa, 2019. https://doi.org/10.1109/RoboMech.2019.8704823
- T. Ma, W. Gu, L. Shen and M. Li,“An improved and comprehensive mathe- matical model for solar photovoltaic modules under real operating conditions”Energy, 184, 292-304, 2019. https://doi.org/10.1016/j.solener.2019.03.089
- P. Ranjan Satpathy, R. Sharma and S. Dash,“An efficient SD-PAR technique for maximum power generation frommodules of partially shaded PV arrays” Solar Energy, 175, 182-194, 2019. https://doi.org/10.1016/j.energy.2019.03.078
- G. Sai Krishna and T. Moger, “Improved SuDoKu reconfiguration technique for total-cross-tied PV array to enhace maximun power under partial shading conditions” Renewable and Sustainable Energy Reviews, 109, 333-348, 2019. https://doi.org/10.1016/j.rser.2019.04.037
- M. Wolf, G. J. Noel, R. J. Stirn, “Investigation of the double exponential in the current-voltage characteristics of silicon solar cells” IEEE Trans. Electron Devices, 24(4), 419-428, 1977. https://doi.org/10.1109/T-ED.1977.18750
- D. S. H. Chan and J. C. H. Phang, “Analytical Methods for the Extraction of Solar Cell Single- and Double-Diode Model Parameters” IEEE Trans. Electron Devices, 34(2), 286-293, 1987. https://doi.org/10.1109/T-ED.1987.22920
- N. Veissid, A. M. De Andrade, “The I-V silicon solar cell characteristic temper- ature dependence an experimental study using the standard deviation method”, in Proceedings of the 10th European Solar Photovoltaic Energy Conference,
Lisbon, Portugal, 1991. https://doi.org/10.1007/978-94-011-3622-8 11 - A. Gow, C. D. Manning, “Development of a model for photovoltaic ar- rays suitable for use in simulation studies of solar energy conversion systems”, in Proceeding of the 1996 Sixth International Conference on Power Electronics and Variable Speed Drives, Nottingham, UK, 1996. https://doi.org/10.1049/cp:199608909.03.089
- Luque, S. Hegedus, Handbook of Photovoltaic Science and Engineering. Wil- ley, 2nd Edition, 2011.
- A. Smets, K. Ja¨ger, O. Isabella, R. van Swaaij, M. Zeman, Solar Energy- he Physics and Engineering of Photovoltaic Conversion, Technologies and Systems. UIT Cambridge, 2016.
- M. A. Mart´inez, J. M. Andu´jar and J.M Enrique, “A New and Inexpensive Pyranometer for the Visible Spectral Range” Sensors, 9(6), 4615-4634, 2009. https://doi.org/10.3390 15