
Multiple-Optimization based-design of RF Integrated Inductors
Volume 4, Issue 4, Page No 574-584, 2019
Author’s Name: Houcine Marouani1,a), Amin Sallem1, Mondher Chaoui1, Pedro Pereira2, Nouri Masmoudi1
View Affiliations
1LETI-ENIS, University of Sfax, Tunisia
2CTS-UNINOVA, FCT NOVA, Portugal
a)Author to whom correspondence should be addressed. E-mail: houcine.marouani@gmail.com
Adv. Sci. Technol. Eng. Syst. J. 4(4), 574-584 (2019); ![]() DOI: 10.25046/aj040468
DOI: 10.25046/aj040468
Keywords: Metaheuristics; Particle Swarm Optimization; Gravitational Search Algorithm; Differential Evolution; Multi-objective MOPSO; PESAII; MOEA/D; RF Integrated Inductors;

Export Citations
In this paper, a multiple-objective Metaheuristics study is discussed. Initially, three mono-objective metaheuristics will be explored in order to design and optimize Radio-Frequency integrated inductors. These metaheuristics are: An evolutionary algorithm called The Differential Evolution (DE), An algorithm supported on Newton’s laws of gravity and motion called the Gravitational Search Algorithm (GSA) and, finally, A swarm intelligence algorithm called the Particle Swarm Optimization (PSO). The performances of these three mono-objective metaheuristics are evaluated and compared over three benchmark functions and one application to optimize the layout of a RF silicon-based planar spiral inductor, the double π-model is adopted. Secondly, three references multi-objective metaheuristics using Pareto front are used respectively the multi-objective PSO (MOPSO), the Pareto envelope-based selection algorithm-II (PESAII) and the multi-objective evolutionary algorithm based on decomposition (MOEA/D). The performances of these multi-objective optimization algorithms are evaluated and compared over two bi-objective benchmark functions and the same application used in the first section. Two conflicting performances were optimized, namely the quality factor ‘Q’ (to be maximized) and the device area ‘dout’ (to be minimized) for the RF inductor. It was concluded that the multiple-objective PSO are significantly more efficient and robust for difficult problems than the other metaheuristics.
Received: 22 May 2019, Accepted: 11 August 2019, Published Online: 25 August 2019
1. Introduction
Nowadays, the advances in the integration technology agree the conception and the realization of complex integrated electronic systems. Therefore, the decision-making must be broached in an optimal way. Decision making can be seen as a set of the following steps: “Formulation”, “Modelling”, “Optimization”, and “Implementation” of the problem [1]. In order to increase the accuracy of the optimization model, or algorithm, up to an adequate solution is establish, the decision making process could be repeated. The block “Optimization of the problem” is a vital part of this process and can be found in many areas, like engineering among others, and particularly in the topic of Radio Frequency (RF) circuit design [2-4].
The mono-objective optimization algorithms are classified into two categories: the heuristics and the metaheuristics algorithms. In fact, the first category is developed to solve a specific problem [5]. The second category represent a group of optimization techniques where theses popularity are increased during the last two decades and being considered the most successful and promising optimization algorithms [6–8]. The most used ones in the literature are the Evolutionary Algorithms (EA) such as local search (LS), simulated annealing (SA), tabu search (TS), genetic algorithms (GA) [9-14] etc.
Recently, a new group of nature inspired metaheuristic algorithms were published in literature. These metaheuristics are part of Swarm Intelligence. These techniques are based on animal behaviour and insect conduct, aiming to mimic their skills solving daily problems. In the area of Radio Frequency (RF) circuit design, Swarm Intelligence (SI) techniques are broadly applied, and among such techniques the PSO “Particle Swarm Optimization” [15–17], and the ACO “Ant Colony Optimization” [18–21], are the most used.
In this paper a multiple-objective metaheuristics study is discussed. Firstly, we propose to evaluate and compare such references mono-objective metaheuristics optimizing such benchmark functions and one Radio-Frequency application in terms of convergence, robustness and time computing. Three mono-objective algorithms are considered: An evolutionary algorithm entitled the Differential Evolution (DE), an algorithm based on Newton’s laws of gravity and motion entitled the Gravitational Search Algorithm (GSA) [22, 23], and a swarm intelligence algorithm entitled the Particle Swarm Optimization (PSO). The drive issue for this comparative study is to give some sort of substantiation for the choice of the “best” metaheuristic among others [24]. Secondly, multi-objective problems are discussed. A study was conducted to the maximization of the quality factor Q and the minimization of the device area dout for the Radio-Frequency (RF) integrated inductor circuit [25-30]. Three algorithms for multi-objective Pareto optimization [31-39] are used. An evaluation concerning the performances of the three abovementioned multi-objective metaheuristics: the convergence and the robustness analyses are offered [40-41].
The structure of this work is the following. Section 2 presents a summary of the mono-objective metaheuristics used. Results and analysis regarding the convergence and the robustness study of the three algorithms over three benchmarks functions are offered in Section 3. Section 4 reports the application of these mono-objective optimization applied to the layout of a RF silicon-based planar spiral inductor. Section 5 presents the uses of multi-objective algorithm to optimize both the maximum quality factor and to minimize the device area of the RF inductor with three multi-objective algorithms: the multi-objective particle swarm optimization (MOPSO), the Pareto Envelope-based Selection Algorithm II (PESAII) and the Multi-Objective Evolutionary Algorithm based on Decomposition (MOEA/D). A comparison of its performance’s meters is concluded. Finally, Section 6 wrap up the final remarks, conclusion and future works.
2. An overview on the mono-objective metaheuristics
2.1. Differential Evolution algorithm
In 1997, Storn and Price developed the differential evolution (DE), which belongs to evolutionary algorithm category. It is an effective, robust and simple global optimization algorithm [13].
Differential evolution algorithm is similar to the genetic algorithm [25], uses similar genetic operators like crossover, mutation and selection operators. Comparing both algorithms, the best solutions achieve are dependent of the process, the genetic algorithm relies on crossover operators while the differential evolution algorithm on the mutation operation (differential strategy) [26]. DE generates new candidates (trial vectors) of its population according to target vector manipulation and difference vector. Afterwards, it compares the performance of the resulting candidate against the original members, and if it shows to have a better solution, it changes it; else, keep the original candidate. The differential evolution algorithm technique uses three operators: mutation, crossover and selection.
2.1.1. Mutation Operator
The mutation operator is defined as follows:

Where Vk+1 is the ith trial vector produced by the mutation strategy; k represents the generation to which the population belongs; r1, r2, and r3 are mutually exclusive integers arbitrarily generated from 1 to N (N is the population size) and F is a scaling factor with optimal value in the range of 0.5 to 1.0.
2.1.2. Crossover Operator
One the mutation operation is done, the crossover operator is applied to maintain the miscellany of the population. The crossover operator generates the offspring individual Ui at the kth generation by selecting the solution component values from Xi or Vi, using the following equation (2):
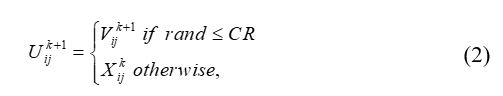
2.1.3. Selection Operatorwhere
CR: the crossover probability [0, 1].
The selection operator is adopted to compare the trial vector with the target vector if the fitness of the trial vector is more suitable than the target vector. Such operation, which occurs every kth generation, is presented in equation (3):
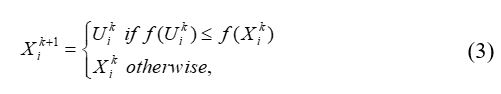
The flowchart of DE algorithm is given in Figure 1.where f: the fitness function.
2.2. Gravitational Search Algorithm
In [22, 23], the authors proposed the gravitational search algorithm as a new swarm intelligence metaheuristic. This metaheuristic is based on Newton’s laws of gravity and motion. In GSA, a cluster of agents (solutions) named masses are used to solve and find the optimal solution (best agent). Based on the gravitational force, where all objects are attracted among each other, and this force causes a global movement of such objects towards objects with heavier masses [23]. The weightier masses, representing the best solutions, are known for moving slowly compared to those less heavy. The GSA is represented by N agents, where the position of the ith object is defined with (4):
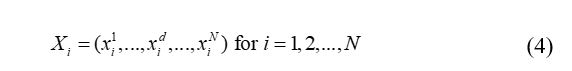
The mass values of every objects are defined by (5):where is the position of ith object in the dth dimension and N is dimension of the problem to be optimized.
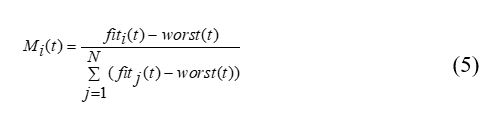
To estimate the total forces and the acceleration of an agent, it should be evaluated over gravity law, equation (7), then equation (8). Resulting, the new velocity is calculated by equation (9) and the new position is computed by equation (10).where , represents the fitness value and the mass value of the object i at t, and is evaluated by (6):
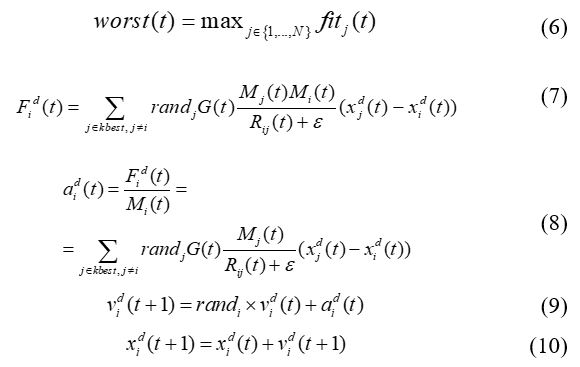
The flowchart of GSA algorithm is given in Figure 2.where is the Euclidian distance between two agents, i and j defined as . kbest is the set of first K agents with the best fitness value and biggest mass. kbest is a function of time, which is initialized to k0 at the beginning and is decreased with time. k0 is adjusted to N and reduced linearly to 1. Moreover, G is reduced in a exponentially way from G0 toward zero by time.
2.3. Particle swarm optimization
The particle swarm optimization algorithm is a swarm-intelligent metaheuristic proposed by Kennedy and Eberhart [15]. PSO is an optimization algorithm that describes the social behavior of animals like birds and fish in search of food.
In PSO, each particle (solution) flies through the design/search space and moves randomly in the following three simple rules:
Cohesion: the particles are attracted to the average position of the group or best position ‘pbest’;
Alignment: the optimal value attained until here via every particle in the social neighbourhood ‘lbest’,
Separation: to avoid collisions, particles keep a certain distance between them, the optimal particle position found in all the swarm ‘gbest’.
Therefore, the new velocity and the particle position on the next iteration are performed through equations (11) and (12):
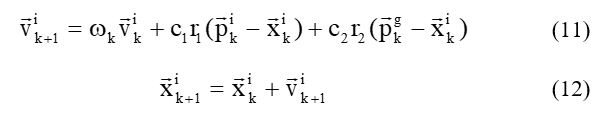
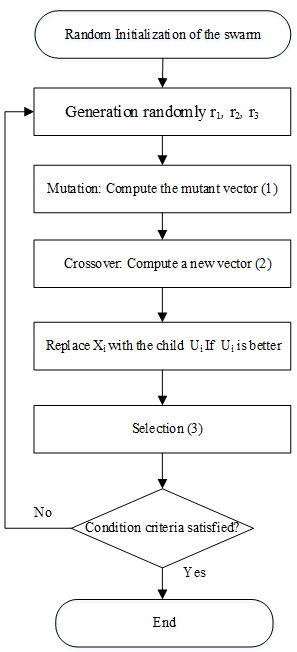 Figure 1: DE Flowchartis an inertia weight, defined via a decreased inertia function by equation (13) in the training progress for objective the reduction of the influence of the past velocities.
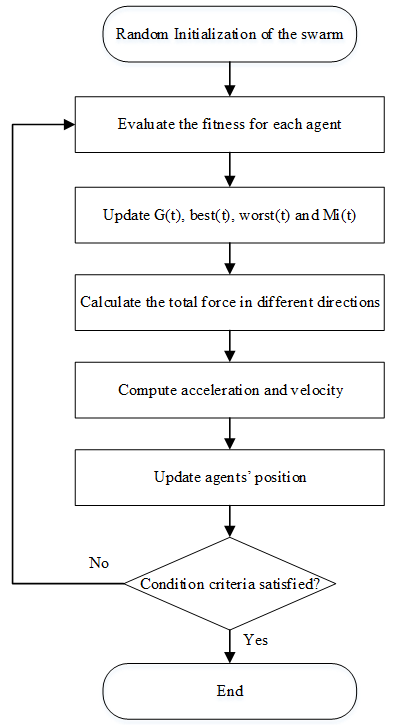
Figure 2: GSA Flowchart
Where
: the cognition learning rate,
: the social learning rate,
: the best individual position,
: the best global position,
: two random parameters [0,1].
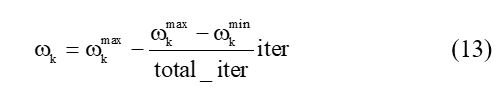
: the initial weight,where
: the final weight,
total_iter: the number of the total iteration,
iter: the number of the current iteration.
The flowchart of PSO algorithm is given in Figure 3.
3. Application examples: the mono-objective problems
3.1. Benchmark function
Three mono-objective metaheuristics are used respectively the DE, GSA and PSO over three benchmark functions. A robustness study regarding the aforementioned metaheuristics is presented. The parameters used to characterize the three algorithms are shown in Tables 1, 2 and 3. For simulation and study proposes, the three metaheuristics were tested 100 times for each one of the benchmark functions.
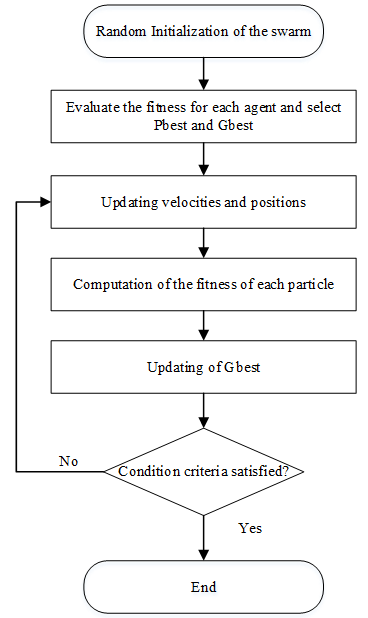 Figure 3: PSO Flowchart
Table 1: The DE parameters
| Population size | Number of Iterations. | beta_min | beta_max | CR |
| 100 | 1000 | 0.2 | 0.8 | 0.2 |
Table 2: The GSA parameters
| Number of agents | Number of Iterations. | Elitist Check | Rpower | min_flag |
| 100 | 1000 | 1.0 | 1.0 | 1.0 |
Table 3: The PSO parameters
| Swarm size | Number of Iterations. | w | c1 | c2 |
| 100 | 1000 | 1.0 | 1.5 | 2.0 |
3.1. Benchmark function application
In object to check performances of such mono-objective metaheuristics, a bunch of commonly used benchmark functions, considering this sort of problems/algorithms, were used [24]. These problems permit testing these mono-objective algorithms to confirm their convergence, concerning the approximation to the global solution [8, 18, 24]. The set of three benchmark functions are offered in Table 4.
Table 4: The benchmark functions
| Item Function | Objective functions to minimize |
| Function #1 | Range: [-100; 100]; Dim n=2 |
| Function #5 | Range: [-30; 30]; Dim n=2 |
| Function #7 |
Range: [-1.28; 1.28]; Dim n=2 |
3.2. Optimization results
# Function F1
The results of the benchmark function F1 are compared via the correspondent three optimization algorithms, as illustrated in Figure 4.
A Boxplots representation is used (due to probabilistic characteristic of these metaheuristics) to display the distribution of obtained measures [27]. In the following, 100 runs are considered for this function. The robustness analysis using the box-plot for the benchmark function F1 is presented in Figure 5.
# Function F5
The results of the benchmark function F5, via the correspondent three optimization algorithms, are represented in Figure 6.
In the following, 100 runs are considered for function F5. The robustness analysis using the box-plot for the benchmark function is presented in Figure 7.
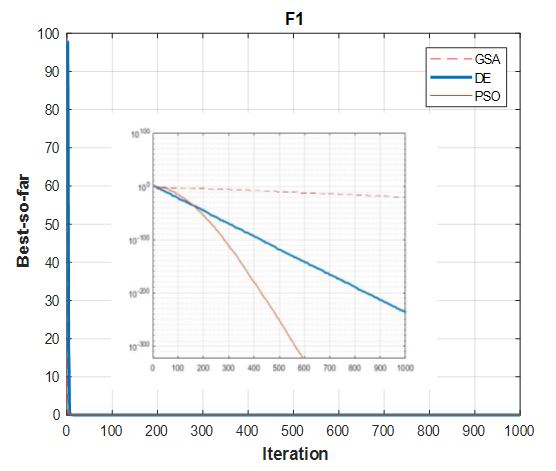 Figure 4: Convergence results of F1 with GSA, DE and PSO.
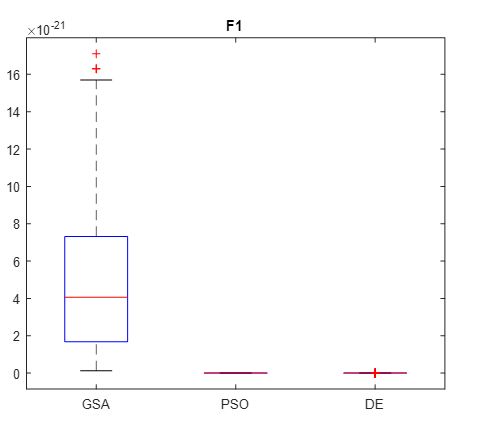 Figure 5: Robustness analysis of F1
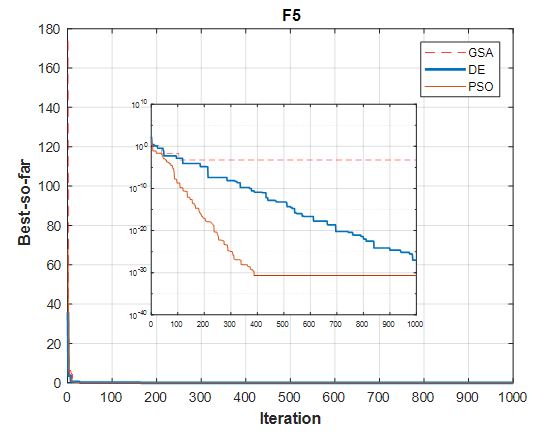 Figure 6: Convergence results of F5 with GSA, DE and PSO.
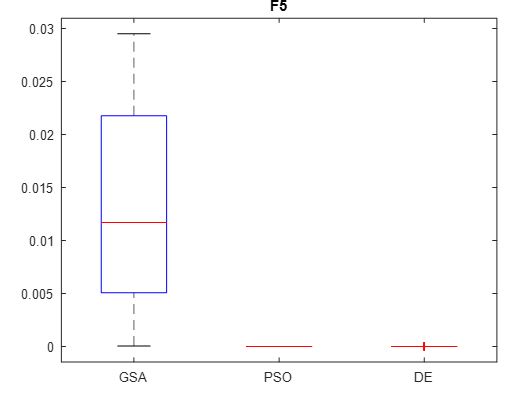 Figure 7: Robustness results of F5.
# Function F7
The optimization results of the benchmark function F7, via the corresponding three algorithms, is illustrated in Figure 8. 100 runs are considered for function 7. The robustness analysis using the box-plot for the benchmark function F7 is presented in Figure 9.
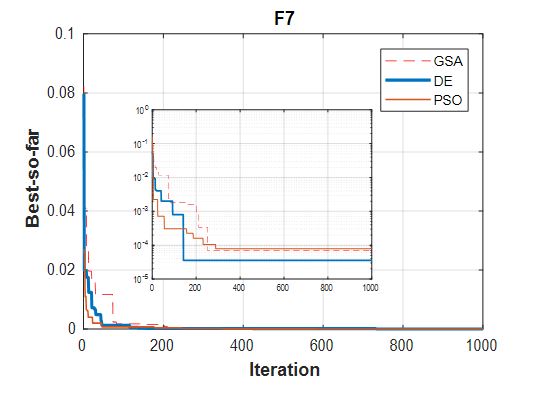 Figure 8: Convergence results of F7 with GSA, DE and PSO.
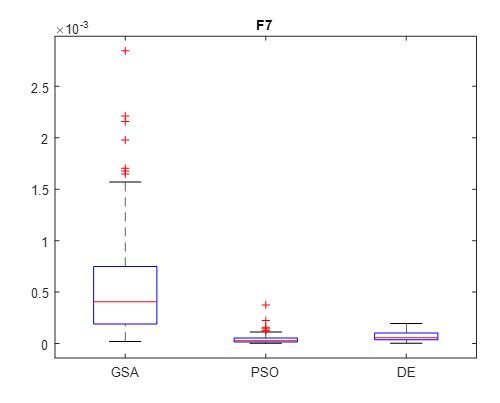 Figure 9: Robustness results of F7.
Figure 10 presents a Radio Chart representation of the average (AVG) execution times over 100 runs of three algorithm GSA, DE and PSO for the three benchmark functions.
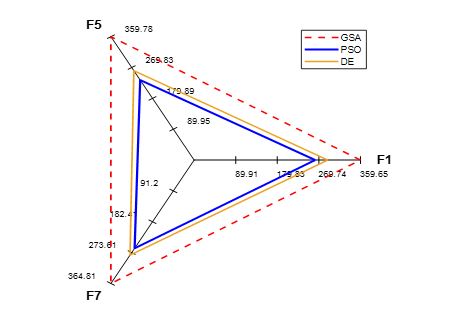 Figure 10: The average computing time of GSA, DE and PSO.
In accordance with the convergence of results regarding the three mono-objective metaheuristics according to the three benchmarks functions (Figures 4, 6 and 8) and the robustness results displayed in Figures 5, 7 and 9, we notice that DE and PSO have the better results compared to GSA.
The average executing time is illustrated in Figure 10. This figure shows that PSO is faster than DE and GSA.
Therefore, and according to the results achieved, the PSO algorithm is the most efficient algorithm, as it presents a best compromise among convergence, robustness and computational time.
3.2. Application example: RF spiral inductors
An overview on the integrated spiral inductors
CMOS technology is nowadays the only option able to fit the low-cost demand and to integrate digital, as well as analog radio-frequency (RF) modules on a single chip to realize the RF system on-chip (SoC). The efficiency and reliability of CMOS-RF blocks can be improved by means of on-chip passive devices (same substrate), such as voltage-controlled oscillators (VCO), low-noise amplifiers (LNA) and especially CMOS spiral inductor. Spiral inductor is broadly used and their applications in millimeter-wave circuit are investigated. High performance on-chip inductor has become increasingly important with their increasingly frequencies operation of the circuits.
Integrated spiral inductors models are based on the layout parameters, as displayed in Figure 11. These parameters are:
w: the inductor width,
s: the spacing between track,
n: the number of turns,
Nside: the inductor shape (square, hexagonal, octagonal),
din: the internal diameter,
dout: the external diameter.
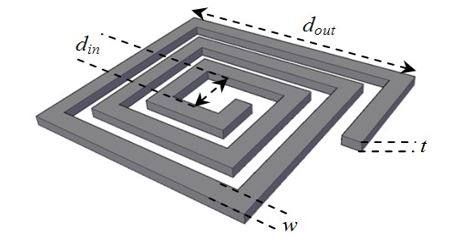 Figure 11: Layout characteristics for a square inductor.
For assessing the quality of the inductor design, different characteristics may be considered: the quality factor (Q), the operation frequency for the maximum Q, the self-resonant frequency fSR, the inductance value L or the area. In this work, two parameters are selected: the quality factor Q and the device area dout. Therefore, all the abovementioned characteristics are strongly dependent on the spiral inductor geometric parameters, technological constraints parameters and the application of this RF inductor.
At high frequencies, the simple but widely used single-π equivalent-circuit model can’t accurately characterize the electrical performance of silicon-based planar spiral inductor. Many other equivalent-circuit inductor models have been reported in past decade [28]. In this paper, the double-π model is adopted and illustrated in Figure 12. This model lumped-element is evaluated with a wide range of equations and these values are specified in [29-30]. This model is represented by:
DC parameters (Rs, Rp, Lo, Lp);
Crossover capacitance, Cs: referred as the capacitance between the spiral and the underpass required to connect the outside to the inner turn of the planar inductor;
Metal-to-metal capacitance, Cc: effect due to the proximity of inductor tracks;
Metal-to-substrate capacitance, Cox;
Rsub and Csub: the ohmic losses in the conductive silicon substrate;
Rsc: the electric coupling between lines over the conductive substrate.
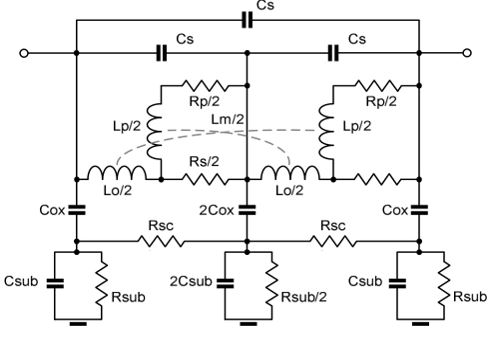 Figure 12: Inductor double π-model.
Table 5: Physical parameters
| Parameters | Value |
| Metal Thickness (t) | 2.8 µm |
| Space between turns (s) | 2.5 µm |
| Sheet Resistance | 10 mΩ/ |
| Oxide Thickness | 5.42 µm |
| Oxide Thickness between spiral and underpass | 0.26 µm |
| Oxide Permittivity (εr) | 4 |
| Substrate Thickness | 700 µm |
| Substrate Permittivity (εr) | 11.9 |
| Substrate Resistivity | 28 Ω cm |
3.3. Optimization results
In this section, results highlight the ability of the PSO algorithm to perform the spiral inductor on Silicon technologies, the UMC130 technology is addressed. The conception for two inductors with 5.0 nH value, 6 nH value operating at 0.7 and 1 GHz, respectively, is considered. The technological and physical parameters are presented in Table 5, whereas the determination of the layout parameters is enabled with the uses of the constraint’s parameters or technology constraints represented in Table 6. In addition, is considered a minimum space between tracks (s) of 2.5 µm and a maximum output diameter dout of 250 µm.
Table 6: Constraints parameters
| Parameters | Min | Max |
| w (µm) | 5.0 | 20.0 |
| din(µm) | 20.0 | 80.0 |
| n | 1.5 | 15.5 |
The inductor quality factor Q, desired to be higher as possible, is the objective function to be optimized.
Figures 13 displays the optimization results with PSO algorithm (13.a, 13.b) for two inductors: the first inductor of 5.0 nH value operating at 0.7 GHz and the second inductor of 6 nH value operating at 1 GHz. The maximization of the quality factor Q is addressed.
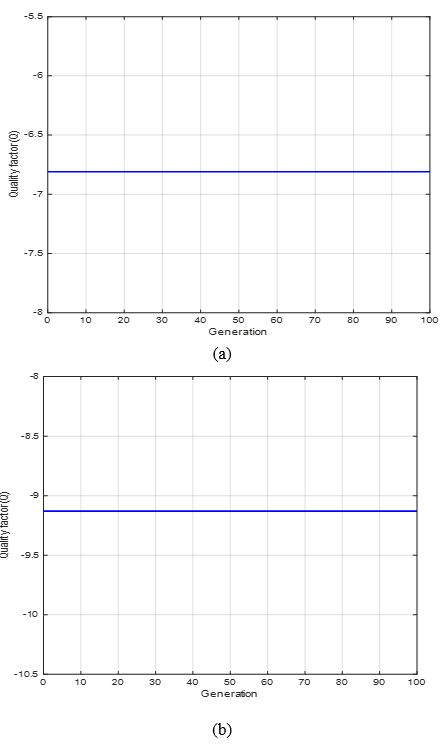 Figure 13: Optimization results with PSO (Quality factor Q vs. Generation): (a) 5 nH, frequency= 0.7 GHz, (b) 6 nH, frequency= 1 GHz.
Table 7 gives the optimization results values (inductor sizes) with PSO algorithm.
Table 7: Optimization and simulation results
| L = 5nH, Frequency = 0.7 GHz | ||||||
| Algorithm |
w (µm) |
din (µm) |
n |
dout-Op (µm) |
QOp | |
| PSO | 10.88 | 60.40 | 5.67 | 206.91 | 6.81 | |
| L = 6nH, Frequency = 1.0 GHz | ||||||
| Algorithm |
w (µm) |
din (µm) |
n |
dout-Op (µm) |
QOp | |
| PSO | 9.00 | 61.90 | 6.08 | 196.90 | 9.13 | |
4. Application examples: the multi-objective Optimization Algorithms
4.1. The multi-objective particle swarm optimization
Multi-Objective Particle Swarm Optimization (MOPSO) is proposed by Coello et al., [31]. The goal of the MOPSO and generally all the multi-objective algorithms is to provide a set of Pareto optimal solutions (with non-dominated solutions) of the aforementioned problem. All the non-dominated particles, this means all solutions, in the swarm are then collected into a sub-swarm named repository, and each particle selects its global best target. A group of MOPSO can be found in related literature, like:
The non-dominated sorting PSO [32],
The MOPSO using the Crowding Distance mechanism associated with a mutation operator which increasing the exploration ability of the particles and maintains the diversity of non-dominated solutions in the external archive by MOPSO-CD [33-35],
The MOPSO using the Crowding Distance mechanism associated with a mutation operator and the Roulette Wheel selection technique to select social leader or global best to avoid an excessive number of non-dominated solutions in the external archive MOPSO-CDR [36].
The MOPSO version used in this paper use the Grid Making technique, instead of the crowing-distance computation which requires sorting the population consistent with each objective function value in ascending order of magnitude. This version uses the Grid Making technique with the mutation operator and the Roulette Wheel selection called MOPSO-GMR [37]. The flowchart of MOPSO algorithm is given in Figure 14.
4.2. Multi-Objective Evolutionary Algorithm based on Decomposition
The multi-Objective Evolutionary Algorithm supported on Decomposition (MOEA/D) is an evolutionary algorithm. The MOEA/D has adopted a technique that consists in decomposing the multi-objective optimization problems into several single-objective, called sub-problems. Each sub-problem has its own best solution ever found which is determined associating all of solutions found by algorithm. There are several methods to define the decomposed objective functions, for example: the weighted sum, the distance or the norm of difference vector, the predefined ideal point in the objective space. The MOEA/D algorithm is developed by Zhang and Li [38]. The flowchart of MOEA/D algorithm is given in Figure 15.
4.3. Pareto Envelope-based Selection Algorithm II
The third multi-objective algorithm is an evolutionary algorithm: Pareto Envelope-based Selection Algorithm II (PESA-II). The PESA-II is based in the same genetic algorithm mechanism associated with the selection based on Pareto envelope. The PESA-II is configured with an external archive to save the approximate Pareto solutions. This means that the Parents and the mutants are selected based on the grids created as well as in the geographical distribution of archive members (external archive) [39].
The general process of the PESAII algorithm is as follows, with IP is the size of the internal population and EP is the size of the external populations(archive). The flowchart of PESAII algorithm is given in Figure 16.
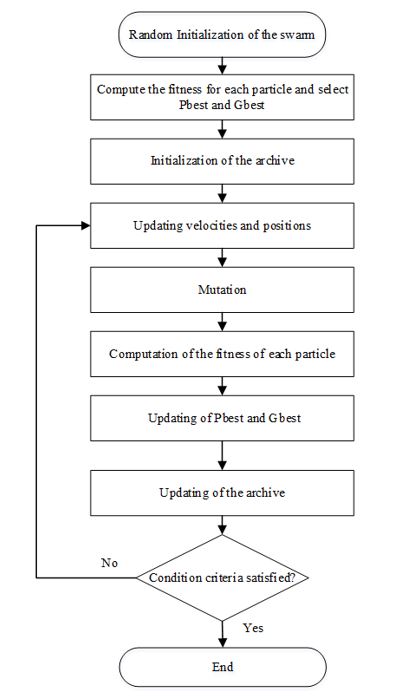 Figure 14: MOPSO Flowchart
4.4. Performances metrics: Hypervolume (HV)
The quality of the Pareto Fronts obtained by the multi-objectives algorithms can be evaluated through a few metrics. The most used performance metric was the hypervolume (HV) metric, also known as S-metric or hyper-area. The hypervolume indicator considers all three aspects: accuracy, diversity and cardinality.
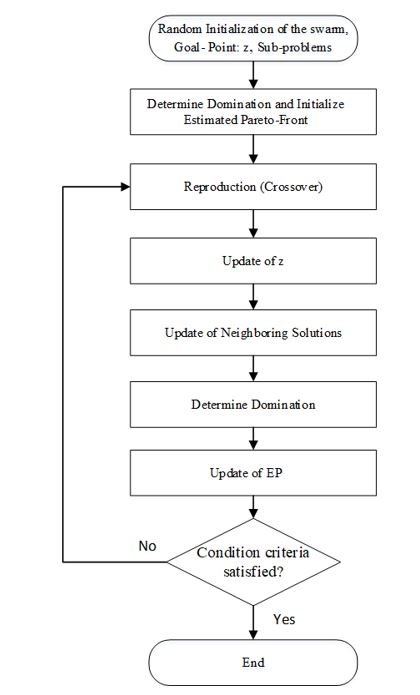 Figure 15: MOEA/D Flowchart
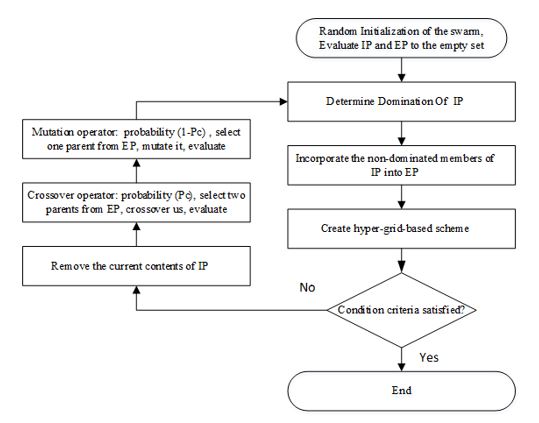
Figure 16: PESAII Flowchart
Thus, it is possible to measure the size of the objective space enclosed by an approximation set. To compute such enclosed space a reference point must be adopted. Figure 17 display a graphical representation of this performance indicator. Whenever one approximation set completely dominates another approximation set, the first HV will be superior than the second. Therefore, the HV is supposed to be Pareto compliant [40-41].
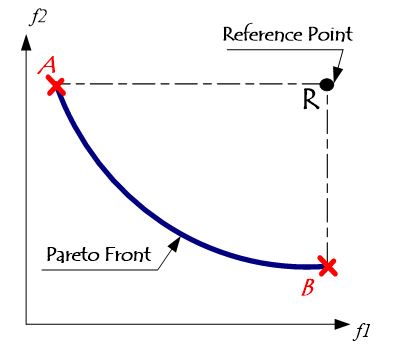 Figure 17: Example of the dominated Hypervolume in 2D.
4.5. Results of the test function and RF inductor applications
The aim consists of optimizing two conflicting performances: maximizing the Quality factor Q, and minimizing the device area, dout by generating the trade-off surface (Pareto front). We give optimization results using the well-known PESAII and MOEA/D techniques for a RF inductor with value of 6 nH at 1 GHz. Also, two test function of ZDT family are used for benchmarking the performance of multi-objective Pareto optimization methods are illustrated in table 8.
Table 8: Multi-objective benchmark functions of Zitzler (ZDT)
| Item Function | Objective functions to minimize |
|
ZDT1 Objectives=2 Range: [0; 1]; Dim n=30 |
|
|
ZDT6 Objectives=2 Range: [0; 1]; Dim n=10 |
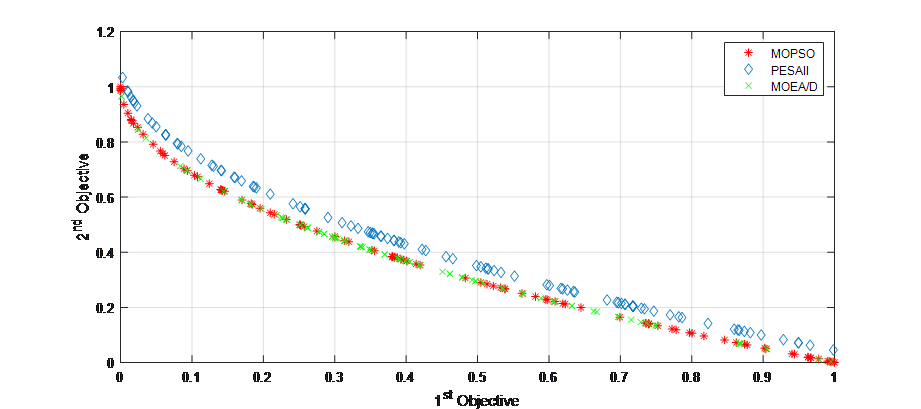 Figure 18: Pareto Front (MOPSO vs. PESAII vs MOEA/D) for ZDT1.
Figure 18, 19 and 20 represents the Pareto fronts obtained using MOPSO, PESAII and MOEA/D for ZDT1, ZDT6 and RF inductor application, respectively. Where it can be noticed that the better distribution given by MOPSO, when compared to PESAII and MOEA/D.
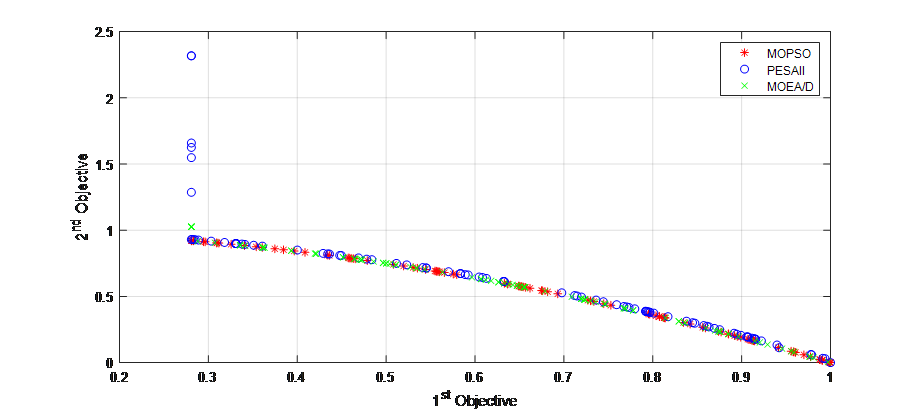 Figure 19: Pareto Front (MOPSO vs. PESAII vs MOEA/D) for ZDT6.
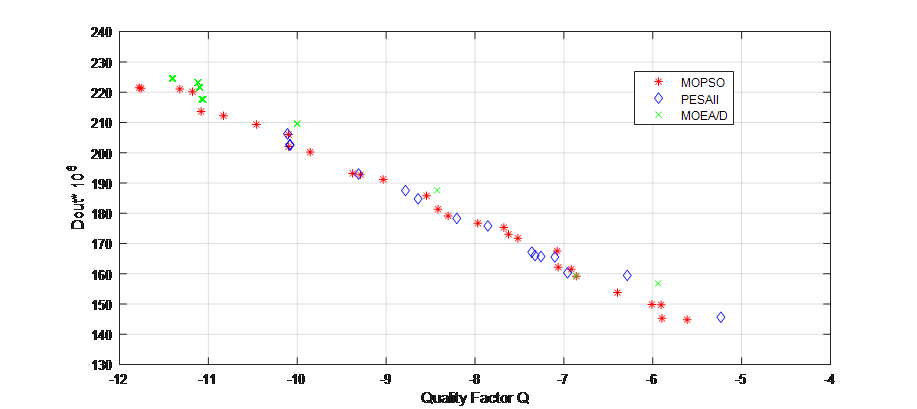 Figure 20: Pareto Front (MOPSO vs. PESAII vs MOEA/D) for RF inductor.
4.5.1. The hyper-volume indicator HV
Table 9 presents the average, maximum, minimum, and deviation values of the hypervolume indicator, over 20 runs of each algorithm, for two test function ZDT1, ZDT6 and the RF inductor application.
Table 9: Average, max, min, and standard deviations of the hypervolume indicator
| PESAII | MOEA/D | MOPSO | ||
| ZDT1 | Avg | 0.6918 | 0.7291 | 0.7587 |
| Max | 0.7087 | 0.7563 | 0.7609 | |
| Min | 0.6643 | 0.6488 | 0.7558 | |
| Std | 0.0139 | 0.0346 | 0.0019 | |
| ZDT6 | Avg | 0.4782 | 0.4506 | 0.4869 |
| Max | 0.4873 | 0.4843 | 0.4893 | |
| Min | 0.4675 | 0.3840 | 0.4849 | |
| Std | 0.0063 | 0.0577 | 0.0016 | |
| RF Inductor | Avg | 0.5235 | 0.3272 | 0.5496 |
| Max | 0.5260 | 0.4113 | 0.5508 | |
| Min | 0.5196 | 0.2663 | 0.5476 | |
| Std | 0.0025 | 0.0577 | 0.0017 |
Figure 21 represents the average value of the HV indicators for the 3 multi-objective problems. As a consequence, the MOPSO algorithm admits the highest average value of the HV indicator.
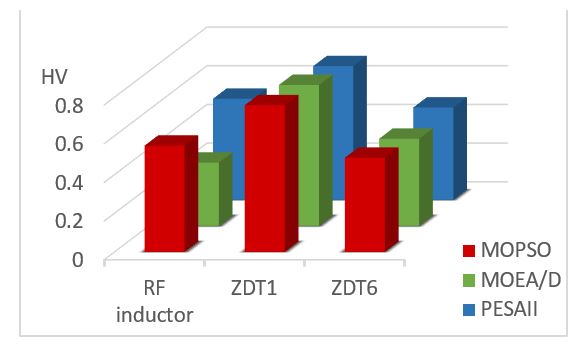 Figure 21: Average values of the HV indicators for the 3 multi-objective problems
4.5.2. Computing time
The maximum and the minimum execution times over 20 runs of each algorithm, is given in Table 10. Figure 16 displays the average value of the execution times.
Table 10: Average, Max and Min of the execution time
| Time(S) | PESAII | MOEA/D | MOPSO | |
| ZDT1 | Avg | 152.69 | 278.48 | 62.94 |
| Max | 157.56 | 281.77 | 73.90 | |
| Min | 149.64 | 275.02 | 55.67 | |
| ZDT6 | Avg | 130.46 | 281.47 | 58.55 |
| Max | 137.07 | 294.05 | 66.35 | |
| Min | 125.49 | 268.88 | 54.36 | |
| RF Inductor | Avg | 105.91 | 166.25 | 54.71 |
| Max | 106.53 | 221.28 | 58.07 | |
| Min | 105.28 | 141.38 | 51.58 |
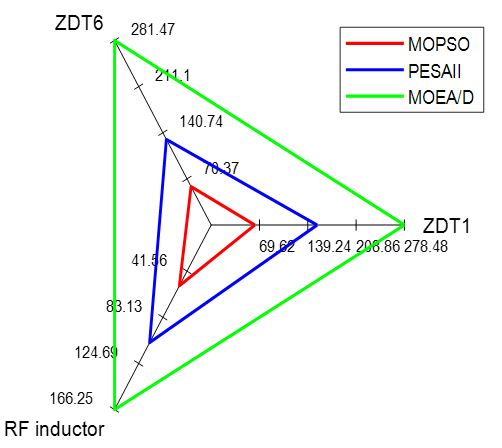 Figure 22: AVG execution time considering the three multi-objective problems
A comparison of the execution times is illustrated using the Radio Chart representation (figure 12) aiming to highlight the speediness of each algorithm. It can easily conclude that MOPSO is the faster when compared with other metaheuristics.
5. Conclusion
An objective comparison among the optimization results obtained via multiple-objective metaheuristics, dealing with performance optimization of RF circuits, is presented in this work. In first part, mono-objective metaheuristics are used. Among these metaheuristics the Swarm Intelligence metaheuristics like the Particle Swarm Optimization (PSO) and the Evolutionary Algorithms such us the Gravitational Search Algorithm (GSA) and the differential evolution algorithm (DE). These three algorithms were used to optimize three benchmark functions and the RF integrated inductors configured with the inductor double π-model. Results obtained shows that the use of swarm-based techniques in sizing and designing RF circuit offers a good argument, principally the PSO algorithm. In second part of this paper, we applied the multi-objective technique to solve two conflicting performances problem: the quality factor (Q) maximization as well as the minimization of the device area (dout) of the same RF application example using three multi-objective algorithms: firstly the multi-objective particle swarm optimization (MOPSO); secondly the multi-objective Evolutionary Algorithm based on decomposition (MOEA/D) and, a third one, the Pareto Envelope-based Selection Algorithm-II (PESA-II) by generating the trade-off surface (Pareto-front). The results obtained, which are supported by two performance metrics, a) the hypervolume indicator (HV) and b) the execution time, shows the following: MOPSO is better than other metaheuristics according to HV indicators, also MOPSO is the faster than other metaheuristics according to the CPU computing times.
- E.-G. Talbi, Metaheuristics: from design to implementation, Wiley, 2009.
- J. Dréo, A. Pétrowski, P. Siarry, E. Taillard, Metaheuristics for hard optimization: methods and case studies, Springer, 2006.
- M. Köppen, G. Schaefer, A. Abraham, Intelligent Computational Optimization in Engineering, Springer, 2011.
- F. Padilla, A. Torres, J. Ponce, M. D. Torres, S. Ratté, E. Ponce-de-Leon, “Evolvable metaheuristics on circuit design”, in: Advances in analog circuits, E. Tlelo-Cuautle (Ed.), Intech, 2011. http://dx.doi.org/10.5772/14688
- G. Polya, How to Solve It, Princeton University Press, Princeton, NJ, 1945.
- A. Daniel, Evolutionary Computation for Modeling and Optimization, Springer, 2006.
- A. E. Eiben, J. E. Smith, Introduction to evolutionary computing, Natural Computing Series, Springer, 2007.
- P. Siarry, Z. Michalewicz, Advances in metaheuristics for hard optimization, Natural Computing Series, Springer, 2008.
- J. Holland, Adaptation in Natural and Artificial Systems: An Introductory Analysis with Applications to Biology, Control, and Artificial Intelligence, University of Michigan Press, 1975.
- D. E. Goldberg, Genetic Algorithms in Search, Optimization, and Machine Learning, Addison-Wesley Educational Publishers Inc, 1989.
- K. Y. Lee, M. A. El-Sharkawi, Modern Heuristic Optimization Techniques: Theory and Applications to Power Systems, IEEE Press Series on Power Engineering, 2008.
- S. Kirkpatrick, C.D. Gelatt, M.P. Vecchi, ‘‘Optimization by Simulated Annealing’’, Science, New Series, 220(4598), 671-680, 1983. https://doi.org/10.1126/science.220.4598.671
- K.V. Price, R. M. Storn, J. A. Lampinen, Differential Evolution: a practical approach to global optimization, Springer, 2006.
- M. Fakhfakh, Y. Cooren, A. Sallem, M. Loulou, P. Siarry, ‘‘Analog circuit design optimization through the particle swarm optimization technique’’, Analog integrated circuits and signal processing, 63(1), 71–82, 2009. https://doi.org/10.1007/s10470-009-9361-3
- J. Kennedy, R. C. Eberhart, ‘‘Particle swarm optimization’’, Proceedings of the IEEE international conference on neural networks,1942-1948, 1995.
- R. A. Vural, T. Yildirim, ‘‘Analog circuit sizing via swarm intelligence’’, AEU – International journal of electronics and communications, 66(9), 732–740, 2012. https://doi.org/10.1016/j.aeue.2012.01.003
- B. Benhala, P. Pereira, A. Sallem, Focus on Swarm Intelligence Research and Applications, Nova Science Publishers, 2017.
- A. Sallem, B. Benhala, M. Kotti, M. Fakhfakh, A. Ahaitouf, M. Loulou, ‘‘Application of swarm intelligence techniques to the design of analog circuits: evaluation and comparison’’, Analog Integrated Circuits and Signal, Processing, 75(3), 499-516, Springer, 2013. https://doi.org/10.1007/s10470-013-0054-6
- M. Kotti, B, Benhala, M. Fakhfakh, A. Ahaitouf, B. Benlahbib, M. Loulou, A. Mecheqrane, ‘‘Comparison between PSO and ACO techniques for analog circuit performance optimization’’, The international conference on microelectronics, 2011. https://doi.org/10.1109/ICM.2011.6177367
- B. Benhala, A. Ahaitouf, M. Fakhfakh, A. Mechaqrane, B. Benlahbib, ‘‘Optimal analog circuit sizing via ant colony optimization technique’’, International journal of computer science and network security, 11(6), 223-231, 2011.
- B. Benhala, A. Ahaitouf, M. Kotti, M. Fakhfakh, B. Benlahbib, A. Mecheqrane, M. Loulou, F. Abdi, E. Abarkane, “Application of the ACO technique to the optimization of analog circuit performances”, In: Analog Circuits: Applications, Design and Performance, E. Tlelo Cuautle (Ed.), NOVA Science Publishers, Inc, 2011.
- E. Rashedi, H. Nezamabadi-pour, S. Saryazdi, ‘‘GSA: A Gravitational Search Algorithm’’, Information Sciences, 179, 2232–2248, 2009. https://doi.org/10.1016/j.ins.2009.03.004
- S. Jianga, Y. Wanga, Z. Jiaa, ‘‘Convergence analysis and performance of an improved gravitational search algorithm’’, Applied Soft Computing, 24, 363-384, 2014. https://doi.org/10.1016/j.asoc.2014.07.016
- https://www.sfu.ca/~ssurjano/optimization.html(Accessed 13May 2019).
- D. E. Goldberg, Genetic Algorithms in Search, Optimization, and Machine Learning, Addison-Wesley Educational Publishers Inc, 1989.
- M. Ali, A. Torn, ‘‘Population set based global optimization algorithms: some modifications and numerical studies’’, Computer Operation Research, 31(10), 1703-1725, 2004. https://doi.org/10.1016/S0305-0548(03)00116-3
- J. M. Chambers, W. S. Cleveland, B. Kleiner, P. A. Tukey, Graphical methods for data analysis, Duxbury Press, 1983.
- Yu Cao, R. A. Groves, N. D. Zamdmer, J.-O. Plouchart, R. A. Wachnik, Xuejue Huang, T. -J. King, Chenming Hu, ‘‘Frequency-independent equivalent-circuit model for on chip spiral inductors’’, IEEE Journal of Solid-State Circuits, 38(3), 419-426, 2003. https://doi.org/10.1109/JSSC.2002.808285
- P. Pereira, A. Sallem, M. Fakhfakh, M. H. Fino, F. Coito, A Technology Aware Optimization of RF Integrated Inductors, In: Tlelo-Cuautle E. (ed.) Analog Circuits: Applications, Design and Performance, Nova Science Publishers, Inc., 213-234, 2012.
- P. Pereira, M. H. Fino, F. Coito, M. Ventim-Neves, ‘‘RF Integrated Inductor Modeling and its Application to Optimization-Based Design’’, In: Analog Integrated Circuits and Signal Processing, 73(1), 4-55, Springer Netherlands, 2011. https://doi.org/10.1007/s10470-011-9682-x
- A. C. Coello and M. S. Lechuga, “MOPSO: A Proposal for Multiple Objective Particle Swarm (2002),” Proc. 2002 Congr. Evol. Comput. CEC’02 (Cat. No.02TH8600), 2, 1051–1056, 2002.
- X. Li, “A Non-dominated Sorting Particle Swarm Optimizer for Multiobjective Optimization,” 37–48, 2007,2003. https://doi.org/10.1007/3-540-45105-6_4
- M. R. Sierra and C. A. Coello, “Improving PSO-Based Multi-objective Optimization Using Crowding, Mutation and ∈-Dominance,” in EMO’2005, LNCS 3410. 505–519, 2010. https://doi.org/10.1.1.79.8066
- Deb, K., Pratap, A., Agarwal, S.; Meyarivan, T., “A fast and elitist multi-objective genetic algorithm: NSGA-II”, IEEE Transactions on Evolutionary Computation, 6(2): 182-197. https://doi.org/10.1.1.17.7771
- A. Sallem, B. Benhala, M. Kotti, M. Fakhfakh, A. Ahaitouf, and M. Loulou, “Application of swarm intelligence techniques to the design of analog circuits: Evaluation and comparison,” Analog Integr. Circuits Signal Process., 75(3), 499–516, 2013. https://doi.org/10.1007/s10470-013-0054-6
- R. A. Santana, M. R. Pontes, and C. J. A. Bastos-Filho, “A multiple objective particle swarm optimization approach using crowding distance and roulette wheel,” in ISDA 2009 – 9th International Conference on Intelligent Systems: Design and Applications, 1, 237–242, 2009. https://doi.org/10.1109/ISDA.2009.73
- http://yarpiz.com/category/multiobjective-optimization(Accessed 13 May 2019).
- Z. Qingfu and L. Hui, “MOEA/D: A Multiobjective Evolutionary Algorithm Based on Decomposition,” IEEE Trans. Evol. Comput., 11(6), 712–731, 2007. https://doi.org/10.1109/TEVC.2007.892759
- D. W. Corne, J. D. Knowles, and M. J. Oates, “The Pareto Envelope-Based Selection Algorithm for Multiobjective Optimization,” no. Mcdm, 839–848, 2000. https://doi.org/10.1007/3-540-45356-3_82
- L. Thiele and E. Zitzler, “Multiobjective Evolutionary Algorithms: A Comparative Case Study and the Strength Pareto Approach,” IEEE Trans. Evol. Comput., 3(4), 257–271, 1999.
- E. Zitzler, D. Brockhoff, and L. Thiele, “The hypervolume indicator revisited: On the design of pareto-compliant indicators via weighted integration,” Evolutionary Multi-Criterion Optimization. 862–876, Springer, 2007. https://doi.org/10.1007/978-3-540-70928-2_64