
Study and Implementation of Various Image De-Noising Methods for Traffic Sign Board Recognition
Volume 4, Issue 4, Page No 545-560, 2019
Author’s Name: M. Monica Subashini1,a), Abhinav Deshpande1, Ramani Kannan2
View Affiliations
1School of Electronics Engineering (SENSE), Vellore Institute of Technology (VIT), Vellore, 632014, India
2Department of Electrical and Electronics Engineering, Universiti Teknologi PETRONAS (UTP), 32610, Malaysia
a)Author to whom correspondence should be addressed. E-mail: monicasubashini.m@vit.ac.in
Adv. Sci. Technol. Eng. Syst. J. 4(4), 545-560 (2019); ![]() DOI: 10.25046/aj040466
DOI: 10.25046/aj040466
Keywords: Color, Shape, Image De-noising, Gaussian Filter, Deep Neural Network (DNN), Harmonic Filter, Arithmetic Mean Filter, Circular Averaging Filter (Pillbox), Anisotropic Diffusion Filtering, Non-Local Means

Export Citations
The problem of recognizing traffic sign boards in a correct fashion is one of the major challenges since there is an alarming rate of increase in the number of road accidents happening because of incorrect interpretation of traffic sign boards in bad weather conditions. In this paper, a comparative analysis of various noise removal techniques based on calculating different parameters which decide the quality of input roadway symbol like Mean Squared Error (MSE), Peak Signal to Noise Ratio (PSNR) as well as Structural Similarity for measuring Image Quality (SSIM) is being performed and the best technique will be chosen among them which gives minimum Mean Squared Error (MSE) value and maximum Peak Signal to Noise Ratio (PSNR) and Structural Similarity for measuring the Image Quality (SSIM) values. This technique will be quite useful for de-noising a given image which is present in both the testing and the training image databases.
Received: 04 March 2019, Accepted: 29 July 2019, Published Online: 25 August 2019
1. Introduction
There is a huge demand in the market as there is a rapid development in improving the existing system which ensures in giving security to the driver during the course of driving a vehicle. This leads to the development of a system that provides a helping hand thereby incorporating new techniques used for the purpose of detecting as well as recognizing the traffic signs. Nowadays, many automobile industries are extending in the market due to an increase in the demand for smart cars as a result of the rising competition among its fellow industries [1-5].
In the areas where there is a large amount of travelling, the regulation of the speed of the vehicles is done by the use of sign boards. They are used for limiting the current velocity of moving vehicles and are considered to be a part that comprises of some major categories of traffic signs [6-10].
A rise in the number of roadway accidents is observed because of ignoring the sign boards which try to limit the velocity of a moving vehicle for the persons who are driving a vehicle. Generally, it is observed that the persons who are not aware of the potential danger during the course of driving consequently meet a serious accident thereby even leading to their deaths [11-15]. There is an urgent need for development of a system which can be used to recognize the Speed Limit Signs (SLS) in an automatic fashion and may be used for alerting the driver [16-20]. There are two major steps which are involved in the processes of detecting and recognizing the Speed Limit Signs (SLS). The first step is to detect the potential candidates which are known as the Regions of Interest (ROI) usually comprising sign board images and the second step is to recognize the ROI in order to extract the correct category of sign board images [21-25].
During the course of driving a vehicle [26-35], the driver tends to ignore the speed limit sign boards that convey a message to restrict the velocity of a moving vehicle thereby suffering from a collision which may ultimately lead to the death of the driver consequently becoming a reason for increasing number of roadway accidents [36-45]. The development of a system that is capable of recognizing the Speed Limit Signs (SLS) in an automatic fashion as well as alerting the driver at the same time is the need of the hour [46-50].
It is generally observed that various automobile industries are increasing in the market because of the demand of smart cars. This is the result of the rising competition among its fellow industries thereby facilitating the growth of systems. It would provide a helping hand thereby incorporating some new techniques used for the purpose of detecting as well as recognizing the traffic signs. In recent years, since there is a large requirement in the market because of rapid growth in the improvement of the existing system, a secure driving environment is provided [1-5]. The maximum speed limit sign boards are generally employed to restrict the velocity of a moving vehicle and are used for regulating the velocity of a vehicle in the case of areas where there is a large amount of travelling thereby comprising of a major category of traffic signs [6-10]. During the course of driving a vehicle, the driver tends to ignore the speed limit sign boards that convey a message to restrict the velocity of a moving vehicle thereby suffering from a collision which may ultimately lead to the death of the driver consequently becoming a reason for increasing number of roadway accidents. The development of a system that is capable of recognizing the Speed Limit Signs (SLS) in an automatic fashion as well as alerting the driver at the same time is the need of the hour [11-15]. The process of detecting as well as recognizing the SLS normally comprises of two major steps namely, detecting the potential candidates known as the Regions of Interest (ROI’s) consisting of the sign board images and recognizing the ROI so that the category of sign board images can be extracted in a correct fashion [16-20]. The main objective of detecting a sign board image can be accomplished with the help of extracting the primary visual features like the color and the shape which are present inside a given input image [21-25] such as the color feature is employed for detecting the red SLS while the shape feature is employed for detecting circular or rectangular sign board images [26-30]. If we study the research work which is done in the past, we will come to know that the rectangular speed limit signs [31-35] are usually detected with the help of shape-based methods [36-40], for example, if we study the research work which is carried out by [41-45] we will find that the rate of detecting the sign board images was increased in the rough conditions, especially, during the night time [46-50].
The circular sign board images are detected by making use of the color-based and/or the shape-based methods, for example, if we consider the research work which is carried out by [1-5]. Next step which is involved in the process of recognizing the SLS comprises of two important techniques, namely, the processes of recognizing sign boards that are available in a broad range as well as recognizing each and every character on a given sign board. If we take an example of strategy that incorporates recognizing a given sign board which is made available in a wide range, one may find a complete candidate sign to be considered for recognizing process [6-10]. If we take the example of digit-based methods, the process of extracting multiple characters for recognizing numerical portrait of velocity which is exhibited by a moving vehicle rather than classifying a complete sign board image treating it as a single entity is performed [11-15]. The process of recognizing sign board images is treated as one of the important factors for driver assistance system because it plays an important part in controlling the road traffic thereby issuing a warning signal and giving proper guidance to the drivers [16-20]. It is observed that ignoring the sign boards because of distraction or being in a psychological state by the drivers is the main cause of roadway accidents which are occurring in last few years [21-25]. There is an urgent need for incorporating an automatic system for the purpose of recognizing the sign boards and is considered to be a main factor for building an autonomous navigation system [26-30]. In order to detect and recognize the sign boards [31-35] with a faster speed and higher efficiency, particularly, in a real time scenario, the proposed system [36-40] should have a higher precision so that the process identification of sign board images can be performed in a correct manner [41-45]. The detection and the recognition efficiencies can be affected if the system is busy in managing certain complicated issues [46-50].
The various problems that are associated with these systems include the variations in the illumination such as light levels, twilight, fog, rain and shadow, motion blur and sign occlusion [1-10]. The effectiveness can be considered to be one among the major factors because the complete navigation system is damaged by the improper classification and lack of detection of sign board images. But, later it was revealed that the systems that are currently present in the literature part are unable to provide 100% accuracy. The research scholars were motivated by the results which are given in the section above and there was an improvement in the performance of system that is capable of detecting as well as recognizing the sign board images even in the complicated situations and thus highlights the importance of our research work in building this method that is being presented in this review paper. A novel technique which is used for the process of detecting, tracking and classifying the sign boards at a faster speed from a moving vehicle even in the difficult conditions was proposed by [11-20]. In order to extract the candidate regions of the sign boards, a color-based segmentation technique was being proposed in the course of detecting the sign board images. The HOG features are applied in order to encode the sign board images which are detected and the feature vectors are also computed. The process of detecting and recognizing the sign board images in an automatic manner remains as one of the daunting task that comprises of a variety of areas of application, for example, if we consider reinforcements resulting from a rapid growth in the arena of providing a safe driving environment to a driver who is driving a vehicle, taking a survey of existing road conditions that are prevalent in our surroundings so that potential dangers can be judged and proper steps can be implemented in order to prevent them from happening [21-30].
1.1. Traffic signs interpretation
When we compare the research work which is done on automatically detecting and recognizing symbol-based traffic sign board images and recognizing the textual information which is present inside the sign board images, we will find that a small amount of research work is done on recognizing the textual information which is present within a sign board image in comparison with the former [31-40]. One of the main difficulties that are associated with this procedure such as presence of variation in lighting conditions as well as shadowing effect that is caused due to improper lighting conditions, the effect of causing a blur, causing an occluding effect due to improper and less amount of light as well as deteriorating of sign board images can be considered responsible for causing this scenario to a smaller extent [41-50]. During the course of driving, we cannot distinguish in between sign board images as well as images that belong to some another class other than sign boards merely on grounds that provides the information which is provided by their primary visual features like the color and the shape but some extra temporal or contextual information should also be provided supplementing this information, since the information that is given by color and the shape of traffic signs as well as non-traffic signs proves to be inadequate [1-10]. Based on this hypothesis, it is observed that there are large numbers of images that does not fall in the class of sign boards which are classified from images falling in a particular class of sign boards although detected successfully from the original images which is found most frequently within a sign board image that tends to appear in somewhat cluttering fashion, as we normally observe in the case of a road scene [11-20]. It is generally observed that when there is lack of some supplementary information such as the structural and temporal information, there are large numbers of false positives (FPs) that are detected by the system especially when we observe the top scene, thus facilitating the process of detecting the traffic signs which is present in both the images in a rather successful manner [21-30]. The possible solution to this problem was provided by the use of primary visual features like the color and shape of traffic sign board images that are employed in the process of detection of a large number of text-based traffic sign board images. One should also take proper care that no True Positives (TPs) are ignored thus reflecting the importance of the process of over segmentation [31-40]. In order to eliminate unlikely candidates, an enormous amount of candidate regions which are detected with the help of structure of the scene and the temporal information that is conveyed by them were diminished to a greater extent [41-50]. One of the main objectives of an intelligent transportation system is to provide a safe and secure driving environment thereby ensuring the safety of the surrounding traffic. We can devise a new technique ensuring the safety of the surrounding traffic by implementing an on-board camera-based driver alert system which helps in recognizing sign board images such as stop signs and speed limit signs [1-10]. Traffic Sign board images convey important information regarding the present condition about the roadway as well as tend to provide other information for the purpose of navigation. They can be thought of as planar rigid objects which are having different colors and shapes. The primary visual characteristics of an image constitute the color, shape and pictogram which help us to provide relevant information which is embedded in it. The area of Intelligent Transportation Systems is gaining popularity nowadays and many car manufacturing companies are focusing their eyes on the area of Advanced Driver Assistance Systems since it contains a broad spectrum available for carrying out research and development especially in the domain of Traffic Sign Recognition [11-20]. In the year 2008, Mobil eye entered into a joint venture ship with Continental AG and three additional new updates were installed in the BMW 7 series that comprised of lane departure warning, speed limit information based on the method of detecting sign board images and intelligent headlight control. One of the major challenging tasks which is confronted by modern car manufacturing companies is to recognize the sign boards correctly particularly in an uncontrolled environment [21-30].
There are three steps in a typical traffic sign board image recognition system that mainly consists of detecting a particular traffic sign from other signs by using some detection method followed immediately by the process of elimination of noise from it with the help of some pre-processing techniques and finally recognizing that traffic sign by using some pattern recognition and machine learning approaches. We can augment the existing system with the help of tracking algorithm so that the speed of recognition can be increased, so that we can focus on a tiny region of the object which is detected for the purpose of recognition. In this research paper, more emphasis is laid on the process of recognizing traffic sign board images; we can leave the remaining three methods, viz., detection, rectification and tracking. One can find the research work done on the problem of recognizing traffic signs dating from the last century, and the proof of this work is found in an ancient survey which was lastly updated in May 1999, given in [31-40]. Since, there are plenty of techniques available in the field of recognizing traffic sign boards over a past few decades, we do not try to give a comprehensive literature survey, and instead concentrate on several background work most relevant to the present research. Due to the growth of different intelligent methods pertaining to driver assistance systems (DAS), it is trying to prove its superiority over the currently existing approaches which are present in Intelligent Transportation Systems. In the DAS, the task of detecting and recognizing traffic signs can be considered as one of the major approaches for acquiring information regarding a safe driving environment and we can also take precautionary measures in order to overcome the potential hazards faced by driver particularly while driving a vehicle along the road. The process of recognizing the sign board images, that too in a real environment, proves to be a herculean task if we want the technique to be done with greater accuracy and within a stipulated time, since the visibility of sign boards can be affected due to some undesirable factors to a larger extent. So far, many algorithms have been proposed for traffic sign recognition [41-50]. In [1-10], an entirely different approach of the currently prevailing AdaBoost algorithm is utilized in order to detect a traffic sign by deployment of batteries of classifier algorithms that are given proper training to split the classes in an error correcting output code framework. A robust sign similarity measure which is built by using the SimBoost or a fuzzy regression tree framework, a technique which is used for recognizing traffic signs is proposed in [11-20]. We all are familiar with the Support Vector Machine (SVM) algorithm which happens to be a good classifier that is very popular in the domain of computer vision. In order to facilitate the process of detecting and recognizing road signs in an automatic fashion, an entirely different method is presented in [21-30] in which a SVM is used for traffic sign detection while a Gaussian kernel SVM is adopted for traffic sign recognition [31-40]. In order to classify an unknown traffic sign, an Eigen-based traffic sign recognition system was proposed in [41-50] taking the help of Principal Component Analysis (PCA algorithm) by selecting the most effective components of traffic sign board images. Boosted by the successful applications on handwritten digits recognition, convolutional neural network (CNN) has also been employed on traffic sign classification [1-10]. In [11-20], instead of various features, a CNN is trained directly with the raw pixel values of traffic sign images. Moreover, a better result is obtained by integrating the results obtained by a CNN and a multilayer perceptron (MLP). Gradient orientation is one kind of useful information in various object recognition methods, including the traffic signs. Traffic scene analysis is a very important topic in computer vision and intelligent systems [21-30]. The traffic signs are manufactured in such a fashion that they convey important information regarding the present condition and other information of the road. They are rigid and simple shapes with eye catching colors and the information they carry is easy to understand. However, accidents may still occur when drivers do not pay attention to a traffic sign in time [31-40]. So, in order to overcome these difficulties, there is an urgent need for implementing an automatic real time traffic sign recognition system which is capable of detecting and recognizing traffic sign board images. The above factors make the problem of detecting and recognizing traffic sign boards very complicated and still remains a daunting task for most of the research scholars [41-50].
1.2. Signs interpretation methods
There has been a lot of improvement in the field of detecting and recognizing the textual information which is present inside an image [1-10]. The different techniques which has led to an improvement in this area can be classified into two major types, one is the Region-Based Methods and another one is the Connected Component (CC) based methods [11-20]. The local features for example, texture are used by the region based methods for the purpose of locating the regions which contain the textual information in an image and the connected component-based methods are used for the purpose of segmentation of the characters that are present in the textual information within a particular traffic sign board image on an individual basis with the help of information like the intensity, color distribution and the edges of an image [21-30]. The Connected Component based methods normally comprises of three stages, the first stage is used for the purpose of detecting CCs which are present inside an image followed by a second stage in which the CCs that are not very similar are eliminated based on their features which is subsequently followed by a final stage in which grouping of the remaining CCs is performed into words or lines [31-40]. It was revealed that the amount of research work which targeted specifically on the task of detecting the textual information which is present inside a particular traffic sign board image is restricted to a narrow spectrum because of the difficulty in performing the given task. The methods that are currently available in the literature consist of two steps, the first step is the process of detecting a given sign board image and the second step is the process of recognizing a particular image [41-50]. The research work which is carried by founding the candidate regions by combining the characteristics that are obtained by combination of Shi characteristics as well as Tomasi characteristics, the prototypes that are obtained through the mixing of characteristics that are derived from Gaussian functions as well as that which are obtained by the process of analyzing a given image on the basis of its geometrical properties. It was postulated on the basis of the textual information which is present inside a given sign board image that is visible if we take some plane surface that is oriented in the upward direction thereby giving due regards towards the movement as well as the axis of the camera that exhibits the photonic characteristics and properties. If we consider the real world, it may be possible that the sign boards which contain the textual information within it may tend to appear if one looks it from its own perspective to be somewhat in synchronism with the original image of the sign board [1-10]. So, there is an urgent need for incorporating a perspective transform which gives the OCR a better possibility of performing the task of recognizing the textual information that is contained inside a sign board image. The process of matching of the candidate regions with the help of consecutive frames was done and the process of interpretation was then performed with the help of an OCR system when their size was considered to be adequate. The detection rate was found to be 88.9% and the false detection rate was found to be 9.2%, which was based on database containing 22 video sequences with video sequence having a length of 30 seconds duration. The work which was done by [11-20] comprised of segmentation of the areas that are present inside an image and the extraction of these regions seem to attract the research scholar for the purpose of carrying out his own research which is propounded on the grounds of the information that is conveyed by the primary visual characteristics of an image thereby taking help of some limiting criterion that is applied to channels that contain the chromaticity as well as the luminosity components if we consider the most popular technique which is deployed for the purpose of segmentation of sign board images [21-30]. If we compare the tracing of outer boundaries that are present inside every single blob with the help of Fourier transformation by adopting an approach that increases the speed of computation of the process thereby reducing the duration that is required for every single computation with those obtained by adopting the same method from an arbitrary uniform plane lamina which can be considered as an example for the purpose of implementing our technique was being employed in order to find the rectangular regions [31-40]. The quadruple corners which can be thought of as an area that resembles a rectangle were being searched by deploying the process by taking peaks of the area that is traced from an entire image with the help of transformation of complete image using Fourier method thereby increasing the speed for carrying out the process of computation thus reducing the duration required for every single computation and by taking help of aforementioned corners, thereby carrying out the task of rotation of corresponding areas that are chosen for the purpose of extraction from complete image trying for the process of alignment of the textual information consisting of mainly the characters that is present inside a given sign board image particularly in upward direction. If we consider the point of view of a vehicle, it is revealed that the above method is not sufficient if we try to consider the process of recovering above area that is present on the chassis of the vehicle if the point of view of the observer is taken for the process of consideration which consists of textual information inside a sign board image and the perspective correction which is given in [41-50] tries to provide a more robust solution to this problem. There was a lack of output that represents the content which is illustrated in a more sophisticated fashion thereby giving the amount of content which is extracted from a given sign board image which is contributed through the research work that is illustrated in the existing literature. If we consider some existing techniques that are given by [1-10], we will come to know that they exhibit some peculiar characteristics that mainly focuses on taking help from MSERs that mainly exerts a thrust on detecting both the images that represent the significant information related to existing road conditions as well as if we consider some characters that are present in the textual information which is contained within a given sign board image. If we try to combine the processes of segregating the original image as well as the characters that are present in an image if we try to see the image particularly in sunlight thereby constituting a container, we come to know of the interesting fact that the areas which are present on the chassis of a vehicle having a whitish as well as bluish appearance are subjected to the process of detecting each of the components that are present inside a given video sequence [11-20]. By taking help from both the mechanical systems that tend to classify the basis functions thereby supporting the conventional technique which can be deployed for the process of classifying a given image as well as the classification method that is presented by some research scholars, these regions were then again subjected to the process of classification. More emphasis was placed on the geo-localization of sign board images with the help of information which is supplied by a Global Positioning System, and the technique was then applied to single images, without the use of temporal information [21-30]. If we try to make an approximation about size of our complete world, we will come to know that height of textual content which is present inside an image was used along with the spacing in between our camera and images that carry some message about the prevalent road conditions. The rates that are required for the processes of detecting, recognizing as well as classifying the words, numerical characters as well as symbolic information that is represented by the alphabets present on a particular sign board image that are taken from shorter, longer as well as medium distances in between the observer and the sign board images were being given by the existing authors. If we consider the ranges for the process of detecting and recognizing the traffic sign board images, it was found that the range for detecting the sign boards was lying in between 13.09% and 90.18%, while the range for the process of recognizing the sign boards was found lying in between 8.51% and 87.50%. Our proposed method overcomes the numerous limitations which are faced by the method that were proposed by [31-40] in which postulates were propounded for the method of detecting traffic sign board images that comprised of textual information within it and are sufficient for providing a high recall rate. The additional FPs was eliminated by making use of structural and temporal information that is conveyed by a particular image by our technique which is being propounded in the above section. One can find the output of system which we derived in the course of performing experiments that get highlighted from our research work are sufficient enough for giving a proof to the proposed method which is described in the section above. The research work which was done by [41-50] used a rough OCR technique in detecting and recognizing the textual information contained in the sign boards was superceded by our proposed method that uses the concept of recovering original information contained in sign board images comprising point of view from an observer as well as techniques that involve the usage of merging two portions of any kind of objects that is present along lateral portions of an object. One may find manuscripts from earlier and past research works which reflect our propounded system performing with better outcomes alone is sufficient enough for giving a proof to our proposed method which is given the section above. If we consider the research work which was done [1-10] takes the help of temporal information used for detecting symbol-based traffic sign board images which is further contributed by the research work that is described in this review paper by embedding the structural information that is present in the scene. We can find a huge amount of research work that focuses on the problem of detecting the textual information which is present in sign board images by taking help from a mobile sensor and mainly depends on the devices that can be worn by the driver, for example, the techniques that are mentioned in [11-20] and the methods which are mainly applicable to mobile robotics can be found in the research work that is presented by [21-30]. We can find a number of databases which are used for the purpose of validation of systems used for detecting and recognizing the sign board images which includes the famous dataset which is included in the research work that is done by [31-40] as well as the database that is included in the research work which is done by [41-50]. The above databases find no use in order to validate our proposed method which is entirely based upon detecting and recognizing the sign boards containing textual information within them and are more concentrated upon the process of detecting the symbol-based sign boards. A camera with knowledge of all the parameters used in the process of calibration was used for extracting the data [1-10]. One may consider the process of recognizing a particular sign board image amongst all other members, a Herculean task when it comes to recognizing sign board image from a group of other sign boards. It is found that a variety of techniques are available in the arena of classifying known sign board images ranging from ordinary methods like the matching of templates to sophisticated machine learning techniques. One of the very significant and most important algorithms which are employed to perform the task of classifying multiple sign board images can be attributed to well-known Support Vector Machine (SVM) algorithm. If the transcripts authored by [11-20] are considered, one can find the significance attached to automatically detecting and recognizing sign board images taking help of Support Vector Machines (SVMs) in combination with Gaussian kernels. However, the system was required to classify candidate blobs into a shape class before recognition. As a sequence, only the pixels that were part of the sign were used to construct the feature vector. In [21-30] different methods other than those which are currently available in the context of detecting and recognizing sign boards in an automatic fashion were brought to the notice of people. It can be very well understood from this study that a comparatively greater emphasis was laid in enhancing the accuracy of existing methodologies prevalent in detecting and recognizing sign boards in an automatic fashion thereby resulting in the reduction of number of support vectors which are required in due course of the complete process leading to a sudden fall in the necessity of memory and time for testing new samples [31-40]. An SVM segmentation approach for traffic sign recognition was given in [41-50] while in [1-10], an effective strategy helping in the process of recognizing slanted speed limit signs by extracting the rotation invariant features with the help of Fourier based wavelet descriptor was introduced. The different categories of sign board images were classified with the help of Support Vector Machines (SVMs) consisting of binary tree architecture. In [11-20], a shape-based classification was developed using an SVM. In order to represent the features, two types of features including a binary image and Zernike moments were used. The main objective behind carrying out this research work was recognizing seven categories of traffic sign shapes as well as five categories of speed limit signs. In addition to SVMs, AdaBoost is also a popular classification approach. A color insensitive Haar wavelets feature combined with the AdaBoost algorithm was introduced in to develop a country-independent recognition module [21-30]. By using the concept of a class similarity measure that is learnt from image pairs, realization was achieved with the help of a new newer version of the existing AdaBoost algorithm which is known as SimBoost algorithm [31-40]. The solution to the problem of classification between multiple classes can be obtained if we compare the similarities between an unknown example and prototype from each class, subjected to the condition that an estimate of the similarities between any two images is made available. The stop and give way signs in different and complex surroundings were successfully classified by taking help from an array of weak classifiers in a reliable fashion. [41-50] took the help of classifiers which are trained to refine the type of traffic sign like neural networks and AdaBoost classifiers was also being taken. With the help of AdaBoost feature selection procedure, suitable features were chosen from a very large pool of features consisting of Haar, moment, symmetry, frequency and other features. The results which were obtained from the various classifier algorithms were combined over time and merging of the signs that are quite similar on both the sides of the roadway was accomplished taking help of fusion module that incorporated combining a Bayesian network and a decision tree [1-10]. An Error Correcting Output Codes (ECOC) which takes help from a forest of optimal tree structures that are embedded in the ECOC matrix were also being formulated along with the existing methods. An entirely different approach that is suitable for classifying sign boards belonging to different classes by using the ECOC technique was introduced [11-20]. The ensemble of binary classifiers that were given training on categories of sign board images, having two partitions was taken and the ECOC was being implemented with the help of above scheme [21-30]. The decomposition of the original problem into a set of complementary problem having two classes that are encoded in ECOC matrix which tend to share the classifiers across the original classes was performed. In [31-40], a comparison was performed considering the class specific sets of discriminative local regions in between a discrete color image of the viewed sign with other images. By using the principal of one versus all dissimilarity maximization, they were learnt in offline mode from the standard templates of sign board images [41-50]. The comparison in between the robust discrete color image was initiated by using a color distance transform which served as a basis for defining this dissimilarity. It becomes a challenging task when it comes to the method of comparison of the actual performance since there is no such kind of ideal database or procedure for performance evaluation of several machine learning approaches that try to find a solution to the problem of recognizing traffic signs, even though they are present in the literature part [1-10]. There has been a rapid growth in research and development sector especially in the area of detecting and recognizing traffic sign board images over the last few decades. Several novel ideas and effective methods have been proposed [11-20]. Usually, the detection part hunts [21-30] potential regions of traffic signs whereas the category to which a traffic sign belongs is determined by the recognition part [31-40]. The traditional methods which are used for the purpose of detecting sign boards can be grouped into three main classes, viz., color-based methods, shape-based methods and the sliding window-based methods [41-50].
1.3. Definitions of various Performance Metrics used for Image Quality Evaluation
The various performance metrics such as the Mean Squared Error (MSE), Peak Signal to Noise Ratio (PSNR) as well as the Structural Similarity for measuring the Image Quality (SSIM) which are used for evaluating the quality of a given traffic sign board image are defined as follows:
1.3.1. Mean Squared Error (MSE)
The Mean Squared Error (MSE) or the Mean Squared Deviation (MSD) of an estimator or of a procedure for estimating an unobserved quantity is defined as the average of the squares of the errors that is the average squared difference in between the estimated values and what is estimated. The mathematical equation which governs the Mean Squared Error (MSE) is given as below:
![]() where n is the total number of predictions generated from a sample of n data points on all the variables, Y is the vector of observed values of the variable being predicted.
where n is the total number of predictions generated from a sample of n data points on all the variables, Y is the vector of observed values of the variable being predicted.
where M × N represents the size of an image.
1.3.2. Peak Signal to Noise Ratio (PSNR):
The Peak Signal to Noise Ratio (PSNR) is defined as the ratio in between the maximum possible power of a given signal and the power of corrupting noise that affects the fidelity of its representation. The mathematical equation which governs the Peak Signal to Noise Ratio (PSNR) is given as below:
![]() where MAXI is the maximum possible pixel value of the image and MSE is the Mean Squared Error, I is the m × n noise free monochrome image and its noisy approximation is denoted by K.
where MAXI is the maximum possible pixel value of the image and MSE is the Mean Squared Error, I is the m × n noise free monochrome image and its noisy approximation is denoted by K.
1.3.3. Structural Similarity for measuring the Image Quality (SSIM)
The Structural Similarity for measuring the Image Quality (SSIM) is defined as the technique which is used for measuring the similarity in between two images and it is also employed to predict the perceived quality of digital television and cinematic pictures as well as other kinds of digital images and videos. The mathematical equation which governs the Structural Similarity for measuring Image Quality (SSIM) is given as below:
![]() where
where
μx is the average of x
μy is the average of y
σx2 is the variance of x
σy2 is the variance of y
σxy is the covariance of x and y
c1 and c2 are the two variables to stabilize the division with weak denominator.
2. Software Tool used
The MATLAB R2019a software is utilized in the synthesis of various roadway symbols from input test dataset during the course of performing experimental procedure.
3. Experimental Results and Discussion
A set of various roadway symbol images belonging to numerous categories is taken into consideration which comprising a total number of 679 roadway symbols constituting training dataset belonging to 18 different classes of roadway symbols and there are a total number of 48 roadway symbols incorporating testing dataset.
The training dataset comprises of symbols containing some printed details embedded on their outer surface and symbols that do not have any kind of printed details embedded on their outer surface. This manuscript depicts the numerous roadway symbols incorporated in dataset used for implementing this research project.
Some examples of traffic sign board images comprising of various colors and shapes which are present in the training image database as well as testing image database are depicted in the section of this manuscript (Figure 1 and Figure 2) shown as below:
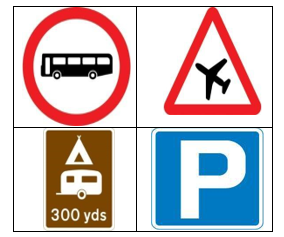 Figure 1 Examples of various roadway symbols from the Training image database
A short summary of numerous methods incorporated during the course of investigation is given in section 3.1.
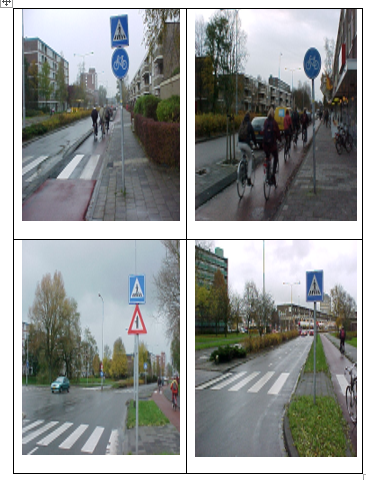 Figure 2 Examples of various roadway symbols from the Testing image database
3.1. Anisotropic Diffusion Filtering Type 1
The technique of Anisotropic Diffusion Filtering which is also popular by another name Perona Malik Diffusion is primarily used to reduce the unwanted disturbance present in roadway symbols. The technique of Anisotropic Diffusion Filtering Type 1 can be represented with the help of a mathematical equation which is given as follows:
![]() where the constant K controls the sensitivity to edges and is usually chosen experimentally or as a function of the noise in the image, denotes the Laplacian operator and it also denotes the gradient and c (x, y, t) is the diffusion coefficient and it controls the rate of diffusion and is usually chosen as a function of the image gradient so as to preserve the edges in the image, I (:, t) : Ω → R be a family of gray scale images.
where the constant K controls the sensitivity to edges and is usually chosen experimentally or as a function of the noise in the image, denotes the Laplacian operator and it also denotes the gradient and c (x, y, t) is the diffusion coefficient and it controls the rate of diffusion and is usually chosen as a function of the image gradient so as to preserve the edges in the image, I (:, t) : Ω → R be a family of gray scale images.
The results which are obtained after carrying out the process of Anisotropic Diffusion Filtering Type 1 of the roadway symbols comprising input testing image database (Figure 3) are depicted as below:
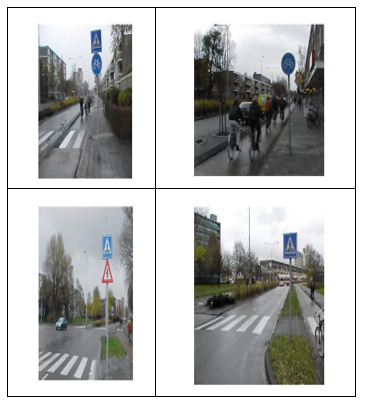 Figure 3 Testing image database Anisotropic Diffusion Filtering Type 1 Results
The results which are obtained after carrying out the process of Anisotropic Diffusion Filtering Type 1 of the roadway symbols comprising input training image database (Figure 4) are depicted as below:
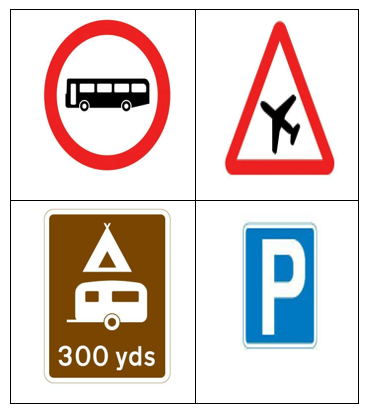 Figure 4 Training image database Anisotropic Diffusion Filtering Type 1 Results
3.2. Non-Local Means Type 2
In this technique of Non-Local Means Filtering, a given color image is converted into the L*a*b color space thereby facilitating the Non-Local Means Filter to smooth the colors which are having similarity in visual perception. For the purpose of computing the numerical value of standard deviation and the Euclidean distance from the origin (edist), a homogenous L*a*b patch from the image is being extracted so that the standard deviation of edist is calculated in order to estimate the amount of noise contained in it. The mathematical equation which governs the process of Non-Local Means Type 2 is given as follows:
![]() where u (p) is the filtered value of the image at the point p, v (q) is the unfiltered value of the image at the point q, f (p, q) is the weighting function and the integral is evaluated over Ɐq Ɛ Ω and the normalizing factor C (p) is given by the formula which is given as follows:
where u (p) is the filtered value of the image at the point p, v (q) is the unfiltered value of the image at the point q, f (p, q) is the weighting function and the integral is evaluated over Ɐq Ɛ Ω and the normalizing factor C (p) is given by the formula which is given as follows:
![]() The results which are obtained after carrying out the process of Non-Local Means Type 2 of the roadway symbols comprising input testing image database (Figure 5) are depicted as below:
The results which are obtained after carrying out the process of Non-Local Means Type 2 of the roadway symbols comprising input testing image database (Figure 5) are depicted as below:
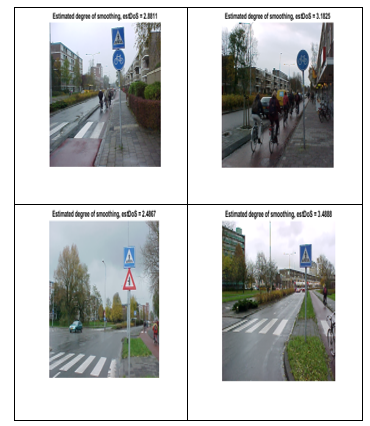 Figure 5 Testing image database Non-Local Means Type 2 Results
The results which are obtained after carrying out the process of Non-Local Means Type 2 of the roadway symbols comprising input training image database (Figure 6) are depicted as below:
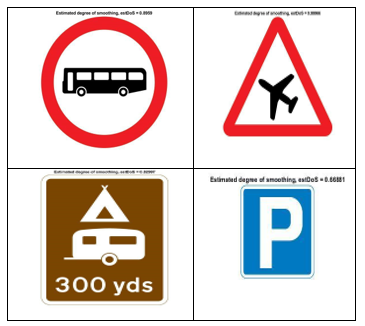 Figure 6 Training image database Non-Local Means Type 2 Results
3.3. Image Denoising using Deep Neural Network (DNN)
In this technique of denoising a given gray scale image by using a Deep Neural Network (DNN), the pretrained denoising convolutional neural network named as ‘DnCNN’ is being retrieved and the amount of noise which is present in the noisy version of the original gray scale image is subjected to the process of removal.
The results which are obtained after carrying out the process of Image Denoising using Deep Neural Network (DNN) of the roadway symbols comprising input testing image database (Figure 7) are depicted as below:
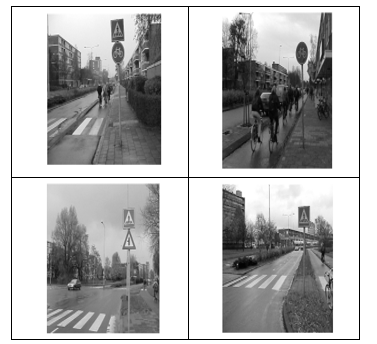 Figure 7 Testing image database Image Denoising using Deep Neural Network (DNN)
The results which are obtained after carrying out the process of Image Denoising using Deep Neural Network (DNN) of the roadway symbols comprising input training image database (Figure 8) are depicted as below:
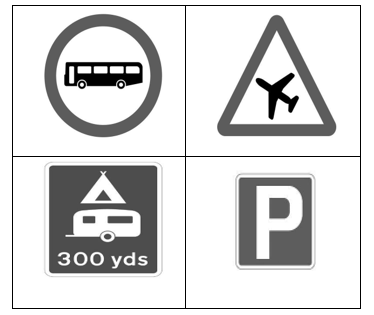 Figure 8 Training image database Image Denoising using Deep Neural Network (DNN) Results
The comparative analysis of various image denoising techniques based on various image quality metrics like Mean Squared Error (MSE), Peak Signal to Noise Ratio (PSNR) and the Structural Similarity for measuring the image quality (SSIM) from the past 2-3 years comprising input testing image database is given in the tabulated fashion which is shown (Table 1) as below:
Table 1: Comparative Analysis of Image Denoising Techniques based on various Image Quality Metrics like Mean Squared Error (MSE), Peak Signal to Noise Ratio (PSNR) and Structural Similarity for measuring the Image Quality (SSIM) for Testing image database from the past 2-3 years
| S. No. | Year | Techniques used | Mean Squared Error (MSE) Values | Peak Signal to Noise Ratio (PSNR) Values | Structural Similarity for measuring image Quality (SSIM) Values |
| 1. | 2018 | Anisotropic Diffusion Filtering Type 1 | 40.282 | 32.121 | 0.892 |
| 2. | 2018 | Non-Local Means Type 2 | 0.676 | 51.479 | 0.995 |
| 3. | 2017 | Image Denoising using Deep Neural Network (DNN) | 1.640 | 47.1174 | 0.997 |
The comparative analysis of various image denoising techniques based on various image quality metrics like Mean Squared Error (MSE), Peak Signal to Noise Ratio (PSNR) and the Structural Similarity for measuring the image quality (SSIM) from the past 2-3 years comprising input training image database is given in the tabulated fashion which is shown (Table 2) as below:
Table 2: Comparative Analysis of various combinations of Image Denoising Techniques based on various Image Quality Metrics like Mean Squared Error (MSE), Peak Signal to Noise Ratio (PSNR) and Structural Similarity for measuring the Image Quality (SSIM) for Training image database from the past 2-3 years
| S. No. | Year | Techniques used | Mean Squared Error (MSE) Values | Peak Signal to Noise Ratio (PSNR) Values | Structural Similarity for measuring image Quality (SSIM) Values |
| 1. | 2018 | Anisotropic Diffusion Filtering Type 1 | 110.887 | 27.897 | 0.877 |
| 2. | 2018 | Non-Local Means Type 2 | 0.080 | 61.175 | 0.999 |
| 3. | 2017 | Image Denoising using Deep Neural Network (DNN) | 0.970 | 51.267 | 0.998 |
3.4. Arithmetic Mean Filter
The Arithmetic Mean can be defined as being equal to the sum of the numerical values of each and every observation divided by the total number of observations. The arithmetic means of a given set of numbers each one is having a numerical value a1, a2, a3, …………, an can be calculated by using the formula which is given as below:
![]() where a1, a2, a3,……………., an are n number of physical quantities, n is the total number of physical quantities and A.M. is the Arithmetic Mean of the n number of physical quantities which are taken into consideration.
where a1, a2, a3,……………., an are n number of physical quantities, n is the total number of physical quantities and A.M. is the Arithmetic Mean of the n number of physical quantities which are taken into consideration.
The results which are obtained after carrying out experiments with the help of an Arithmetic Mean Filter (Figure 9) are presented as below:
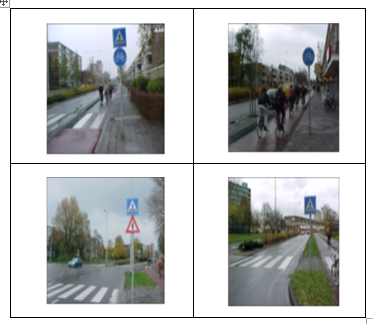 Figure 9 Testing image database Arithmetic Mean Filtering Results
3.5. Circular Averaging Filter (Pillbox)
The technique of removing salt and pepper noise from an image can be accomplished with the help of smoothing filter which also helps in removing the sharp edges thereby refining the small contours as well as ridges from it. It is useful in removing minute information before the operation of extracting an object having greater size from the image resulting in the amalgamation of tiny regions in between the two portions that are present in lines or curves, thereby telling its significance about the reason for including in the pre-processing step. The results that are obtained after applying Averaging Filter to the roadway symbols that are present in our image dataset are presented in the below section of this manuscript (Figure 10) as follows:
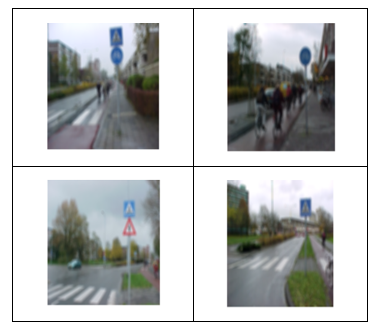 Figure 10 Testing image database Circular Averaging Filter (Pillbox) Results
3.6. Harmonic Mean Filter
A Harmonic Mean Filter can be defined as the reciprocal of the arithmetic mean of the reciprocals of a given set of observations. The Harmonic Mean can be calculated by using the mathematical expression which is given as below:
![]() The results which are obtained after carrying out experiments with the help of a Harmonic Mean Filter (Figure 11) are presented as below:
The results which are obtained after carrying out experiments with the help of a Harmonic Mean Filter (Figure 11) are presented as below:
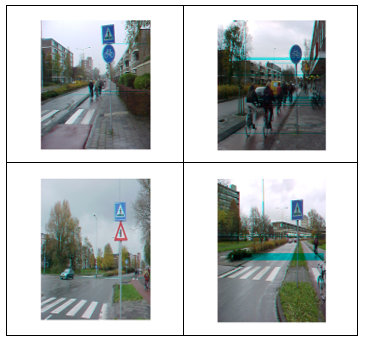 Figure 11 Testing image database Harmonic Filter Results
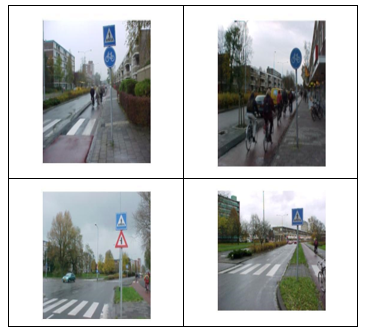 Figure 12 Testing image database Box Filter Results
3.7. Box Filter
The Box Blur or sometimes called as Box Linear filter can be defined as a spatial domain linear filter in which each pixel in the resulting image possess a value which is equal to the average value of its neighboring pixels present in the original input image. It is a type of low pass or a blurring filter.
The results obtained after carrying out experiments with the help of a Box Filter are presented in Figure 12.
3.8. Gaussian Filter
The Gaussian function is defined as follows:
![]() where a, b and c are the arbitrary constants, x is the distance from the origin in the horizontal axis, y is the distance from the origin in the vertical axis and σ is the standard deviation of the Gaussian distribution. The Gaussian function is derived from the name of a well-known scientist named Carl Friedrich Gauss. The results which are obtained after carrying out experiments with the help of a Gaussian Filter (Figure 13) are presented as below:
where a, b and c are the arbitrary constants, x is the distance from the origin in the horizontal axis, y is the distance from the origin in the vertical axis and σ is the standard deviation of the Gaussian distribution. The Gaussian function is derived from the name of a well-known scientist named Carl Friedrich Gauss. The results which are obtained after carrying out experiments with the help of a Gaussian Filter (Figure 13) are presented as below:
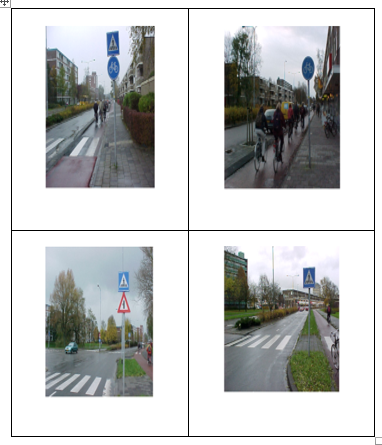 Figure 13 Testing image database Gaussian Filter Results
The comparative analysis of various image denoising techniques based on various image quality metrics like Mean Squared Error (MSE), Peak Signal to Noise Ratio (PSNR) and the Structural Similarity for measuring the Image Quality (SSIM) comprising the input testing image database is given in a tabulated fashion which is shown (Table 3) as below:
Table 3 Comparative Analysis of various Image Denoising Techniques based on various Image Quality Metrics like Mean Squared Error (MSE), Peak Signal to Noise Ratio (PSNR) and Structural Similarity for measuring the Image Quality (SSIM) for Testing image database from the research paper presented in IEEE ESTCON-ICIAS-2018 International Conference held at UTP, Malaysia from 13th-15th August 2018
| S. No. | Year | Techniques used | Mean Squared Error (MSE) Values | Peak Signal to Noise Ratio (PSNR) Values | Structural Similarity for measuring image Quality (SSIM) Values |
| 1. | 2006 | Gaussian Filter | 22.820 | 35.054 | 0.985 |
| 2. | 2006 | Box Filter | 529.370 | 21.329 | 0.634 |
| 3. | – | Arithmetic Mean Filter | 381.839 | 22.656 | 0.729 |
| 4. | 2006 | Circular Averaging Filter (Pillbox) | 459.299 | 21.961 | 0.666 |
| 5. | – | Harmonic Mean Filter | 321.160 | 24.146 | 0.862 |
4. Novelty of the Proposed Research Work
The main objective of our proposed research work is to identify the best technique which helps in removing the noise which is naturally present in an image among various noise removal techniques based on different image quality metrics like Mean Squared Error (MSE), Peak Signal to Noise Ratio (PSNR) and the Structural Similarity for measuring Image Quality (SSIM).
The best technique is identified from its counterparts by assuming that it is having the least numerical value of Mean Squared Error (MSE) as well as it is also having the greatest numerical value of Peak Signal to Noise Ratio (PSNR) and Structural Similarity for measuring Image Quality (SSIM).
The Non-Local Means Type 2 and the Image Denoising using Deep Neural Network (DNN) techniques were combined and applied to the input traffic sign board images which are present in the testing image database and the results so obtained are shown in (Figure 14) as below:
After the process of calculating the numerical values of Mean Squared Error (MSE), Peak Signal to Noise Ratio (PSNR) and the Structural Similarity for measuring the Image Quality (SSIM) was completed, it was observed that the Mean Squared Error (MSE) value was found out to be 113.83027446809 and the Peak Signal to Noise Ratio (PSNR) and the Structural Similarity for measuring the Image Quality (SSIM) values were found out to be 31.578017021277 and 0.90815744680851 respectively.
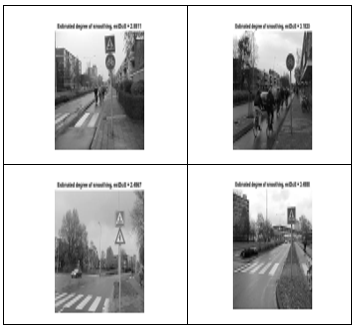 Figure 14 Testing image database Results obtained by combining the Non-Local Means Type 2 + Image Denoising using Deep Neural Network (DNN) Techniques
The technique of Anisotropic Diffusion Filtering Type 1 was combined with Non-Local Means Type 2 technique and applied to the input traffic sign board images which are present in the testing image database and the results so obtained are shown in (Figure 15) as below:
After the process of calculating the numerical values of Mean Squared Error (MSE), Peak Signal to Noise Ratio (PSNR) and the Structural Similarity for measuring the Image Quality (SSIM) was completed, it was observed that the Mean Squared Error (MSE) value was found out to be 1.5655462333826 and the Peak Signal to Noise Ratio (PSNR) and the Structural Similarity for measuring the Image Quality (SSIM) values were found out to be 47.416585376662 and 0.99865745937961 respectively.
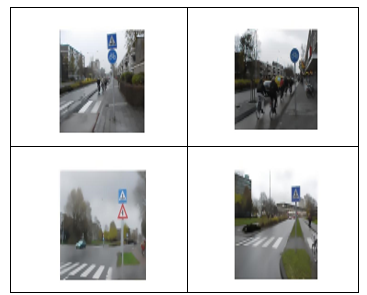 Figure 15 Testing image database Results obtained by combining the Anisotropic Diffusion Filtering Type 1 + Non-Local Means Type 2 Techniques
The techniques of Non-Local Means Type 2 and Anisotropic Diffusion Filtering Type 1 were combined and applied to the input traffic sign board images which are present in the training image database and the results were obtained after the execution of this experimental procedure which are shown in the figure that is given (Figure 16) as below and the numerical values of the Mean Squared Error (MSE), Peak Signal to Noise Ratio (PSNR) and the Structural Similarity for measuring the Image Quality (SSIM) were found out to be 255.94895760709, 24.440101624815 and 0.95028419497784 respectively.
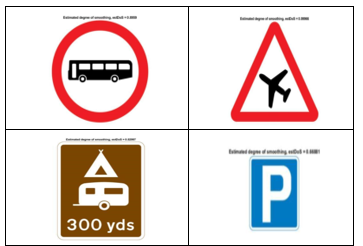 Figure 16 Training image database Results obtained by combining the Non-Local Means Type 2 + Anisotropic Diffusion Filtering Type 1 Techniques
The Non-Local Means Type 2, Anisotropic Diffusion Filtering Type 1 and Non-Local Means Type 2 techniques were combined and applied to the input traffic sign board images which are present in the training image database and the results which are obtained after the execution of the experimental procedure are shown in the figure which is given (Figure 17) as below and the numerical values of the Mean Squared Error (MSE), Peak Signal to Noise Ratio (PSNR) and Structural Similarity for measuring the Image Quality (SSIM) were found out to be 76.349860118168, 31.671063072378 and 0.97056218611521 respectively.
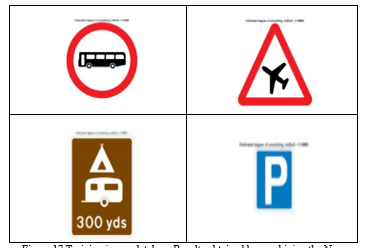 Figure 17 Training image database Results obtained by combining the Non-Local Means Type 2 + Anisotropic Diffusion Filtering Type 1 + Non-Local Means Type 2 Techniques
The techniques of Non-Local Means Type 2, Anisotropic Diffusion Filtering Type 1, Non-Local Means Type 2 and Image Denoising using Deep Neural Network (DNN) were combined and applied to the input traffic sign board images which are present in the training image database and the results which are obtained after carrying out the experimental procedure are shown in the figure which is given (Figure 18) as below and the numerical values of the Mean Squared Error (MSE), Peak Signal to Noise Ratio (PSNR) and Structural Similarity for measuring the Image Quality (SSIM) were found out to be 0.022547858197932, 66.103574150665 and 0.99989054652881 respectively.
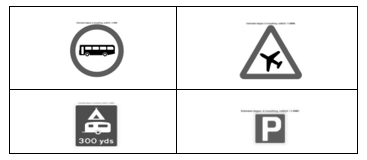 Figure 18 Training image database Results obtained by combining the Non-Local Means Type 2 + Anisotropic Diffusion Filtering Type 1 + Non-Local Means Type 2 + Image Denoising using Deep Neural Network (DNN) Techniques
The comparison of these image quality parameter numerical values for different combinations of Anisotropic Diffusion Filtering Type 1, Non-Local Means Type 2 and the Image Denoising using Deep Neural Network (DNN) techniques which are employed for removal of noise present in the testing image database is given in the tabulated fashion shown (Table 4) as below:
The comparison of these image quality parameter numerical values for different combinations of Anisotropic Diffusion Filtering Type 1, Non-Local Means Type 2 and the Image Denoising using Deep Neural Network (DNN) techniques which are employed for removal of noise present in the training image database is given in the tabulated fashion shown in Table 5:
Table 4 Comparative Analysis of various combinations of Image Denoising Techniques based on various Image Quality Metrics like Mean Squared Error (MSE), Peak Signal to Noise Ratio (PSNR) and Structural Similarity for measuring the Image Quality (SSIM) for Testing image database
| S. No. | Year | Techniques used | Mean Squared Error (MSE) Values | Peak Signal to Noise Ratio (PSNR) Values | Structural Similarity for measuring Image Quality (SSIM) Values |
| 1. | 2018 | Anisotropic Diffusion Filtering Type 1 | 40.282 | 32.121 | 0.892 |
| 2. | 2018 | Non-Local Means Type 2 | 0.676 | 51.479 | 0.995 |
| 3. | 2017 | Image Denoising using Deep Neural Network (DNN) | 1.640 | 47.117 | 0.997 |
| 4. | 2018 + 2018 | Anisotropic Diffusion Filtering Type 1 + Non-Local Means Type 2 | 113.830 | 31.578 | 0.908 |
| 5. | 2018 + 2018 + 2017 | Anisotropic Diffusion Filtering Type 1 + Non-Local Means Type 2 + Image Denoising using Deep Neural Network (DNN) | 0.137 | 61.466 | 0.999 |
Table 5 Comparative Analysis of various combinations of Image Denoising Techniques based on various Image Quality Metrics like Mean Squared Error (MSE), Peak Signal to Noise Ratio (PSNR) and Structural Similarity for measuring the Image Quality (SSIM) for Training image database
| S. No. | Year | Techniques used | Mean Squared Error (MSE) Values | Peak Signal to Noise Ratio (PSNR) Values | Structural Similarity for measuring Image Quality (SSIM) Values |
| 1. | 2018 | Anisotropic Diffusion Filtering Type 1 | 110.887 | 27.897 | 0.877 |
| 2. | 2018 | Non-Local Means Type 2 | 0.080 | 61.175 | 0.999 |
| 3. | 2017 | Image Denoising using Deep Neural Network (DNN) | 0.970 | 51.267 | 0.998 |
| 4. | 2018 + 2017 | Non-Local Means Type 2 + Image Denoising using Deep Neural Network (DNN) | 1.565 | 47.416 | 0.998 |
| 5. | 2018 + 2018 | Non-Local Means Type 2 + Anisotropic Diffusion Filtering Type 1 | 255.948 | 24.440 | 0.950 |
| 6. | 2018 + 2018 + 2018 | Non-Local Means Type 2 + Anisotropic Diffusion Filtering Type 1 + Non-Local Means Type 2 | 76.349 | 31.671 | 0.970 |
| 7. | 2018 + 2018 + 2018 + 2017 | Non-Local Means Type 2 + Anisotropic Diffusion Filtering Type 1 + Non-Local Means Type 2 + Image Denoising using Deep Neural Network (DNN) | 0.022 | 66.103 | 0.999 |
If the testing image database is considered, it is observed that if the techniques of Anisotropic Diffusion Filtering Type 1, Non-Local Means Type 2 and Image Denoising using Deep Neural Network (DNN) are combined, the numerical values of different image quality metrics like the Mean Squared Error (MSE), Peak Signal to Noise Ratio (PSNR) and the Structural Similarity for measuring the Image Quality (SSIM) were found out to be 0.13772127659574, 61.466536170213 and 0.99981489361702 respectively. Therefore, it is clear that the above technique which is mentioned in this research paper proves to be the best technique which can be used for the purpose of noise removal from input traffic sign board images present in the testing image database since the numerical values of Mean Squared Error (MSE) is the least as compared with its other counterparts and the numerical values of the Peak Signal to Noise Ratio (PSNR) as well as the Structural Similarity for measuring the Image Quality (SSIM) are the greatest as compared with its other counterparts.
If the training image database is considered, it is observed that if the techniques of Non-Local Means Type 2, Anisotropic Diffusion Filtering Type 1, Non-Local Means Type 2 and Image Denoising using Deep Neural Network (DNN) are combined, the numerical values of different image quality metrics like the Mean Squared Error (MSE), Peak Signal to Noise Ratio (PSNR) and the Structural Similarity for measuring the Image Quality (SSIM) were found out to be 0.022547858197932, 66.103574150665 and 0.99989054652881 respectively. Therefore, it is clear that the above technique which is mentioned in this research paper proves to be the best technique which can be used for the purpose of noise removal from input traffic sign board images present in the training image database since the numerical values of different image quality metrics like the Mean Squared Error (MSE) is the least as compared with its other counterparts and the numerical values of the Peak Signal to Noise Ratio (PSNR) as well as the Structural Similarity for measuring the Image Quality (SSIM) are the greatest as compared with its other counterparts.
Conclusion and Future Scope
In this paper, a comparison of various image denoising techniques was done in order to choose the best technique among a set of three different techniques and their three different combinations which was being applied to the traffic sign board images present in the testing image database and four different techniques and their seven different combinations to the traffic sign board images present in the training image database based on calculating different parameters which decide the quality of input roadway symbols like Mean Squared Error (MSE), Peak Signal to Noise Ratio (PSNR) as well as Structural Similarity for measuring Image Quality (SSIM) and after a thorough comparison, it was concluded that the combination of Anisotropic Diffusion Filtering Type 1, Non-Local Means Type 2 and Image Denoising using Deep Neural Network (DNN) techniques which was being applied to the traffic sign board images present in the testing image database and the combination of Non-Local Means Type 2, Anisotropic Diffusion Filtering Type 1, Non-Local Means Type 2 and Image Denoising using Deep Neural Network (DNN) techniques which was being applied to the images which are present in the training image database has the maximum Peak Signal to Noise Ratio (PSNR) as well as Structural Similarity for measuring Image Quality (SSIM) values and a minimum Mean Squared Error (MSE) value as compared to other techniques. These techniques will be applied to the traffic sign board images which are present in both the testing as well as training image databases in future research work for the purpose of noise removal from input traffic sign board images.
Conflict of Interest
The authors mention and acknowledge the funding sources which were provided during the course of performing the research work and there are no significant conflicts of interest.
Acknowledgments
A sincere vote of thanksgiving must be extended to Vellore Institute of Technology, Vellore administration and every one among the stakeholders whose contribution towards the completion of this work in a successful fashion paved the way for implementing it on a broad level.
- Yu-Mei Huang, Hui-Yin Yan, You-Wei Wen, Xue Yang, “Rank minimization with applications to image noise removal”, Elsevier-Information Sciences, Volume 429, March 2018, pp. 147-163.
- Anissa Selmani, Hassene Seddik, “Anisotropic smart shape-adapted image smoothing without conductance function efficient for impulse noise removal”, Elsevier- Digital Signal Processing, Volume 75, April 2018, pp. 83-95.
- Tingting Yang, Xiang Long, Arun Kumar Sangaiah, Zhigao Zheng, Chao Tong, “Deep detection network for real-life traffic sign in vehicular networks”, Elsevier- Computer Networks, Volume 136, March 2018, pp. 95-104.
- Yong Chen, Ting-Zhu Huang, Liang-Jian Deng, Xi-Le Zhao, Min Wang, “Group sparsity-based regularization model for remote sensing image stripe noise removal”, Elsevier- Neurocomputing, Volume 267, 6 December 2017, pp. 95-106.
- Jing Dong, Zifa Han, Yuxin Zhao, Wenwu Wang, Ales Prochazka, Jonathon Chambers, “Sparse analysis model based multiplicative noise removal with enhanced regularization”, Elsevier- Signal Processing, Volume 137, August 2017, pp. 160-176.
- Lianghai Jin, Zhiliang Zhu, Xiangyang Xu, Xiang Li, “Two-stage quaternion switching vector filter for color impulse noise removal”, Elsevier- Signal Processing, Volume 128, November 2016, pp. 171-185.
- De-Yong Lu, “A hybrid optimization method for multiplicative noise and blur removal”, Elsevier- Journal of Computational and Applied Mathematics, Volume 302, 15 August 2016, pp. 224-233.
- Xianquan Zhang, Feng Ding, Zhenjun Tang, Chunqiang Yu, “Salt and pepper noise removal with image inpainting”, Elsevier- AEU – International Journal of Electronics and Communications, Volume 69, Issue 1, January 2015, pp. 307-313.
- Jielin Jiang, Jian Yang, Yan Cui, Lei Luo, “Mixed noise removal by weighted low rank model”, Elsevier- Neurocomputing, Volume 151, Part 2, 5 March 2015, pp. 817-826.
- Tudor Barbu, “Robust Anisotropic Diffusion Scheme for Image Noise Removal”, Elsevier- Procedia Computer Science, Volume 35, September 2014, pp. 522-530.
- Xia Chen, Chen Tang, Xiusheng Yan, “Switching degenerate diffusion PDE filter based on impulse like probability for universal impulse noise removal”, Elsevier- AEU – International Journal of Electronics and Communications, Volume 68, Issue 9, September 2014, pp. 851-857.
- Xiubao Sui, Qian Chen, Guohua Gu, “Adaptive grayscale adjustment-based stripe noise removal method of single image”, Elsevier- Infrared Physics & Technology, Volume 60, September 2013, pp. 121-128.
- Floris Gisolf, Anwar Malgoezar, Teun Baar, Zeno Geradts, “Improving source camera identification using a simplified total variation-based noise removal algorithm”, Elsevier- Digital Investigation, Volume 10, Issue 3, October 2013, pp. 207-214.
- Jourabloo, A. H. Feghahati, M. Jamzad, “New algorithms for recovering highly corrupted images with impulse noise”, Elsevier- Scientia Iranica, Volume 19, Issue 6, December 2012, pp. 1738-1745.
- Lianghai Jin, Caiquan Xiong, Hong Liu, “Improved bilateral filter for suppressing mixed noise in color images”, Elsevier- Digital Signal Processing, Volume 22, Issue 6, December 2012, pp. 903-912.
- Wei Ding, “A New Method for Image Noise Removal using Chaos-PSO and Nonlinear ICA”, Elsevier- Procedia Engineering, Volume 24, December 2011, pp. 111-115.
- Tom Mélange, Mike Nachtegael, Stefan Schulte, Etienne E. Kerre, “A fuzzy filter for the removal of random impulse noise in image sequences”, Elsevier- Image and Vision Computing, Volume 29, Issue 6, May 2011, pp. 407-419.
- Ovidiu Ghita, Paul F. Whelan, “A new GVF-based image enhancement formulation for use in the presence of mixed noise”, Elsevier- Pattern Recognition, Volume 43, Issue 8, August 2010, pp. 2646-2658.
- Kannan, B. Rajesh Kanna, C. Aravindan, “Root Mean Square filter for noisy images based on hyper graph model”, Elsevier- Image and Vision Computing, Volume 28, Issue 9, September 2010, pp. 1329-1338.
- Huaping Liu, Yulong Liu, Fuchun Sun, “Traffic sign recognition using group sparse coding”, Elsevier- Information Sciences, Volume 266, January 2014, pp. 75-89.
- Zhan-Li Sun, Han Wang, Wai-Shing Lau, Gerald Seet, Danwei Wang, “Application of BW-ELM model on traffic sign recognition”, Elsevier- Neurocomputing, Volume 128, October 2014, pp. 153-159.
- Fatin Zaklouta, Bogdan Stanciulescu, “Real-time traffic sign recognition in three stages”, Elsevier- Robotics and Autonomous Systems, Volume 62, August 2012, pp. 16-24.
- Shuihua Wang, Hangrong Pan, Chenyang Zhang, Yingli Tian, “RGB-D image-based detection of stairs, pedestrian crosswalks and traffic Signs”, Elsevier- Journal of Visual Communication and Image Retrieval, Volume 25, November 2014, pp. 263-272.
- Jonathan J. Kay, Peter T. Savolainen, Timothy J. Gates, Tapan K. Datta, “Driver behavior during bicycle passing maneuvers in response to aShare the Road sign treatment”, Elsevier-Accident Analysis and Prevention, Volume 70, April 2014, pp. 92-99.
- Jesmin Khan, Sharif Bhuiyan, Reza Adhami, “Hierarchical clustering of EMD based interest points for road sign detection”, Elsevier- Optics & Laser Technology, Volume 57, October 2014, pp. 271-283.
- Zong-Yao Chen, Wei-Chao Lin, Shih-Wen Ke, Chih-Fong Tsai, “Evolutionary feature and instance selection for traffic sign recognition”, Elsevier- Computers in Industry, Volume 74, September 2015, pp. 201-211.
- Samuele Salti, Alioscia Petrelli, Federico Tombari, Nicola Fioraio, Luigi Di Stefano, “Traffic sign detection via interest region extraction”, Elsevier- Pattern Recognition, Volume 48, June 2014, pp. 1039-1049.
- M. Lillo-Castellano, I. Mora-Jiménez, C. Figuera-Pozuelo, J.L.Rojo-Álvarez, “Traffic sign segmentation and classification using statistical learning methods”, Elsevier- Neurocomputing, Volume 153, November 2015, pp. 286-299.
- Haojie Li, Fuming Sun, Lijuan Liu, Ling Wang, “A novel traffic sign detection method via color segmentation and robust shape matching”, Elsevier- Neurocomputing, Volume 169, May 2015, pp. 77-88.
- Zhenyu An, Zhenwei Shi, Ying Wu, Changshui Zhang, “A novel unsupervised approach to discovering regions of interest in traffic images”, Elsevier- Pattern Recognition, Volume 48, February 2015, pp. 2581-2591.
- Yingying Zhu, Chengquan Zhang, Duoyou Zhou, Xinggang Wang, Xiang Bai, Wenyu Liu, “Traffic sign detection and recognition using fully convolutional Network guided proposals”, Elsevier- Neurocomputing, Volume 214, July 2016, pp. 758-766.
- Ayou Ellahyani, Mohamed El Ansari, Ilyas El Jaafari, “Traffic sign detection and recognition based on random forests”, Elsevier- Applied Soft Computing, Volume 46, February 2016, pp. 805-815.
- Selcan Kaplan Berkaya, Huseyin Gunduz, Ozgur Ozsen, Cuneyt Akinlar, Serkan Gunal, “On circular traffic sign detection and recognition”, Elsevier- Expert Systems with Applications, Volume 48, 2016, pp. 67-75.
- Yongtao Yu, Jonathan Li, Chenglu Wen, Haiyan Guan, Huan Luo, Cheng Wang, “Bag-of-visual-phrases and hierarchical deep models for traffic sign detection and recognition in mobile laser scanning data”, Elsevier- ISPRS Journal of Photogrammetry and Remote Sensing, Volume 113, January 2016, pp. 106-123.
- Hamed Habibi Aghdam, Elnaz Jahani Heravi, Domenec Puig, “A practical approach for detection and classification of traffic signs using Convolutional Neural Networks”, Elsevier- Robotics and Autonomous Systems, Volume 84, July 2016, pp. 97-112.
- Mario Soilan, Belen Riveiro, Joaquin Martinez-Sanchez, Pedro Arias, “Traffic sign detection in MLS acquired point clouds for geometric and image-based semantic inventory”, Elsevier- ISPRS Journal of Photogrammetry and Remote Sensing, Volume 114, February 2016, pp. 92-101.
- Ouerhani, A. Alfalou, M. Desthieux, C. Brosseau, “Advanced driver assistance system: Road sign identification using VIAPIX system and a correlation technique”, Elsevier- Optics and Lasers in Engineering, Volume 89, May 2016, pp. 184-194.
- Jack Greenhalgh and Majid Mirmehdi, “Recognizing Text-Based Traffic Signs”, IEEE Transactions on Intelligent Transportation Systems, Vol. 16, No. 3, June 2015, pp. 1360-1369.
- Nadra Ben Romdhane, Hazar Mliki, Mohamed Hammami, “An Improved Traffic Signs Recognition and Tracking Method for Driver Assistance System”, in the Proceedings of IEEE International Conference on Information Security (ICIS’2016), June 26-29, 2016, Okayama, Japan.
- Ruben Laguna, Ruben Barrientos, L. Felipe Blazquez, Luis J. Miguel, “Traffic sign recognition application based on image processing techniques”, in the Proceedings of the Elsevier- Proceedings of the 19th World Congress, The International Federation of Automatic Control, Cape Town, South Africa. August 24-29, 2014, pp. 104-109.
- Tingting Yang, Xiang Long, Arun Kumar Sangaiah, Zhigao Zheng, Chao Tong, “Deep detection network for real-life traffic sign in vehicular networks”, Elsevier- Computer Networks, Volume 136, May 2018, pp. 95-104.
- M. Bascon, J.A. Rodriguez, S.L. Arroyo, A.F. Caballero, F. Lopez-Ferreras, “An optimization on pictogram identification for the road-sign recognition task using SVMs”, Computer Vision Image Understanding, Volume 114, Issue 3, 2010, pp. 373-383.
- C. Chang, Y.P. Hsieh, “A fast VQ codebook search with initialization and search order”, Information Sciences, Volume 183, Issue 1, 2012, pp. 132-139.
- Ciresan, U. Meier, J. Mascim, J. Schmidhuber, “A committee of neural networks for traffic signs classification”, in Proceedings of International Joint Conference on Neural Networks (IJCNN), July 2011, pp. 1918-1921.
- Escalera, O. Pujol, P. Radeva, “Traffic sign recognition system with b-correction”, Elsevier- Machine Vision Applications, Volume 21, Issue 2, 2010, pp. 99-111.
- Gomez-Moreno, S. Maldonado-Bascon, P. Gil-Jimenez, S. Lafuente-Arroyo, “Goal evaluation of segmentation algorithms for traffic sign recognition”, IEEE Transactions on Intelligent Transportation Systems, Volume 11, Issue 4, 2010, pp. 917-930.
- Gu, T. Yendo, M.P. Tehrani, T. Fujii, M. Tanimoto, “Traffic sign detection in dual-focal active camera system”, in the Proceedings of IEEE Intelligent Vehicles Symposium (IV), 2011, pp. 1054-1059.
- Haojie Li, Fuming Sun, Lijuan Liu, Ling Wang, “A novel traffic sign detection method via color segmentation and robust shape matching”, Elsevier- Neurocomputing, Volume 169, December 2015, pp. 77-88.
- Huang, K. Huang, Y. Yu, T. Tan, “Salient coding for image classification”, in the Proceedings of Computer Vision and Pattern Recognition (CVPR), 2011, pp. 1753-1760.
- Alexander Shustanov, Pavel Yakimov, “CNN Design for Real-Time Traffic Sign Recognition”, Elsevier- September 2017, pp. 718-725.