A Fuzzy-Based Approach and Adaptive Genetic Algorithm in Multi-Criteria Recommender Systems
Volume 4, Issue 4, Page No 449-457, 2019
Author’s Name: Mohamed Hamada1,a), Abdulsalam Latifat Ometere1, Odu Nkiruka Bridget1, Mohammed Hassan2, Saratu Yusuf Ilu2
View Affiliations
1African University of Science and Technology, Department of Computer Science & Engineering, 90001, Nigeria
2Bayero University of Nigeria, Department of Software Engineering, 700231, Nigeria.
a)Author to whom correspondence should be addressed. E-mail: mhamada2000@gmail.com
Adv. Sci. Technol. Eng. Syst. J. 4(4), 449-457 (2019); ![]() DOI: 10.25046/aj040454
DOI: 10.25046/aj040454
Keywords: Recommender System, Multi-criteria Recommendation, Adaptive Genetic Algorithm, Fuzzy Logic
Export Citations
Recommender Systems (RSs) are termed as web-based applications that make use of filtering methods and several machine learning algorithms to suggest relevant user objects. It can be said that some techniques are usually adopted or trained to develop these systems that generate lists of suitable recommendations. Conventionally, RS uses a single rating approach to preference user recommendation over an item. Recently, multi-criteria technique has been identified as a new approach of recommending user items based on several attributes or features of user items. This new technique of item recommendation has been adopted to solve several recommendation problems compared to the single rating approach. Furthermore, the predictive performance of the multi-criteria technique when tested proves to be further efficient as compared to the traditional single ratings approach. This paper gives a comparative study between two models that are based on the features and architecture of fuzzy sets system and adaptive genetic algorithm. Genetic Algorithms (GAs) are robust and stochastic search techniques centered on natural selection and evaluation that are often applied when encountering optimization problems. Fuzzy logic (FL) on the other hand, is known for its wide application in diverse fields in science. This study aims to evaluate, analyze, and compare the predictive performance of both methods and present their results. The study has been accomplished using Yahoo! Movies dataset, and the results of the performance of each model have been presented in this paper. The results proved that both techniques have significantly enhanced the system’s accuracy.
Received: 25 April 2019, Accepted: 29 July 2019, Published Online: 16 August 2019
1. Introduction
The advancement of Internet of things together with the rapid growth of e-commerce websites has caused uneasiness for customers to choose appropriately from the overwhelming number of items offered by these websites [1]. This fast development of web-based tools and the steady accessibility of a variety of information on the web have also given rise to the problem of information overload. As such, this has led online customers to make poor choices while purchasing items online [2]. To overcome this persistent problem, there is a need to introduce an intelligent decision support system that has the potential to scan through the available items using some computational and machine learning techniques to find and recommend appropriate items to users. Hence the need for RSs. Currently, RS is a significant tool that solves problems of information overload. It solves this problem by suggesting only items that are suitable to users. Increasing the number of items sold in e-commerce sites and an increase in customers’ satisfaction from buying items online is one of the key benefits of RSs [3].
RS is a web-based application that supplies users with recommendations of items that might be of interest to them. The recommendations of items to users may be personalized or non-personalized [4]. The personalized recommendations are typically presented as orderly lists of items offered to the system user. It takes into consideration users’ previous history for rating and predicting items. On the other hand, non-personalized recommendation systems recommend what is popular and relevant to all the users, which can be a list of top-5 items for every new user. Consequently, RS studies the user behaviour first, which could be expressed explicitly by the user through the rating of items or implicitly by just clicking on items. After learning the user’s behaviour, it suggests items that might be useful to the user based on what it has learned from the user. It further suggests an ordered list of items in a way the user will like or rate them [3]. Rating of items by the user is one of the main forms of data transaction that is collected by the RS and uses it to classify RS into traditional RS and multi-criteria RS.
Traditionally, the commonly used recommendation approach adopted is either a hybrid-based, content-based or collaborative filtering approach. These approaches, together with subdivisions of collaborative filtering approach are shown in Fig. 1 [4]. These methods obtained an overall rating of a specific user on an item. Ratings of the users over items are used by recommendation algorithms to evaluate and predict users’ preferences on new items. Single criterion rating tends to be inadequate in most cases because they have been proven to offer recommendations that are not quite efficient in achieving user desires, since users are unable to define their opinions based on various attributes of the item.
Multi-criteria Recommender Systems makes use of several items attributes to define the appropriateness of user items [5]. As an example, in a Movie RS, part of the attributes sighted may be the direction, action, visual, story. Multi-criteria RSs improves the Single criterion RS by putting into consideration varied items attributes in which users may like. Unlike Single Criterion RSs, users are capable of providing individual preference ratings on various item attributes. In most cases, additional relevant information offered by multi-criteria recommender systems helps to enhance recommendation value accurately. This enhancement depicts different features that a user may like about the item. In most RSs research, accuracy has been the most extensively examined point of emphasis [3]. However, more research is mandated on the effectiveness of new methods to integrate the multi-criteria rating information into the recommendation process efficiently. Therefore, this work aims to analyze and investigate how to use genetic algorithms and fuzzy technique to improve the precision in a multi-criteria RS. The study also provides a comparative analysis of the efficiencies of the two techniques.
The current paper is separated into five distinct sections, together with section 1. Section 2 presents a summary of traditional and multi-criteria RSs. Section 3 presents the methodology and frameworks used to implement both systems. Section 4 presents the results and comparison of both methods. Finally, section 5 presents the conclusion and discusses future work
2. Concept of Collaborative Filtering (CF)
CF is among the very commonly used approaches in generating valuable recommendations due to its human nature centred approach. It mainly “use the wisdom of the crowd or what seems to be common amongst my cycle” to recommend items to me. This is centred on the connection between users of the system and the item itself. It performs well in complex object recommendations (for example movies and music), which are seen to be totally autonomous from any machine-readable prediction of the items recommended.
Various companies have used RSs by implementing numerous algorithms that cut across different area. An example of such implementation is the statistical interactive learning techniques implemented by CleverSet, and also, the classical CF implemented in Net Perceptions [6] and Amazon [7].
CF approaches are mostly categorised into Memory-based and Model-based filtering method. The latter method makes use of earlier activities of the user to acquire a predictive model. This is done either by making use of some statistical analysis or machine learning techniques in making relevant recommendations [1]. Memory-based filtering approach makes use of recommendations grounded on similarities that exist in comparing previous activities or users’ stored data. According to literature, there exist two ways commonly used to achieve memory-based techniques (item-based or user-based techniques) [8]. Fig. 1 shows a summary of the recommendation techniques. Model-based techniques can be developed using algorithms, some of such algorithms include Bayesian classifiers [9], Support vector machine, Neural networks [10], Boltzmann machine, Fuzzy patterns [11], Latent features, Genetic algorithms [12] and Matrix factorizations [13].
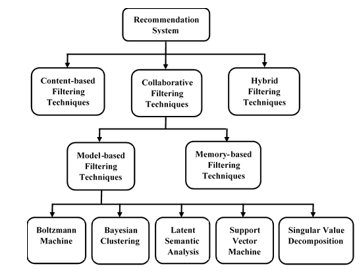 Figure. 1 Overview of existing recommendation methods
2.1. Asymmetric Singular Value Decomposition (ASVD)
ASVD is an extension of SVD. It relates to three vectors ( ), also, users are signified by the objects they desire. User predictions to an item are represented in Eq. (1).
 by minimalizing the normalized squared error, we obtained Eq. (2).
 where Rui represent user ratings u to item i, represent the overall mean rating, bu and bi represent detected deviation of user u and observed deviation of item i correspondingly, R(u) represent a set of the total items rated by the user u which are known ratings, N(u) represent the set of all items which are rated by u, this can either be a known or an unknown rating and j represent an item.
The regularized squared error was minimised using stochastic gradient descent, and the boundaries λ and γ are assigned positive real values of 0.002 and 0.005 respectively [14].
2.2. Multi-Criteria Recommender System (MCRS)
Majority of the RSs in use today are based on a single criterion rating which contains the overall user’s satisfaction of an item [3]. Single criterion rating hides the users’ choices and misleads the system when predicting items to the users [15]. It works in two-dimensional space of users and its utility function as expressed in Eq. (3)
![]() The utility function is gotten from the user inputs, e.g., transaction history or numeric ratings.
The utility function is gotten from the user inputs, e.g., transaction history or numeric ratings.
Single-criterion rating systems have shown successful recommendations in many areas. However, research in RS has identified the benefits of multi-criteria RS to enhance the prediction accuracy [16]. Multi-criteria RS does this by providing detailed information about the user ratings than a single-criterion RS and this enhances the recommendation process [5]. To determine the utility function of a user for a given item, we consider the overall rating and the user’s ratings for each criterion c (c = 1, 2, …, k). Thus, the utility function R for multi-criteria RS is given as in Eq. (4)
 2.3 Genetic Algorithm
Genetic Algorithms (GAs) are a robust and stochastic search technique centered on natural selection and evaluation that is frequently applied when encountering optimization problems. GA applications are frequently used when dealing with combinatorial optimization problems [17]. GA applies the same knowledge as any other evolutionary algorithm. It makes use of data collected from a set of individuals, represented as G(i), where G represents the set (population), and i represents the number of the set (individuals). Each of the individuals is evaluated by assigning an appropriate fitness value, which is dependent on how respective individual is close to finding a solution to the problem. As its iteration continues, it finally approaches a local minima/maximum of the function.
A possible solution for a GA problem in GA is often called chromosome or individuals. Chromosomes are referred to as a set of genes; where each gene is represented by a distinct bit of nearby bit that encodes a part of the possible solution. Chromosomes are often scrambled as a sequence of bit string characterized abstractly in a genetic form. Locus is referred to as a location that has the encoding of some traits, while an Allele is a representation of each possible value of a locus (0 or 1) [18].
The genotype is referred to as a set of genes that exist in a genome, while the Phenotype is referred to as the physical representation of the genotype. After each encoding of the chromosome, the next step is to apply several reproduction procedures to the genotype. The genetic operators, such as the crossover, selection and mutation works on the genotype plot in other to return the value of the best chromosome.
Lastly, the stochastic nature of GA makes it challenging when trying to guarantee a solution that is optimal, and the algorithm may never stop running, which prompts for a termination condition. The algorithm is said to terminate only when the stopping criterion is met. The flowchart of a GA is shown in Fig. 2.
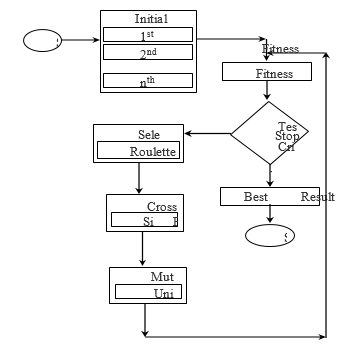 Figure 2 Flow chart of a standard genetic algorithm
2.3.1 Adaptive GA
Adaptive genetic algorithms are a subset of genetic algorithms. They provide substantial functionality improvements over the traditional GA implementations [19]. The configuration of genetic algorithms operators such as the probability of mutation and probability of crossover is a significant deterministic factor which affects the performance of a GA. The main function of GA is that, they help to modify the operators automatically, this is done by fine-tuning the operators centred on the algorithm’s state [20]. These fine-tuning operations offered by GAs helps in maintaining convergence capacity and population diversity. The modification is centred on the values of the fitness solution which are, the best fitness value of the recent population and the best fitness value of the average population.
2.4 Fuzzy logic: An overview
Fuzzy Logic (FL) is a concept that is gotten from the fuzzy set theory which was developed by Lotfi Zadeh in 1975 [22]. It is a technique that can be used to mathematically express human reasoning or language by using a range of real numbers between 0 and 1. A membership function (MF) expressed as and defined as is used to express the degree of membership of elements in a fuzzy set A.
2.4.1 Fuzzy logic architecture
Fuzzification
This step involves converting crispy set of inputs to a fuzzy set.
Linguistic variables
These are variables whose values are represented using ordinary language
Membership Function (MF)
It is used to represent graphically the amount of satisfaction a user got from an item.
Fuzzy Rule
It controls the output variable by applying some set of rules
Defuzzification
It is used to get a crispy value.
3. Methodology
This section presents the methods and frameworks used in the implementation of both systems.
3.1. Experimental dataset
Both systems were evaluated using Yahoo! Movie dataset collected from their website [5]. The dataset is a multi-criteria dataset that consists of user preferences ratings on movies based on four various movie features as follows: direction (c1), action (c2), story (c3), and visual (c4) effect of the movie. Each criterion ratings were considered on a 13-fold scale ranging from F through A+ where F denotes the lowest preference, while A+ denotes the highest preference. An overall rating (c0) denotes the total satisfaction derived by the user. The sample of the dataset is shown in Table 1.
Table 1: User Rating Obtained from Yahoo! Movies Rs
| User ID | Movie ID | |||||
|
12 |
10 | 10 | 10 | 8 | 9 | 100 |
| 5 | 8 | 3 | 2 | 5 | 25 | |
| 1 | 5 | 8 | 2 | 4 | 48 | |
|
13 |
7 | 7 | 5 | 9 | 5 | 320 |
| 10 | 13 | 4 | 13 | 10 | 360 | |
| 7 | 8 | 10 | 10 | 9 | 224 |
For simplicity to model both systems, these categorical data were transformed to the numerical dataset as shown in Table 2.
The datasets were pre-processed to remove inconsistency that arose due to missing ratings. In the end, we achieved a total of 6078 users, 978 movies and 62,156 ratings with 0.0105 total sparsity estimate. The global median, global average, and standard deviation are 11.0000, 9.5221, and 3.5232, respectively. The summary of the records is shown in Table 3.
Table 2: User Rating Obtained from Yahoo Movies Rs (After Conversion)
| Values | Frequency-rating | Percentage (%) | Cumulative-Percentage(%) |
| 1 | 3395 | 5 | 5 |
| 2 | 1340 | 2 | 8 |
| 3 | 1522 | 2 | 10 |
| 4 | 1329 | 2 | 12 |
| 5 | 2051 | 3 | 16 |
| 6 | 2428 | 4 | 19 |
| 7 | 2489 | 4 | 23 |
| 8 | 3251 | 5 | 29 |
| 9 | 5586 | 9 | 38 |
| 10 | 7006 | 11 | 49 |
| 11 | 6702 | 11 | 60 |
| 12 | 12153 | 20 | 79 |
| 13 | 12904 | 21 | 100 |
Table 3: Rating Frequency of The In Yahoo! Movie Datasets After Preprocessing.
| User ID | direction | action |
story |
visual |
Overall rating | Movie ID |
| 12 | B+ | B+ | B+ | B | B+ | 100 |
| D– | B | D– | D | C | 25 | |
| F | C | B | D | D+ | 48 | |
|
13 |
C+ | C+ | C | B– | C | 320 |
| B+ | A+ | D+ | A+ | B+ | 360 | |
| C+ | B | B+ | B+ | B– | 224 |
3.2. Adaptive GA MCRS Methodology
The Adaptive GA method for rating approximation was divided into different stages:
- Prediction of N multi-criteria Rating: This was done by decomposing the k-dimensional multi-criteria ratings into k single rating problem. To predict the unknown multi-criteria rating, an ASVD was For the next stage, the individual ratings were combined to provide an overall prediction of the ratings.
- Acquiring the Function: This stage was aimed at approximating the connection between the original multi-criteria ratings and overall ratings of the items, such that R0=f (R1,…, R k). An Adaptive GA was used to obtain the optimal weight of the individual benchmark for respective users over several criteria. Feature weight is the priority a user gives to a feature, which may differ for each feature. In our method, Adaptive GA was applied to modify the weight to take user priorities for several features. User feature weight is denoted as a set, weight (ua) = [wi] (where i = 1, …, z, and z = number of features). Any feature with the weight zero is ignored for further calculation. Any double-valued vector strings are used to represent the genotype. The proposed adaptive GA parameters are reviewed below:
- Initial Population: The original set of the population was created randomly with a size of 40 which consist of valid feature weights.
- Fitness Function: Fitness function is one of the most significant parts of GA. This function determines the success level of the individual chromosome after the population set is initialized. For a user who is active, a separate chromosome c is allocated a fitness function. The examined fitness function computes the accuracy of the predicted items using generated random weights. Eq. (5) represents the proposed fitness function.
![]() where represent the aggregate number of times an individual chromosome c was tested, represent the real ratings and represent the total ratings of on an item,
where represent the aggregate number of times an individual chromosome c was tested, represent the real ratings and represent the total ratings of on an item,
- Reproduction: his step was solely dependent on the value of individual chromosome’s fitness function. The fitness function defined for individual chromosome in the set of the population was computed and the chromosomes with the highest fitness rate were chosen as best chromosomes. The best chromosomes are reserved for the following generation.
- Selection: Roulette wheel selection technique was used, where parents are chosen according to their fitness value. Using the roulette wheel technique, each chromosome is allocated a slice of the wheel and the size of the slice is proportional to each chromosome’s fitness. The wheel is then rotated and any chromosome the wheel lands each time was chosen.
- Crossover: A single point crossover was selected to be implemented for the crossover. The selected crossover point was done randomly along the mated string length, then the next crossover point bits were swapped. The crossover probability was dependent on the fitness function, due to the fact that it’s an adaptive GA.
- Mutation: Diversity was introduced by adopting uniform mutation. The value of the chosen gene was replaced with a uniform random value, selected between the specified upper and lower bounds for the gene by the mutation operator. The mutation probability was dependent on the fitness function, due to the fact that it’s an adaptive GA.
- Termination Condition: Stopping criteria were centred on a well-defined number of initiations (100), and also on the convergence of best fit chromosomes.
- Predicting Total rating: The calculation of the unknown total rating for test data was accomplished using the weighted sum of each predicted ratings. This was generated as depicted in Eq. (6).
 Where represent the predicted rating of to of the particular multi-criteria ratings. Developing Eq. (6) yields Eq. (7)
![]() The aim of multi-criteria recommender systems is to generate a recommendation list for active users. The RS calculates the unknown total ratings by using feature weight function. Lastly, all unrated items and objects were sorted in non-increasing order with respect to the total ratings. Fig. 3 summarizes the working process of the Adaptive MCRS.
The aim of multi-criteria recommender systems is to generate a recommendation list for active users. The RS calculates the unknown total ratings by using feature weight function. Lastly, all unrated items and objects were sorted in non-increasing order with respect to the total ratings. Fig. 3 summarizes the working process of the Adaptive MCRS.
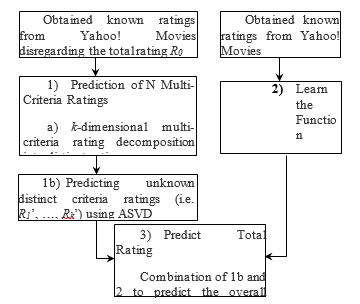 Figure 3 Structure of Adaptive Multi-Criteria Recommender System
3.3. Fuzzy-based MCRS Methodology
- Predict N Multi-criteria rating
This step involves the decomposition of the n-dimensional multi-criteria rating space where ( into single-rating recommendation problems as . The proposed model learns and predicts the user ratings for new items, however, we did not consider the overall rating at this stage.
This stage involves the computation of the relationship relating to the overall rating and multi-criteria Also, The aggregation function is considered as shown in the work of [21]. We integrated the FL technique to find the degree of satisfaction derived by a user from an item. Firstly, the user’s ratings were represented using linguistic terms including (high, medium, low, etc.) and triangular membership function as shown in TABLE 4. We considered a triangular membership function whose membership function is well-defined by the real numbers expressed as (a, b, c) as shown in Eq. (8).
We defined the membership function using 13 linguistic terms to represent interests of users and degrees to which each criterion was chosen. To compute the weight that determines the actual degree of membership of each criterion rating, this is calculated by dividing each user rating by n as shown in Eq. (9) below:
![]() Where represent user rating for each item and represent the total number of fuzzy linguistic value.
Where represent user rating for each item and represent the total number of fuzzy linguistic value.
We then derived the relationship to learn how the user rates an item. Eq. (10) shows the aggregation function.
![]() Where is the users’ criteria ratings and i is the weight associated with each criteria rating
Where is the users’ criteria ratings and i is the weight associated with each criteria rating
The relationship for each user criteria rating for j items was computed, the function that resulted in the highest degree of membership for user , for ratings is chosen as the most preferred criterion for the user as shown in Eq. (11).
| User rating | TFN | Linguistic terms |
| 1.0 | (0,1,2) | V-V-V-V-low |
| 2.0 | (1,2,3) | V-V-V-low |
| 3.0 | (2,3,4) | V-V-low |
| 4.0 | (3,4,5) | V-low |
| 5.0 | (4,5,6) | Low |
| 6.0 | (5, 6,7) | Medium-low |
| 7.0 | (6,7,8) | Medium |
| 8.0 | (7,8,9) | Medium-high |
| 9.0 | (8,9,10) | High |
| 10.0 | (9,10,11) | V-high |
| 11.0 | (10,11,12) | V-V-high |
| 12.0 | (11,12,13) | V-V-V-high |
| 13.0 | (12,13,14) | V-V-V-V-high |
- Predict Overall rating
At this stage, the model predicts the overall rating for an active user . This is achieved through the integration of the trained fuzzy MCRS and the
single rating technique (Asymmetric SVD) so as to present the top-N recommendation to a user To calculate the overall rating for the user , we use Eq. (12).
Wi represents the selected weight of the users to item , and Pi represents the predicted rating of the users to the item .
3.4. Implementation
Java programming language was used for implementing both systems. Java is a class-based, object-oriented programming language that is rich in FL and GA libraries that enhanced the process of both systems implementation,
3.4.1 Performance Metrics
To check the precision of both systems we explored the three categories of prediction precision measures [3]. As follows:
- Rating predictions: Root Mean Squared Error (RMSE) and Mean Average Error (MAE) were used.
Where: , represent the predicted rating generated by the system and represent the actual rating of the user.
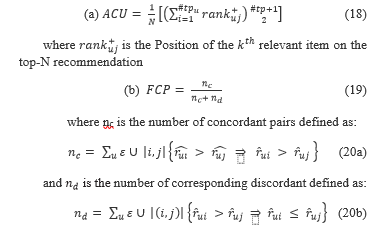
- Usage prediction: This is used to measure the accuracy of the system based on how the system would predict the item a user would add to their content list. We considered Recall and Mean Average Precision (MAP) for the top-10 recommendation, which is defined in Eq. (15) and Eq. (17).

Where is the number of positive useful items and is the number of useful predictions that are not in the top-n recommendation list.
- MAP: This calculates the value of Average Precision (AP) throughout the distinctive levels of recall. The value of MAP is expected to be less than or equal to 1 for a good algorithm and 0.5 for a bad algorithm. Eq. (16) and Eq. (17) was used to calculate these
 Where M represents the total number of items that are relevant in the catalogue of Top-N recommendation
- Ranking prediction: This evaluates how accurate the system would predict how a user would rank items according to their preference. Three approaches were considered, they are
- Fraction of Concordant Pairs (FCP),
- Normalized Discounted Cumulative Gain (NDCG).
 4. Results and Discussion
This section discusses the results of the experiments done
4.1. Experiment
To verify the precision and efficiency of both systems, experiments were done using the Yahoo! movie dataset. An offline experiment was performed to simulate the actual system. Both systems were compared with their corresponding traditional collaborative filtering technique known as Asymmetric Singular Value Decomposition (AsySVD). We performed each test using a 10-fold cross-validation rule, which randomly divides the datasets into 10 separate subsets. The dataset was divided on a ratio of 90: 10 where 90% is used as training-sets and 10% as a test-set. The precision of both systems was checked by applying the metrics discussed in section 3.3.1. The results of evaluating the systems were compared with their corresponding traditional rating. TABLE 5 and TABLE 6 give the breakdown of the resulting performance evaluation of the system. We used Adaptive MCRS, Fuzzy-MCRS and AsySVD to represent Adaptive Genetic MCRS, Fuzzy logic model and Asymmetric SVD respectively.
Table 5: Performance Evaluation Results
| Performance-measure | AsySVD | Adaptive-MCRS | %Accuracy Improvement |
| MAE | 2.3980 | 1.5990 | 0.7990(49.9%) |
| RMSE | 3.0900 | 2.1220 | 0.9680(45.6%) |
| MAP | 0.0200 | 1.0290 | 1.0090(98.1%) |
| AUC of ROC | 0.6880 | 0.9510 | 0.2630(27.7%) |
| FCP | 0.7100 | 0.9460 | 0.236(24.9%) |
It can be clearly seen from TABLE 5 above that the Adaptive MCRS outperforms the traditional AsySVD. The results proved that Adaptive MCRS achieved better predictive performance. The Adaptive MCRS approach achieved a decrease in prediction accuracy in terms of RMSE and MAE. RMSE and MAE had a value of 0.968 and 0.799 respectively, this decrease might seem minute, but it is able to generate a totally dissimilar answer and interpret into substantial enhancement on the accuracy and quality of recommendation. Adaptive MCRS achieved a MAP of 1.029, outperforming the traditional AsySVD by 50.5%. There is a necessity for recommendation algorithm to generate recommended ordering of objects or items that matches how users would have ranked the same item since users are frequently concerned of the items at the top-N recommendation list. The Adaptive MCRS achieved a more accurate and improved rank accuracy of 33.2% and 38.2% respectively for FCP and AUC when compared to the conventional AsySVD, which implies that Adaptive MCRS will provide a further precise top-N recommendation list to users. Fig. 4 is a line chart clearly demonstrating the high-performance result achieved by Adaptive MCRS as compared to AsySVD.
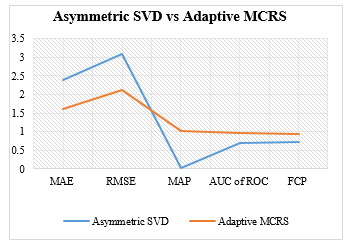 Figure. 4. The result of the evaluation of Adaptive MCRS
The result From Fig. 5 and TABLE 6, shows that Fuzzy-MCRS achieved a lower prediction error in RMSE and MAE, and similarly shows a higher-ranking accuracy in AUC and FCP. This indicates that modelling a multi-criteria RS using fuzzy logic would yield an efficient and more accurate system than the traditional AsySVD.
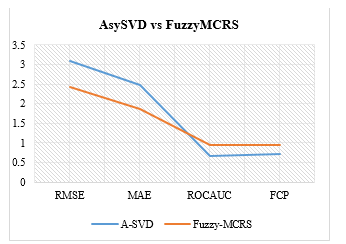 Figure 5. Comparing AsySVD and Fuzzy-MCRS
Table 6: Comparison of Result Of The Evaluation
| Metrics | Fuzzy-MCRS | AsySVD | Accuracy Improvement |
| RMSE | 2.4176 | 3.0895 | 0.6719(27.7%) |
| MAE | 1.8753 | 2.4677 | 0.5924(31.5%) |
| ROCAUC | 0.9558 | 0.6786 | 0.2572(26.9%) |
| FCP | 0.9467 | 0.7118 | 0.2349(24.8%) |
Table 7 and Fig. 6 clearly shows the comparison of the experimental result from both models. Adaptive MCRS resulted in lesser prediction inaccuracy in MAE and RMSE than the Fuzzy-MCRS, which implies that Adaptive MCRS yielded a better rating prediction than Fuzzy-MCRS. But both models seem to have equivalent usage accuracy, although Fuzzy-MCRS seem to have produced a higher usage accuracy level in ROCAUC and FCP than the Adaptive MCRS. This shows that Fuzzy-based model would be ideal for predicting the ranking behaviour of users for an item since it studies the exact degree to which a user will rank items to their content list and the order in which the items would be ranked. Similarly, Adaptive MCRS would be ideal to model a system that would be accurate in predicting and classifying the rate of satisfaction derived by a user from a purchased item.
Table 7: Comparison of Fuzzy-Mcrs and Adaptive-Mcrs
| Metrics | Fuzzy-MCRS | Adaptive MCRS | Percentage
Change |
| RMSE | 2.4176 | 2.122 | 0.2956 (13.9%) |
| MAE | 1.8753 | 1.599 | 0.2763 (17.3%) |
| ROCAUC | 0.9558 | 0.951 | 0.0048 (0.5%) |
| FCP | 0.9467 | 0.946 | 0.0007 (0.1%) |
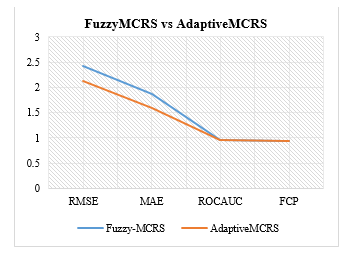 Figure. 6. Comparison of Fuzzy-MCRS and Adaptive MCRS
5. Conclusion
Providing efficient techniques for integrating the criteria ratings in multi-criteria RSs is of the utmost significance in predicting preferences of users based on several attributes of the items. Machine learning methods and other powerful techniques from the area of artificial intelligence should be the priorities, especially in product recommendations such as movies, song, and other items that could be purchased online. In this study, two important techniques (Adaptive genetic algorithm and fuzzy logic) have been proposed for developing recommendation models that could efficiently integrate the criteria ratings for making good recommendations. The experiments were conducted using a real-life dataset from Yahoo Movies, and the results have been analysed and compared. The study has shown that the two techniques realized the objectives of delivering better recommendation and predictive performance. This performance includes a reduction in error prediction and increased classification and rank accuracy. Lastly, the obtained experimental results from associating the predictive implementation of both multi-criteria recommender systems using the adaptive genetic algorithm and fuzzy logic, with existing conventional CF approach showed that the proposed system produced results that are better and also outperformed the conventional CF recommender system. Nonetheless, to achieve a better performance, it is recommended to design a hybrid model which could resolve some of the issues realized in the results of both systems.
Therefore, we propose to integrate both models to achieve higher performance. However, in the future, we plan to acquire a larger amount of data from a different domain to further certify the accuracy of the proposed system.
- L. Liu and D. Xu, “Multi-Criteria Service Recommendation Based on User Criteria Preferences,” 2011.
- F. Ricci, L. Rokach, and B. Shapira, Recommender Systems: Introduction and Challenges. 2015.
- D. R. Tobergte and S. Curtis, Recommender Systems Handbook, vol. 53, no. 9. 2013.
- R. Burke, “Hybrid Web Recommender Systems,” Adapt. Web, pp. 377–408, 2007.
- K. Lakiotaki, N. F. Matsatsinis, and A. Tsoukiàs, “Multi-Criteria User Modeling in Recommender Systems.”
- J. Mo, S. Sarkar, and S. Menon, “Know When to Run: Recommendations in Crowdsourcing Contests,” MIS Q., vol. 42, no. 3, pp. 919–944, 2018.
- G. Linden and B. Smith, “Amazon-Recommendations.pdf,” no. February 2003.
- F. O. Isinkaye, Y. O. Folajimi, and B. A. Ojokoh, “Recommendation systems: Principles, methods and evaluation,” Egypt. Informatics J., vol. 16, no. 3, pp. 261–273, 2015.
- K. Miyahara and M. J. Pazzani, “Improvement of Collaborative Filtering with the Simple Bayesian Classifier 1,” pp. 1–28, 2002.
- M. Hassan and M. Hamada, “A Neural Networks Approach for Improving the Accuracy of Multi-Criteria Recommender Systems,” Appl. Sci., vol. 7, no. 9, p. 868, 2017.
- R. Yera and L. Mart, “Fuzzy Tools in Recommender Systems: A Survey,” vol. 10, pp. 776–803, 2017.
- U. Marung, N. Theera-Umpon, and S. Auephanwiriyakul, “Top-N recommender systems using genetic algorithm-based visual-clustering methods,” Symmetry (Basel)., vol. 8, no. 7, pp. 1–19, 2016.
- J. S. Breese, D. Heckerman, and C. Kadie, “Empirical analysis of predictive algorithms for collaborative filtering,” Proc. 14th Annu. Conf. Uncertain. Artif. Intell., pp. 43–52, 1998.
- O. Alter and G. H. Golub, “Singular value decomposition of genome-scale mRNA lengths distribution reveals asymmetry in RNA gel electrophoresis band broadening,” Proc. Natl. Acad. Sci., vol. 103, no. 32, pp. 11828–11833, 2006.
- G. Adomavicius and Y. Kwon, “for Multicriteria.”
- G. Adomavicius and A. Tuzhilin, “Towards the Next Generation of Recommender Systems: A Survey of the State-of-the-Art and Possible Extensions,” pp. 1–43.
- R. P. Badoni, D. K. Gupta, and P. Mishra, “A new hybrid algorithm for university course timetabling problem using events based on groupings of students,” Comput. Ind. Eng., vol. 78, pp. 12–25, 2014.
- “Genetic Algorithms Thanks to: Much of this material is based on:,” Evol. Comput., 2009.
- L. Budin, M. Golub, and D. Jakobovic, “Parallel Adaptive Genetic Algorithm,” pp. 157–163, 1998.
- L. Jacobson and B. Kanber, Genetic Algorithms in Java Basics. 2015.
- D. Warshawsky and D. Mavris, “Choosing aggregation functions for modeling system of systems performance,” Procedia Comput. Sci., vol. 16, pp. 236–244, 2013.
Citations by Dimensions
Citations by PlumX
Google Scholar
Scopus
Crossref Citations
- Oumaima Stitini, Soulaimane Kaloun, Omar Bencharef, "An Improved Recommender System Solution to Mitigate the Over-Specialization Problem Using Genetic Algorithms." Electronics, vol. 11, no. 2, pp. 242, 2022.
- Mohammed Wasid, Rashid Ali, Sana Shahab, "Adaptive genetic algorithm for user preference discovery in multi-criteria recommender systems." Heliyon, vol. 9, no. 7, pp. e18183, 2023.
- Latifat Salau, Hamada Mohamed, Yunusa Simpa Abdulsalam, Hassan Mohammed, "Deep learning-based multi-criteria recommender system for technology-enhanced learning." Scientific Reports, vol. 15, no. 1, pp. , 2025.
- Latifat Salau, Mohamed Hamada, Rajesh Prasad, Mohammed Hassan, Anand Mahendran, Yutaka Watanobe, "State-of-the-Art Survey on Deep Learning-Based Recommender Systems for E-Learning." Applied Sciences, vol. 12, no. 23, pp. 11996, 2022.
No. of Downloads Per Month
No. of Downloads Per Country


