
Development of Wavelet-Based Tools for Event Related Potentials’ N400 Detection: Application to Visual and Auditory Vowelling and Semantic Priming in Arabic Language
Volume 4, Issue 4, Page No 414-420, 2019
Author’s Name: Nadia Mountaj1, El-Mehdi Hamzaoui2,a), Mohamed Majid Himmi1, Mireille Besson3
View Affiliations
1LIMIARF Laboratory, University Mohammed V, Faculty of Sciences, Rabat 10000, Morocco.
2National Centre for Nuclear Energy, Science and Technology (CNESTEN), Rabat 10001, Morocco.
3Cognitive Neurosciences Laboratory, CNRS — Aix-Marseille University, Pôle 3C, Marseille 14000, France.
a)Author to whom correspondence should be addressed. E-mail: hamzaouielmehdi@gmail.com
Adv. Sci. Technol. Eng. Syst. J. 4(4), 414-420 (2019); ![]() DOI: 10.25046/aj040450
DOI: 10.25046/aj040450
Keywords: Daubechies, ERP signals, N400, Wavelets, Vowelling priming, Semantic priming

Export Citations
Neurological signals are generally very weak in amplitude and strongly noisy. As a result, one of the major challenges in neuroscience is to be able to eliminate noise and thus exploit the maximum amount of information contained in neurological signals (EEG…). In this paper, we aimed at studying the N400 wave of the Event-Related Potentials (ERPs) that may reflect the effects of vowelling and semantic priming in Arabic language. To improve the quality of the recorded ERP signals, we considered a nonlinear filtering method based on 10th order Daubechies discrete wavelet transform combined to principal component analysis (PCA). Among all tested wavelets, the Daubechies one showed high values of the used signal processing metrics. Thus, it allowed a significant enhancement of the signal to noise ratio while using only 10 ERP trials. In addition, we confirm its effectiveness while comparing the filtered outputs to those obtained using the averaging technique implemented in the conventional EEGLab toolbox. In a second step, the Mexican Hat function was used to achieve continuous wavelet analysis of the filtered signals. This time-scale analysis method permitted to get an alternative representation of the ERPs and to detect the N400 wave with significantly greater accuracy.
Received: 04 May 2019, Accepted: 31 July 2019, Published Online: 16 August 2019
1. Introduction
The Event Related Potential (ERP) N400 wave is a negative deflection or component elicited by the brain as a reaction to semantically unexpected words in sentence contexts [1]. The N400 component has been found in many languages, such as English, French, Mandarin Chinese…, but to our knowledge, only a few studies have examined the occurrence of an N400 in the Arabic language [2].
The shallow or deep character (i.e vowelled or unvowelled words respectively) of written depends on how its phonology is reflected by the orthography of the language. Indeed, Arabic written words are composed from consonant and long vowels in addition to diacritics. These last reflect the vowellisation of the written word in order to enable inferring specific pronunciation. Also, Arabic is characterized by a non-concatenative morphology whereby every surface form is analyzable into a consonantal root, that conveys semantic meaning, and a word pattern (made up of vowels and of a subset of consonants) conveying morphosyntactic and phonological information.
In the present experiment, we recorded and analyzed ERP, in particular the N400 component, while participants performed a semantic judgment task with Arabic words. As many neural signals, ERPs are very weak signals and strongly corrupted by noise. Thus, previous studies aimed at improving the quality of ERP signals using statistical methods [3,4], linear and nonlinear adaptive filtering [5], neural network based techniques [6] and wavelets denoisng techniques [7,8].
In the present study, our aim was to go one step further to improve the quality of ERP signals. We used discrete wavelet combined with principal component analysis (PCA) as nonlinear filtering tools. This allowed us to enhance the signal to noise ratio and thereby to highlight the N400 component. In addition, we used the Mexican hat function to achieve the time-scale analysis of the filtered ERPs in order to detect the N400 with more accuracy.
2. Material and methods
2.1. Experiment
In our experiment, which was approved by the Ethics Committee of the Mohammed V University, a total of 20 Master MSc and PhD students (10 women), aged between 20 and 34 years old, were tested after giving their written consent to participate in the experiment. They were all right-handed and without neurological disorders. They all use Arabic daily.
Each participant was comfortably seated in a Faradized room and was asked to silently read two words that were successively presented at the center of a computer screen. A total of 256 Arabic prime-target word pairs were used as stimuli with 128 pairs presented in the vowelled condition and 128 pairs presented in the unvowelled condition. For each condition, 64 pairs were semantically related and 64 pairs were semantically unrelated. For both vowelled and unvowelled pairs, two lists were constructed so that across lists, the same target word was paired once with a semantically related prime and once with a semantically unrelated prime [2]. The order of presentation of the two lists was balanced across participants.
EEG data was continuously recorded using 24 electrodes (impedance < 5kΩ) mounted on an elastic head cap according the 10/20 International EEG System [9]. The signals were amplified using SAI amplifiers (San Diego) and recorded at a sampling frequency of 250 Hz. The Electro-Occulogram (EOG) was recorded from an electrode placed under the right eye to detect eye blinks. Finally, two reference electrodes were placed on the left and right mastoids. The experiment was conducted in a Faraday’s cage in order to reduce external interference [10].
The analyzed ERP signals correspond to the electrodes F3, F4, C3, C4, P3, P4, Fz, Cz and Pz. Previous results have shown that the N400 component is larger over centro-parietal regions of the right hemisphere than over frontal regions.
At the end of the experiment, three participants have been excluded because they present too many ocular and muscular artifacts contaminating the EEG signal.
2.2. Data analysis
Since the creation of wavelets, scientific and technical applications based on this mathematical tool have continued to be developed [11,12], exploiting their power and their efficiency for to perform multiresolution data analysis [13,14]. In the present work, we used a filtering technique developed by AminGhafari M. et al., [15] in order to denoise multivariate signals. This method combines both univariate wavelet decomposition of the signal and the principal component analysis (PCA) of the resulting wavelet coefficients in order to evaluate the correlation structure of the noise.
According to AminGhafari M. et al., [15], the algorithm performs the filtering task in four main steps. First, for a matrix X (nxp) of p observed signals, we achieve the wavelet decomposition at a defined level K. This results into two matrices Dk and Ak that contain respectively the details and approximation coefficients up to the level K of the p signals. Second, using the matrix Dj of finest details, a minimum covariance estimation is calculated and used for the diagonalization of a robust estimate of the noise covariance matrix. The obtained diagonal matrix is then used for changing the basis at each level 1<i<K. In the third step, the matrix Dk undergoes a classical one-dimensional soft thresholding. We then apply the PCA to both the detail and approximation coefficients matrices in order to choose the appropriate number of useful principal components. The best number is automatically defined using the Kaiser distance criterion which retains components associated with eigenvalues higher than the mean of all eigenvalues.
From the simplified matrices D and A, inverting the wavelet transform provides a new matrix containing the filtered signals. These lasts correspond to the main features of the original matrix X.
In our study, we tested 8 wavelet functions belonging to 5 wavelet families which are Daubechies of order 10 (db10) [16,17], Coiflets of order 5 (coif5) [18], Symlets of order 4 and 8 (sym4 and sym8 respectively) [19], Biorthogonal (bior1.1) [20] and Reverse Biorthogonal (rbio1.5) [18].
To evaluate the performance of the different wavelets, we computed the structural similarity index (SSIM), which is usually used to evaluate image quality on the basis of its luminance, contrast and structure characteristics. It is based on the comparison of an image I with a reference image [21,22]. It is known that the closer the SSIM value is to 1, the stronger the structural similarity between the evaluated image and the reference image is. By contrast, an SSIM value close to 0 indicates that there are no similarities between the 2 images [21]. To use this metric, we considered the matrix containing the wavelet based filter’s output signals as an image (30 matrices of 9 analyzed electrodes x 2200 samples for each participant) and we compared it to the matrix that contained the averaged trials for each electrode.
In addition, we computed the signal-to-noise ratio (SNR) via a MATLAB® routine. This signal processing metric is commonly used to assess the performance of signal processing methods. It is often expressed in decibels as [23,24]:
![]() where Px and σ² denote the power density of the original and the noise signals respectively.
where Px and σ² denote the power density of the original and the noise signals respectively.
In the case of closer SNR values, we also used the mean square error (MSE), given by the following equation 2, as second metric to evaluate the accuracy of the chosen wavelet. The value of the MSE, the closer the filtered signal is to the original one and thus the better filtering method is [6,10,21,23].
![]() where and denote the original and the filtered signals respectively. N is the length of x(n).
where and denote the original and the filtered signals respectively. N is the length of x(n).
In the second step, we used the continuous wavelet transform (CWT) as an alternative method to the classical signal time representation. This is based on the idea that wavelet analysis can provide accurate and specific time-frequency decomposition of neurologic signals. This method has already been applied to EEG denoising [18,24,25], ERP component separation [26], spindle and spike detection [27,28,29], etc. It allowed an automatic processing of the signal and provided both qualitative and quantitative information.
The continuous wavelet transform converts a continuous signal into extremely redundant signal of dual continuous variables which are the translation and the scale. The resulting changed signal is easy to interpret and valuable for time-frequency or time-scale analysis [30]. In general, CWT of a signal s(t) is defined as:
where α and β represent the scaling and the dilation factors respectively, whereas ψ* is the complex conjugate of the mother wavelet function.
The scale α is associated to the wavelet’s central frequency Fc and varies according to frequencies (in Hz) by:
![]() ΔT is the sampling period.
ΔT is the sampling period.
For time-scale analysis, we represented the modulus of the CWT coefficients, which corresponds to the energy density of the analyzed signal, according to log2(α) (ordinate axis) and time (abscissas axis) [12]. In this graphical representation, called scalogram, a color map is used to quantify the energy density of the transformed signal. The highest value of the energy corresponds to the white color whereas the lowest is represented by black color [31,32,33].
In our application, ψ is chosen to be the Mexican Hat (equation 4), which is the second-order derivative of the Gaussian function. This last is not a wavelet, but all its derivatives can be used as wavelets, particularly the first and the second derivatives [34,35]. In practice, the Mexican Hat is expressed by the real function of equation (5) and represented by the figure 1 below.
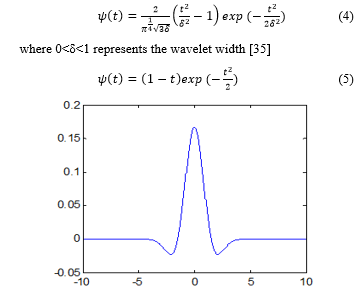 Figure 1. Plot of real function of the Mexican Hat function.
As illustrated by this figure, the Mexican Hat waveform looks like most of the waves that compose the ERPs (Figure 2). This was the reason to use it to perform the time-scale analysis of our data set. In addition, this function is easy to implement under the MATLAB environment.
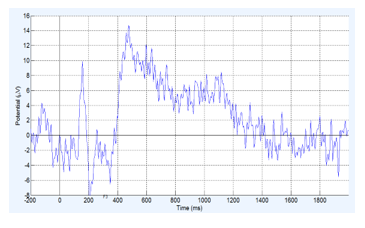 Figure 2. Example of recorded ERP.
3. Results and discussion
The averaged values of the performance metrics, SNR and MSE, corresponding to the application of the Aminghafari’s algorithm with different DWT functions to our signals are presented in Table 1. As described in the Materials and Methods section, we recorded 30 ERP signals per electrode from each participant (9 electrodes and 20 participants). We processed 5, 10 and 15 trials to evaluate the efficiency of the filtering algorithm and thus to define the most accurate DWT function that allowed a good filtering of the ERPs. Results showed that the 10th-order Daubachies wavelet (db10) yielded the best results in terms of accuracy of de-noising ERP signals. In fact, this DWT function shows the highest SNR values and the lowest MSE values in all test conditions.
Importantly, and as presented in Table 2, db10 showed the highest values of the structural similarity index for all electrodes. In addition, and as illustrated on Figure 3, its application to filter the ERPs showed good improvement of the visual quality of waveforms’ plots.
Visual comparison of these results to those obtained using the classical averaging method implemented in the EEGLab Toolbox showed that, for each electrode, the same visual quality of plots is obtained via our method and via EEGLab when averaging all recorded signals for SNR values of about 3.5. However, using our db10-PCA filtering method, only 5 to 10 ERP trials are sufficient to improve the SNR value and to highlight the occurrence of an N400 component. This can be explained by the fact that our filtering method is a nonlinear technique that takes into consideration some statistics of the signal and how the noise is affecting the signal. By contrast, the averaging method is a linear method that assumes that the noise is additive, white and Gaussian.
In order to still improve accuracy in N400 waveform detection, a time-scale representation of the ERP signals was performed on the basis of the Mexican hat CWT function. An example of results obtained for the 9 recorded electrodes is illustrated on Figure 4.
Table 1: Averaged values of metrics obtained using 5, 10 and 15 EEG trials.
| Wavelet Name | 5 ERP trials | 10 EEG trials | 15 EEG trials | ||||
| MSE | SNR | MSE | SNR | MSE | SNR | ||
| Daubachies | db10 | 62,84 | 7,90 | 74,96 | 7,10 | 68,61 | 6,13 |
| Coiflets | coif5 | 70,19 | 6,64 | 92,70 | 6,50 | 79,73 | 5,66 |
| Symlet | sym4 | 67,63 | 7,19 | 86,94 | 6,77 | 78,32 | 5,66 |
| sym8 | 68,64 | 7,20 | 89,95 | 6,63 | 78,05 | 5,75 | |
| Mery | dmey | 102,60 | 5,42 | 141,43 | 5,82 | 114,99 | 4,49 |
| Biorthogonal wavelet | bior 1.1 | 73,68 | 6,59 | 84,64 | 6,38 | 85,34 | 5,08 |
| Reverse biorthogonal | rbio 1.5 | 67,19 | 7,26 | 88,92 | 6,65 | 77,26 | 5,77 |
Table 2: Averaged values of structural similarity index metric.
| Wavelet Name | Structural similarity index metric | |||||||||
| F3 | F4 | C3 | C4 | P3 | P4 | Fz | Cz | Pz | ||
| Daubachies | db10 | 0,97 | 0,99 | 0,95 | 0,98 | 0,93 | 0,94 | 0,99 | 0,98 | 0,96 |
| Coiflets | coif5 | 0,54 | 0,50 | 0,52 | 0,50 | 0,58 | 0,49 | 0,55 | 0,60 | 0,59 |
| Symlet | sym4 | 0,28 | 0,26 | 0,23 | 0,28 | 0,3 | 0,31 | 0,29 | 0,23 | 0,31 |
| sym8 | 0,25 | 0,30 | 0,27 | 0,31 | 0,27 | 0,28 | 0,31 | 0,29 | 0,32 | |
| Mery | dmey | 0,08 | 0,11 | 0,09 | 0,10 | 0,07 | 0,14 | 0,08 | 0,15 | 0,08 |
| Biorthogonal wavelet | bior 1.1 | 0,18 | 0,22 | 0,20 | 0,17 | 0,21 | 0,22 | 0,26 | 0,22 | 0,23 |
| Reverse biorthogonal | rbio 1.5 | 0,27 | 0,35 | 0,25 | 0,33 | 0,28 | 0,31 | 0,36 | 0,33 | 0,27 |
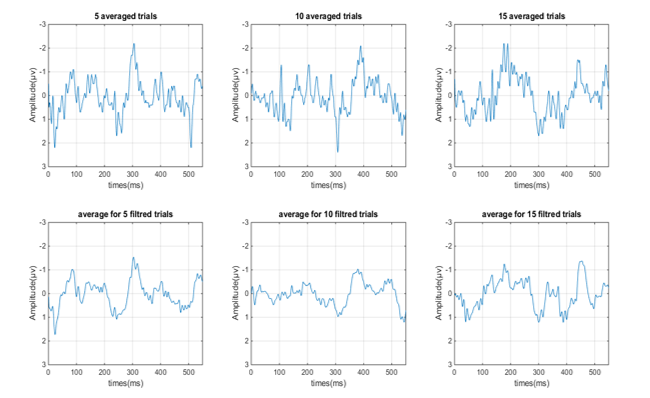 Figure 3. 5, 10 and 15 ERP trials filtered using both EEGLab Averaging technique (Up) and the developed db10-PCA filtering method (down).
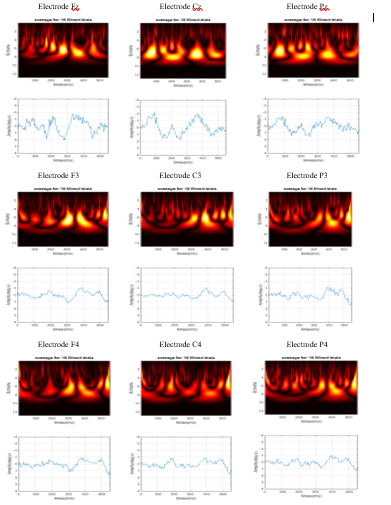 Figure 4. Scalograms of the average of 10 filtered ERP trials using db10-PCA.
Visual reading of these scalograms revealed the presence of light-colored vertical bands for medium and small scales, depicting smaller changes throughout the ERP signal. In particular, high- energy concentrations are observed in the time range of the N400 component [360; 470msec] and for scales between 3 and 8. Importantly, these regions correspond to a maximum energy around the position of the N400 component in the temporal representation of the ERP signal.
Based on these results and similar ones obtained by processing the entire set of data available for this study, the maximum energy localization in time and scale allowed us to define a qualitative criterion to detect the N400 occurrence and position. Moreover, we have demonstrated in our previous scientific works, that the primed Arabic words elicit smaller N400 components than unprimed Arabic words [2]. This result is confirmed by the use of the CWT technique. Indeed, for unprimed Arabic words, a high energy band is detected around 380 to 410 millisecond, that is, in a narrow range of about 30 milliseconds, whereas for primed words, this energy region is of very low intensity.
4. Conclusion
In this study we exploited the wavelets, as signal processing tools, to improve the quality of the ERP signals recorded during a semantic priming task in Arabic. We used the discrete wavelet transform to denoise the recorded signals. Moreover, the filtering procedure combined the DWT and the PCA methods to form a nonlinear filter that allowed us to improve the visual quality of ERP plots based on a few trials only. Importantly, using the SSIM, the SNR and MSE metrics, we demonstrated that 10th-order Daubachies wavelet of order 10, was the most efficient to improve the SNR and thus to reveal the occurrence of the N400 component. Finally, visual comparison with the results obtained using EEGLab tools, showed that our procedure allowed a clear improvement of the quality of the ERP plots.
In a second part, we used the continuous wavelet transform based on the Mexican Hat function to perform the time-scale analysis of the filtered ERPs. The resulting scalograms allowed us to define qualitative and quantitative criteria to detect the presence of the N400 component in the auditory and visual evoked signals. The qualitative criterion consists of visual reading of the energy density representation whereas the quantitative criterion is based on defining with acute precision the maximum of the N400 energy within time and scale positions. In this case, we found that, for unprimed Arabic words, a high energy band is detected between 3 and 8 on scale axis and in the time range [380; 410msec]. This last corresponds to the normal position of the N400 wave in the temporal representation of an ERP. In the case of primed Arabic words, a very low intensity energy region is present in the time range [360; 470msec].
Conflict of Interest
The authors declare no conflict of interest.
Acknowledgment
This work was supported by the French-Moroccan Research Consortium (GDRI-Neuro), coordinated by Dr Driss Boussaoud and supported by the French Government and the French Institute of Life Sciences.
- M. Kutas, S. A. Hillyard, “Reading senseless sentences: brain potentials reflect semantic incongruity” Science, 207(4427), 203-205, 1980.
- N. Mountaj, R. El Yagoubi, M. Himmi, F.L. Ghazal, M. Besson, S. Boudelaa, “Vowelling and semantic priming effects in Arabic” Int. J. Psychophysiol., 95(1), 46-55, 2015.
- G. Inuso, F. La Foresta, N. Mammone, F.C. Morabito, “Wavelet-ICA methodology for efficient artifact removal from Electroencephalographic recordings” In 2007 IEEE International Joint Conference on Neural Networks, Orlando, FL, USA, 2007.
- D. Kang, L. Zhizeng, “A Method of Denoising Multi-channel EEG Signals Fast Based on PCA and DEBSS Algorithm” in 2012 IEEE International Conference on Computer Science and Electronics Engineering (ICCSEE), Hangzhou, Zhejiang, China, 2012.
- A. Garcés Correa, E. Laciar, H.D. Patiño, H.D. Valentinuzzi, “Artifact removal from EEG signals using adaptive filters” in 2007 16th Argentine Bioengineering Congress and the 5th Conference of Clinical Engineering, San Juan, Argentina, 2007.
- G. Kaushik, H. Sinha, L. Dewan, “Biomedical signals Analysis by Dwt Signal Denoising with Neural Networks” J. Theor. & App. Inf. Tech., 62(1), 184-198, 2014.
- M. Balamareeswaran, D. Ebenezer, “Denoising of EEG signals using Discrete Wavelet Transform based Scalar Quantization” Biomed. & Pharmacol. J., 8(1), 399-406, 2015.
- R. Princy, P. Thamarai et B. Karthik, “Denoising EEG signal using wavelet transform” Int. J. of Adv. Res. in Comp. Eng. & Tech., 4(3), 1070-1074, 2015.
- H. Jasper, “The ten-twenty electrode system of the International Federation” Electroenceph. Clin. Neurophysiol., 10, 371-375, 1958.
- N. Fathima, K. Umarani, “Reduction of Noise in EEG Signal using Faraday’s Cage and Wavelets Transform: A comparative Study” Int. J. Eng. Sci. & Comp., 6(7), 8566-8569, 2016.
- S.P. Suhas, K.P. Minal, “Quality advancement of EEG by wavelet denoising for biomedical analysis” in 2012 IEEE International Conference on Communication, Information and Computing Technology (ICCICT), Hammamet, Tunisia, 2012.
- P. Addison, The Illustrated Wavelet Transform Handbook: Introductory Theory and Applications in Science, Engineering, Medicine and Finance, Bristol: Institute of Physics Publishing, 2002.
- H. Li, H. Hu, T. Kobayashi, T. Saga et N. Taniguchi, “Wavelet Multi-Resolution Analysis of Dual-plane Stereoscopic PIV Measurement Results in a Lobed Jet” in 2001 4th International Symposium on Particle Image Velocimetry, Göttingen, Germany, 2001.
- A. Drissi, E. Maliani, M. El Hassouni, Y. Berthoumieu, D. Aboutajdine, “multi-model approach for multi component texture classification” in 2012 5th International Conference on Image and Signal Processing (ICISPP12), 2012.
- M. Aminghafari, N. Cheze, J. Poggi, “Multivariate denoising using wavelets and principal component analysis” Comput. Stat. Data An., 50(9), 2381-2398, 2006.
- D. Sundararajan, Discrete wavelet transform: a signal processing approach, John Wiley & Sons, 2016.
- I. Daubechies, Ten lectures on wavelets, SIAM, 1992.
- S. Mallat, A wavelet tour of signal processing, Academic Press, 1999.
- M.S. Chavan, N. Mastorakis, M.N. Chavan, M.S. Gaikwad, “Implementation of symlet wavelets to removal of gaussian additive noise from speech signal” in 2011 Joint WSEAS International Conferences on Recent Researches in Communications, Automation, Signal Processing, Nanotechnology, Astronomy and Nuclear Physics, Cambridge, UK, 2011.
- C. Uyulan, T.T. ERguzel, “Comparison of Wavelet Families for Mental Task Classification” J. Neurobehavioral Sci., 3(112), 2016.
- R. Dosselmann, X.D. Yang, “A comprehensive assessment of the structural similarity index” Signal, Image Video P., 5(1), 81-91, 2011.
- A. Hore, D. Ziou, “Image quality metrics: PSNR vs. SSIM” In 2010 IEEE 20th International Conference on Pattern Recognition, Istanbul, Turkey, 2010.
- A. Sundar, V. Pahwa, C. Das, M. Deshmukh, N. Robinson, “A Comprehensive Assessment of the Performance of Modern Algorithms for Enhancement of Digital Volume Pulse Signals” Int. J. Pharma. Med. Biolo. Sci., 5(1), 91-98, 2016.
- A. Dixit, S. Majumdar, “Comparative analysis of coiflet and daubechies wavelets using global threshold for image de-noising” Int. J. Adv. Eng. Tech., 6(5), 2247, 2013.
- P. Khatwani, A. Tiwari, “Removal of Noise from EEG Signals Using Cascaded Filter – Wavelet Transforms Method” Int. J. Adv. Res. Electrical, Electronic Instr. Eng., 1(21-23,12), 2014.
- C. Yongjian, “Neural Network Based EEG Denoising” in 2008 IEEE 30th Annual International EMBS Conference, Vancouver, British Columbia, Canada, 2008.
- L. Yu, “EEG De-Noising Based on Wavelet Transformation” In 2009 IEEE 3rd International (ICBBE 2009), Beijing, China, 2009.
- J. Raz, L. Dickerson, B. Turetsky, “A wavelet packet model of evoked potentials” Brain and Language, 66(1), 61-88. 1999.
- T. Kalayci, O. Ozdamar, N. Erdol, “The use of wavelet transform as a preprocessor for the neural network detection of EEG spikes” in 1994 IEEE Southeastcon Conference, Miami, FL, USA, 1994.
- S.J. Schiff, J. Heller, S.L. Weinstein, J. Milton, “Wavelet transforms and surrogate data for electroencephalographic spike and seizure detection” Optical Eng., 33(7), 2162-2170, 1994.
- Z. W. Tang, and N. Ishii, “The recognition system with two channels at different resolu-tion for detecting spike in Human’s EEG” IEICE Trans. Info. Sys., 76(3), 377-387, 1993.
- T. Kristjansson, J. Hershey, “High Resolution Signal Reconstruction” in 2003 IEEE Workshop on Automatic Speech Recognition and Understanding, St Thomas, VI, USA, 2003.
- T. Perez-Muñoz, J., Velasco-Hernandez, E. Hernandez-Martinez, “Wavelet transform analysis for lithological characteristics identification in siliciclastic oil fields” J. Appl. Geophys., 98, 298-308, 2013.
- Z. Zhou, H. Adeli, “Time-frequency signal analysis of earthquake records using Mexican hat wavelets” Comput-Aided Civ. Inf., 18(5), 379-389, 2003.
- E-M. Hamzaoui, F. Regragui, “Discrimination of Visual Evoked Potentials Using Image Processing of Their Time-Scale Representations” in 2013 2nd Conference in Electronics, Telecommunications, and Computer Engineering (CETC’13), Lisbon, Portugal, 2013
- R. M. Rao, AS. Bopardikar, Wavelet Transforms, Addison-Wesley, 1998.
- S.J. Schiff, “Resolving time-series structure with a controlled wavelet transform” Optical Engineering, 31(11), 2492–2496.
- G. Samorodnitsky, M. Taqqu, Stable non-Gaussian random processes, Chapman and Hall, 1994.