
An Analysis of Social Media Usage in Winery Businesses
Volume 4, Issue 4, Page No 380-387, 2019
Author’s Name: Constantina Costopoulou1,a), Maria Ntaliani1, Filotheos Ntalianis2
View Affiliations
1Informatics Laboratory, Department of Agricultural Economics & Rural Development, Agricultural University of Athens, 75 Iera Odos, 118 55 Athens, Greece
2Department of Business Administration, University of Piraeus, Karaoli & Dimitriou 80, 185 34 Piraeus, Greece
a)Author to whom correspondence should be addressed. E-mail: tina@aua.gr
Adv. Sci. Technol. Eng. Syst. J. 4(4), 380-387 (2019); ![]() DOI: 10.25046/aj040446
DOI: 10.25046/aj040446
Keywords: Social Media, Social Media Analytics Tools, Wine Industry, Greece, Germany, Facebook

Export Citations
Although social media is used by an ever-increasing number of businesses, its benefits have not yet been fully exploited. Social media analytics tools can prove helpful in this regard, since they comprise a unique information source for business intelligence. As the social media environment rapidly evolves, various social media analytics tools are emerging. This research examines the usefulness of social media analytics tools for assessing corporate websites and Facebook pages. Two social media analytics tools, Website Grader and LikeAlyzer, are selected to evaluate the wine industry in Greece and Germany. A comparative study of the two countries is subsequently presented. The paper suggests that researchers and practitioners can easily use these analytics tools to acquire valuable quantitative data for a fast, effective and efficient assessment of corporate websites and Facebook pages and thus improve their social media usage. The results show that the two countries present similarities, but there is great potential for improvement in their use of social media.
Received: 31 May 2019, Accepted: 23 July 2019, Published Online: 16 August 2019
1. Introduction
Digital marketing is transforming the very nature of business through the implementation of digital technologies which serve the marketing goals of businesses. Digital marketing is classified into various categories, including search engine marketing (e.g. Bing, Google), influencer marketing, social media (SM) marketing, online display advertising, mobile marketing, affiliate marketing (e.g. Amazon), email marketing, and content marketing.
SM marketing provides an innovative way of communicating with the public, attracting new and maintaining old customers, improving customer relationships, creating brand awareness, increasing market share and return of investment, gaining business revenue from sales, and engaging more customers in charities, corporate social responsibility activities and other issues [1]. Nowadays, more firms are gradually adopting SM, for example, YouTube, Twitter, Pinterest, Google+, Facebook, Instagram, and Flicker, setting aside their initial doubts regarding their effectiveness [2].
As the digital environment evolves, SM hold a substantial position in the next generation business intelligence platform. Effective SM use can have a decisive impact on a digital marketing campaign [3]. Thus, more and more SM analytics tools are emerging. Understanding SM usage in the context of digital marketing through analytics tools is critical for both academic and business communities. These tools have become a unique information source for assessing a business’s presence in the SM environment as they collect, monitor, analyze, summarize and visualize a vast amount of SM data [4]. However, businesses from various sectors, including the food and beverage industry, have not yet exploited the full potential of these tools.
Wine may be considered a social product, as it is included in the top eight product categories involved in discussions over the internet. Thus, the internet provides an ideal medium for wine promotion and sale. Surveys have shown that in comparison to many other consumer products, wine appears more often as a search engine keyword [5]. In the past wine consumers sought information from specialized magazines, books, and newsletters. Lately more and more consumers are consulting SM connoisseurs, sommeliers and the wine-loving audience in order to help them decide on a satisfactory wine purchase. On the other hand, businesses have a lot to gain from the feedback provided by customers through SM. Professionals in the wine industry are trying to understand consumer behavior and preferences through the opinions and criticism diffused through various SM [6].
Today competition in the wine market is at its highest level to date. Around the world the vineyard surface area covers 7.4 million hectares and the production of wine has reached 292.3 million hectoliters. The exact number of wine producers cannot be safely estimated since, in addition to professional winemakers, there are hobbyists, family micro-businesses and single producers. In 2018 Italy, France and Spain were the dominant global wine exporters. Specifically, in terms of volume Spain is the largest exporter and the three countries together represent half of the world market. In terms of value, France – maintaining a successful strategy for high quality products – is the leader; France and Italy together hold a share of the global market of approximately 30% [7].
However, this intense competition requires new strategies which go beyond the production of high quality wine, leading wineries to strive for differentiation [8]. Towards this end, SM have succeeded the geographic decoupling of wine customers and wineries affecting data collection and sharing, communication, and the overall wine purchasing experience.
Despite the significant impact of SM on wine customers and winery businesses [9, 10] digital marketing for wine is still complex [11]. Wineries are increasingly adopting SM [12] but at a slow pace, as most lack the knowledge to incorporate and exploit SM effectively in their marketing strategy [13-16]. A study of Italian wineries has shown that it is principally large wineries with a number of employees with SM knowledge and skills that are highly motivated for adopting SM [17].
The current study aims to shed light on the usefulness of SM analytics tools for helping businesses to evaluate SM usage, plan their SM efforts and revise them regularly. It focuses on the wine industry in Greece and Germany. Two freely available online tools are used to extract useful data for both countries. The German market holds the largest share of wine imports in Europe, becoming a target for wine exporting countries, such as Greece. In addition, Greek wine exporters are trying to become more active in the German market [18].
The article is structured as follows. We begin with a discussion of SM analytics tools. We then outline the methods and tools used for assessing German and Greek wineries’ websites and Facebook pages. The SM analytics tools, Website Grader and LikeAlyzer, are selected as these offer an accurate/comprehensive and quick assessment. Next, we present the evaluation for the two countries – 105 Greek and 100 German wineries. Finally, we provide the survey results and draw some conclusions.
2. SM Marketing
SM regard communication means among people, allowing content to be created and shared in the digital networking environment [19]. SM can be described as an online platform for participation, discussion, and sharing; its use encourages the exchange and diffusion of opinion and information among users [20]. [21] argues that the revolutionary role of content publishers provided to SM users contributes to a democratization of information. Although SM comprise sources of information, they also provide social and emotional support, as within the SM context there is emphasis on the interaction rather than on the content itself [22, 23]. [24] distinguishes five main categories of SM: collaborative projects (e.g. Wikipedia); social networking sites (e.g. Facebook); content communities (e.g. YouTube, Pinterest, and Flickr); blogs (e.g. Blogger, Tumblr, and Twitter); and virtual worlds (e.g. Second Life). SM reflect daily life discussions, occurring at work or at home, at a restaurant or supermarket, which travel far away from the place they happen and are communicated to the public through the digital world [25]. According to the definition by [26], SM can be considered an interactive dialogue. This “dialogue is often triggered by consumers/businesses and/or products/services that circulate among them to set in motion a revealing communication on promotional information, so that it allows learning from one another’s use and experiences, eventually benefitting all of the involved parties” [p. 290].
While for individuals SM serve as a means of communication for users with similar interests, businesses can leverage user conversations about their products, services and brand, and engage in discussions for using the relevant information to make better business decisions [27]. [28] designates SM marketing as an interdisciplinary and interoperable concept that uses SM to achieve business aims by adding value for the parties involved. [29] defines it as the use of SM technologies (e.g. Web 2.0, Web 3.0) and software for creation, communication, delivery and sharing of offers that have value for business owners.
SM marketing focuses on producing attractive content for customers and promoting the use and sharing of this content through the various social networks they follow. In this way “word-of-mouth” marketing is practiced, establishing a strong relationship between consumers and products, with a limited cost for businesses [5]. Although the general public uses SM primarily to develop social contacts rather than for shopping, the success of SM marketing is based on a more indirect approach. More specifically, instead of offering products for sale, the company encourages members of a community to discuss and disseminate the use and benefits of these products [30]. Several businesses try to exploit consumers’ opinions expressed through SM by involving them in product design choices [31] using SM analytics tools. In light of this, a significant number of data services, platforms and tools have been developed [32]. Some of the most popular examples are: Buffer, Hootsuite, Google Analytics, Talkwalker, TapInfluence, Brand24, Klear, Keyhol, Quintly, IBM Watson Personality analytics, BuzzSumo, Funnel.io, nTuitive.social, Sprinklr, Website Grader, MeetEdgar, MavSocial, ZohoSocial, Lithium, Social report, SumAll, Social Mention, Cyfe, Sendible, Eclincher, SproutSocial, AgoraPulse, Bit.ly, Everypost, Socedo, Socialoomph, and Fanpage Karma. However, there are also analytics tools for specific SM, for example weepi, Followerwonk, Postchup, Twitonomy and Tweetdeck for Twitter; Komfo, Sociograph.io, LikeAlyzer and AdΕspresso for Facebook; Owlmetrics, Storyheap and SocialDrift for Instagram; and ViralWoot and Tailwind for Pinterest. Table 1 presents a literature review of the use of SM analytics in various business sectors. The review was based on the Google Scholar search engine.
3. Methods and Tools
The approach used for the evaluation of the corporate wineries’ websites and their Facebook pages can be analyzed in three phases:
Table 1. Social media analytics tools review
| Social Media Analytics Tools | Paper | Sector |
| Facebook: Sociograph.io | [33] | Traded firms |
| [34] | Radiology | |
| LikeAlyzer | [35] | Hotel |
| [36] | Tourism | |
|
Pinterest: ViralWoot |
[37] | Academic libraries |
| [38] | Data management & analytics of big data | |
|
Twitter: Followerwonk |
[39] | Most influential emergency physicians |
| [40] | Hospital pharmacy | |
| Twitonomy | [41] | Communication tool in congress |
| [42] | SM marketing | |
|
All SM
Hootsuite |
[43] | SM marketing |
| Google Analytics | [44] | Usability of e-commerce sites |
| [45] | Libraries | |
| [46] | Tourism | |
| Talkwalker | [47] | Business and market research |
| [48] | Fashion | |
| Brand24 | [49] | Start-up companies |
| Quintly | [50] | Tourism |
| BuzzSumo | [51] | Health |
| [52] | SM marketing in higher education institutions | |
| Website Grader | [53] | Website evaluation tools |
| [54] | Universities’ websites | |
| MavSocial | [55] | Tourism |
| SumAll | [56] | Engaging library users |
| Social Mention | [48] | Fashion |
| [57] | SM networking | |
| Sendible | [58] | SM management tools |
| [59] | SM marketing | |
| AgoraPulse | [60] | Fitness |
| Fanpage Karma | [61] | Brand communication |
| [62] | SM marketing | |
| [63] | Wine tourism |
- Determination of the sample of winery businesses.
- Selection of appropriate SM analytics tools for assessing websites and Facebook pages.
- Data collection and analysis.
The survey was conducted in 2019 and the sample for Greek and German wineries was identified through the Google search engine. For the Greek market the keywords used were: “winery”, “retail sale winery”, “Greek winery”, “wine”, “wine trade”, “winemaking”, “wine in Greece”. For the German market the keywords used were: “Wein”, “Weingut”, “Deutscher Wein”, “Wein Online-Shop”, “German wineries”, and “German wines”. 105 Greek and 100 German wineries were identified, which have a corporate website and/or a Facebook page.
The selection of the appropriate SM analytics tools was based on the aforementioned literature review (Table 1) and free online availability of tools. Website Grader (website.grader.com) was selected for corporate websites and the LikeAlyzer (likealyzer.com) was selected for Facebook pages [35, 54, 64-67].
Website Grader is a comparative online tool, which evaluates a website based on a standard rating (from 0 to 100) in relation to other sites. The rating indicates whether the website works well for the company and helps to improve website quality. More specifically, the features that Website Grader evaluates are:
- Performance: evaluates the overall appearance of a website, the size of web pages and its speed. Performance is probably one of the most important features, as it is associated with the visitor’s first impression and experience of the website. This can help increase the visibility and impact of the business. The value of this feature ranges from 0 to 30. The performance feature includes the following characteristics: page size, page requests, page speed, browser cashing, page redirects, compression, and render blocking.
- Mobile readiness: refers to the capacity to view the website on any mobile device, for example smart phones, in terms of response and viewer settings. As a large portion of the purchasing community visits pages and makes extensive use of the internet and SM from their mobile device, the flexibility of a website to work efficiently on these devices is important. Its value ranges from 0 to 30. Responsiveness and viewport are the characteristics included in this feature.
- Search Engine Optimization (SEO): relates to the ranking of the website by search engine users. The short title of a website, short descriptions and keywords can help improve the rankings. Its value ranges from 0 to 30. The SEO feature includes the following characteristics: page titles, sitemap, headings, and meta description.
- Security: checks the existence of a security certificate, such as a Secure Sockets Layer (SSL), for ensuring security and authentication of information submission. The value of this feature ranges from 0 to 10.
The LikeAlyzer tool was selected for the evaluation of wineries’ Facebook pages. It is a popular analysis tool [66], which provides monitoring and feedback on an organization’s Facebook presence and impact, allowing the comparison and exploration of Facebook potential. More specifically, it assesses any Facebook page, provides suggestions for improvement and compares it with other Facebook pages. The features that the LikeAlyzer evaluates are the following:
- Frontpage: refers to the visitor’s first impression of the page. This includes information about the business, for example, about, username, profile picture and cover photo, and call to action.
- About: regards more detailed business information, such as milestones, contact information, location and products.
- Activity: concerns the activity of the page and how often it occurs. It evaluates the number of pages liked, native Facebook videos, the number of posts per day, and the average post length.
- Response: refers to the response to visitors, either through comments on posts or through personal messages. It evaluates whether visitors can post.
- Engagement: evaluates visitors’ activity on the page, and some features that can only be accessed by the page developer. The number of people who have interacted with the page and the total page likes are measured.
It is worth noting that LikeAlyzer does not provide an overall score, but each feature is graded from 0 to 100%.
4. Results
4.1. The Greek Case
Europe is a leader in global wine exports. In Greece the importance of the winemaking sector is reflected in its potential for promoting traditional products abroad [18]. As one of Greece’s main export products, wine comprises more than 50% of the total export value of the Greek beverage industry. Fragmentation of domestic production and the large number of businesses that are exclusively active in winemaking, mainly small and medium sized companies, are the main characteristics of the sector [3]. There are also large wineries with extensive distribution networks throughout Greece, which are responsible for a significant proportion of wine production. Moreover, although the Greek economic crisis has resulted in a decrease in demand, recently it has generated an increased interest in non-bottled wines [68].
Of the 105 Greek wineries in the sample, 86% have a corporate website for promoting and advertising their products/services, 72% support a Facebook page, 37% use Instagram, 38% use Twitter, 17% use YouTube, and 10% use Pinterest. This leads to the conclusion that Greek wineries use and trust SM, and especially Facebook, Instagram and Twitter, for marketing activities [3]. It is evident that Greek wineries have turned to the digital environment for success in the market. The wine industry has been among the slowest to adopt SM [69]. As regards the year the winery established its internet presence, 24% established between 1999 and 2005, 22% between 2006 and 2011, while 54% between 2012 and 2018. Turning to the languages supported by corporate websites, 82% are both in Greek and English and 18% only in Greek, indicating that the majority are interested in export activities.
Greek winery websites were evaluated with Website Grader. The overall mean score was 66.42%. The overall mean score for each of the Website Grader features is: (a) performance: 19.45/30; (b) mobile readiness: 23.62/30; (c) SEO: 17.06/30 and (d) security: 6.12/10. Figure 1 shows the scores of performance characteristics of a Greek winery website.
Figure 2 shows the overall recommendations of the Website Grader tool for the improvement of the particular website. The recommendations refer only to performance and SEO features, which scored lower than satisfactory values.
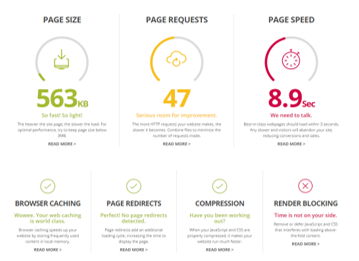 Figure 1. Website Grader Results for performance characteristics of a Greek winery website
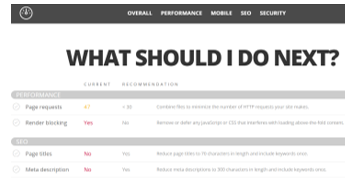 Figure 2. Website Grader recommendations for performance and SEO characteristics of a Greek winery website
Next, the results from the LikeAlyzer evaluation are presented. The Frontpage feature mean score for the sample is 97% and is analyzed according to the following attributes:
- Profile picture and cover photo: 92.81% of the wineries use a profile picture/cover photo in their profile.
- Username: 93.75% use a shortened page address to promote their business more easily.
- About: 89.06% provide information about the page and what someone can expect when starting to follow the page.
- Call to Action: 100% use “Call to Action” buttons (e.g. “Message Now”, “Call Now”, “Sign Up Now”, “Shop Now”) to support interaction with users and promote the business’ main objectives.
The About feature mean score is 72% and is analyzed according to the following attributes:
- Milestones: only 3.13% use milestones to tell the story of their business.
- Contact information: 64.06% of all contact information (telephone, email, website) is provided on the Facebook page. The percentage is quite low compared to the usefulness and convenience of this information for users. In addition, the lack of such information has a negative impact on the reliability and safety of the page.
- Location: 70.31% provide the location of their headquarters.
- Products: 26.56% promote their products on their page.
The Activity feature mean score is 54% and is analyzed according to the following attributes:
- Posts per day: 0.24 are the daily posts made by businesses, which needs improvement to enhance user engagement.
- Average post length: 192.88 characters is the average length of the posts, which can be improved as it has been noted that posts with 40-100 characters generate more user engagement.
- Pages liked: 42.06 is the average number of “Likes” made by the businesses in the sample to other businesses. Increasing this average will positively affect the cross-sector dialogue and interest, as well as the overall engagement.
- Native Facebook videos: 1.56 is the average number of videos published. Given that video is considered the most engaging format on Facebook, this feature needs to be improved.
The Engagement feature mean score is 3% and is analyzed according to the following attributes:
- People talking about this: on average 163 users accessed the page or interacted with its content within the past week.
- Total page likes: 5,840 is the average number of “Likes” by users per business. A larger number of likes corresponds to the business’ wider reach.
The Response feature mean score is 85% and is analyzed according to the following attribute:
- Users can post: 52.38% of businesses offer their users the option of posting on their page.
- The German Case
German businesses have a long history in the wine sector. For the last forty years Germany has been a leader in global wine imports. Most of the Greek wine imports are made by Germany. Despite the maturity of the German wine sector, it is currently undergoing structural changes. In the near future it is expected that expenditure for marketing will increase, as consumer habits change and new marketing approaches and channels (e.g. blogs and electronic auctions) are required on the basis of a strategic path for sustainability [71,72]. The German Wine Institute, which comprises the country’s wine industry marketing organization for the generic promotion of German wines domestically and abroad, already uses SM tools, including Twitter, Instagram, YouTube and Facebook [73].
In 2012 German wineries’ SM usage was explored in two research studies [6, 74]. In [6], a sample of 321 German wineries was studied to identify winemakers’ SM preference. Facebook was found in this study to be German winemakers’ favorite platform. In [74] the SM usage of German wineries and its impact on a sample of Facebook and non-Facebook users was assessed. The turnover of purchases of Facebook users was higher than that of non-users as they are interested in sales offers from wineries they support through SM. 87% of the sample purchased wine from a specific winery and 15% purchased wine from this winery on a regular basis.
All 100 German wineries have a corporate website and 53% also have a Facebook page. Concerning the year the winery established its internet presence, 61% established between 1998 and 2005, 15% between 2006 and 2011, and 24% in 2018. As regards the languages supported by corporate websites, 29% are only in German, 71% are available both in German and English, and 7% support a third language.
Data collected from the German wineries indicate that they engage in SM marketing practices to a high degree. Regarding SM usage, 96% of wineries use Facebook, 28% use Instagram, 8% use Twitter, and 1% use YouTube and Pinterest.
German winery websites were evaluated with Website Grader, achieving an overall mean score of 70.58%. Specifically, the scores for each feature are presented as follows: (a) performance: scores reached an average of 23.61/30; (b) mobile readiness: 23.27/30; (c) SEO: 16.79/30; and (d) security: 7.65/10.
Next, the results from the LikeAlyzer evaluation are presented. The Frontpage feature mean score of the sample is 94.30% and is analyzed according to the following attributes:
- Profile picture and cover photo: 86.79% of the wineries use a profile picture/cover photo in their profile.
- Username: 94.34% use a shortened page address.
- About: 81.13% provide information about the page.
- Call to Action: 100% use “Call to Action” buttons.
The About feature mean score is 82.90% and is analyzed according to the following attributes:
- Milestones: only 9.43% use milestones.
- Contact information: 85% of all contact information is provided on the Facebook page. The percentage is not extremely high, offering scope for improvement for the German wineries.
- Location: 90.56% provide the location.
- Products: 9.43% promote their product, showing low exploitation of Facebook for promotion.
The Activity feature mean score is 42.50% and is analyzed according to the following attributes:
- Posts per day: 0.09 are the daily posts.
- Average post length: 186.74 characters is the average text size of the posts.
- Pages liked: 28.91 is the average number of “Likes”.
- Native Facebook videos: 0.91 is the average number of videos published.
The Engagement feature mean score is 3% and is analyzed according to the following attributes:
- People talking about this: on average 70 people have interacted with a page.
- Total page likes: 4,515 is the average “Likes” made by users per business.
The Response feature mean score is 90.56% and is analyzed according to the following attribute:
- Users can post: 90.56% of businesses allow users to post on their page.
In the following figures an example of a German winery assessed with LikeAlyzer is presented. Figure 3 presents the overall impression of the Facebook page, and Figures 4 and 5 show the assessment of Frontpage and Activity features respectively.
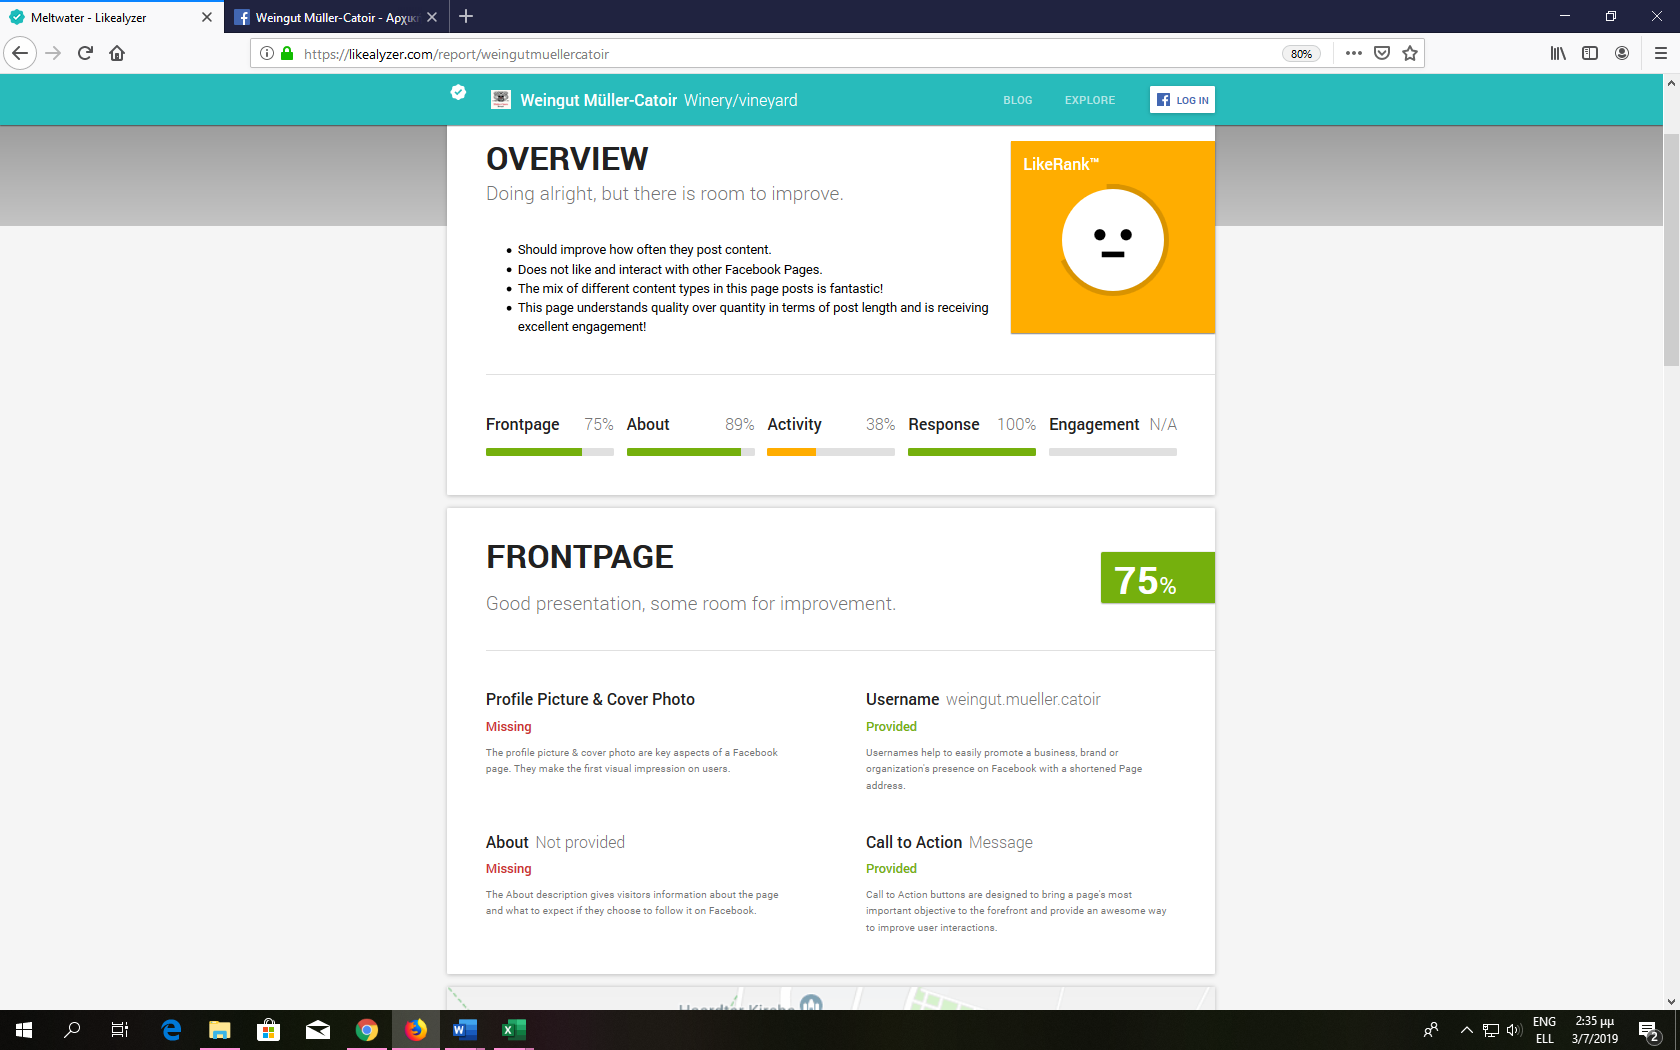 Figure 3. Overview of the Facebook page of a German winery assessed by LikeAlyzer
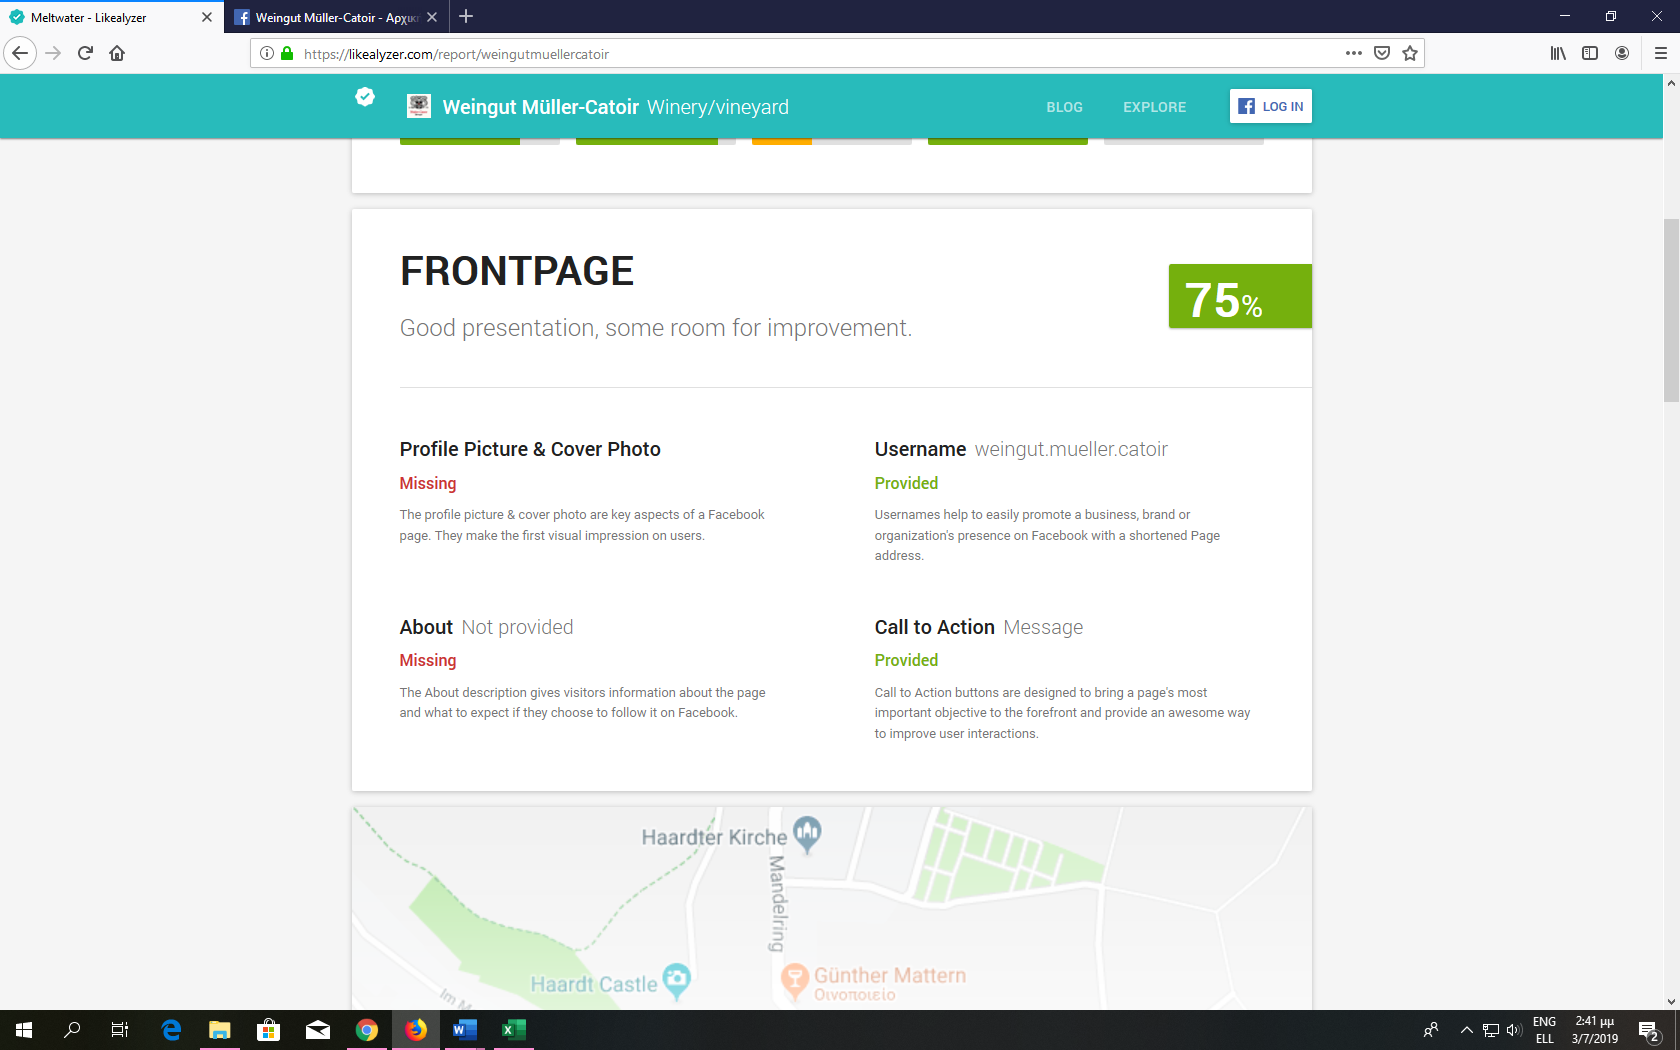 Figure 4. Frontpage feature assessment by LikeAlyzer
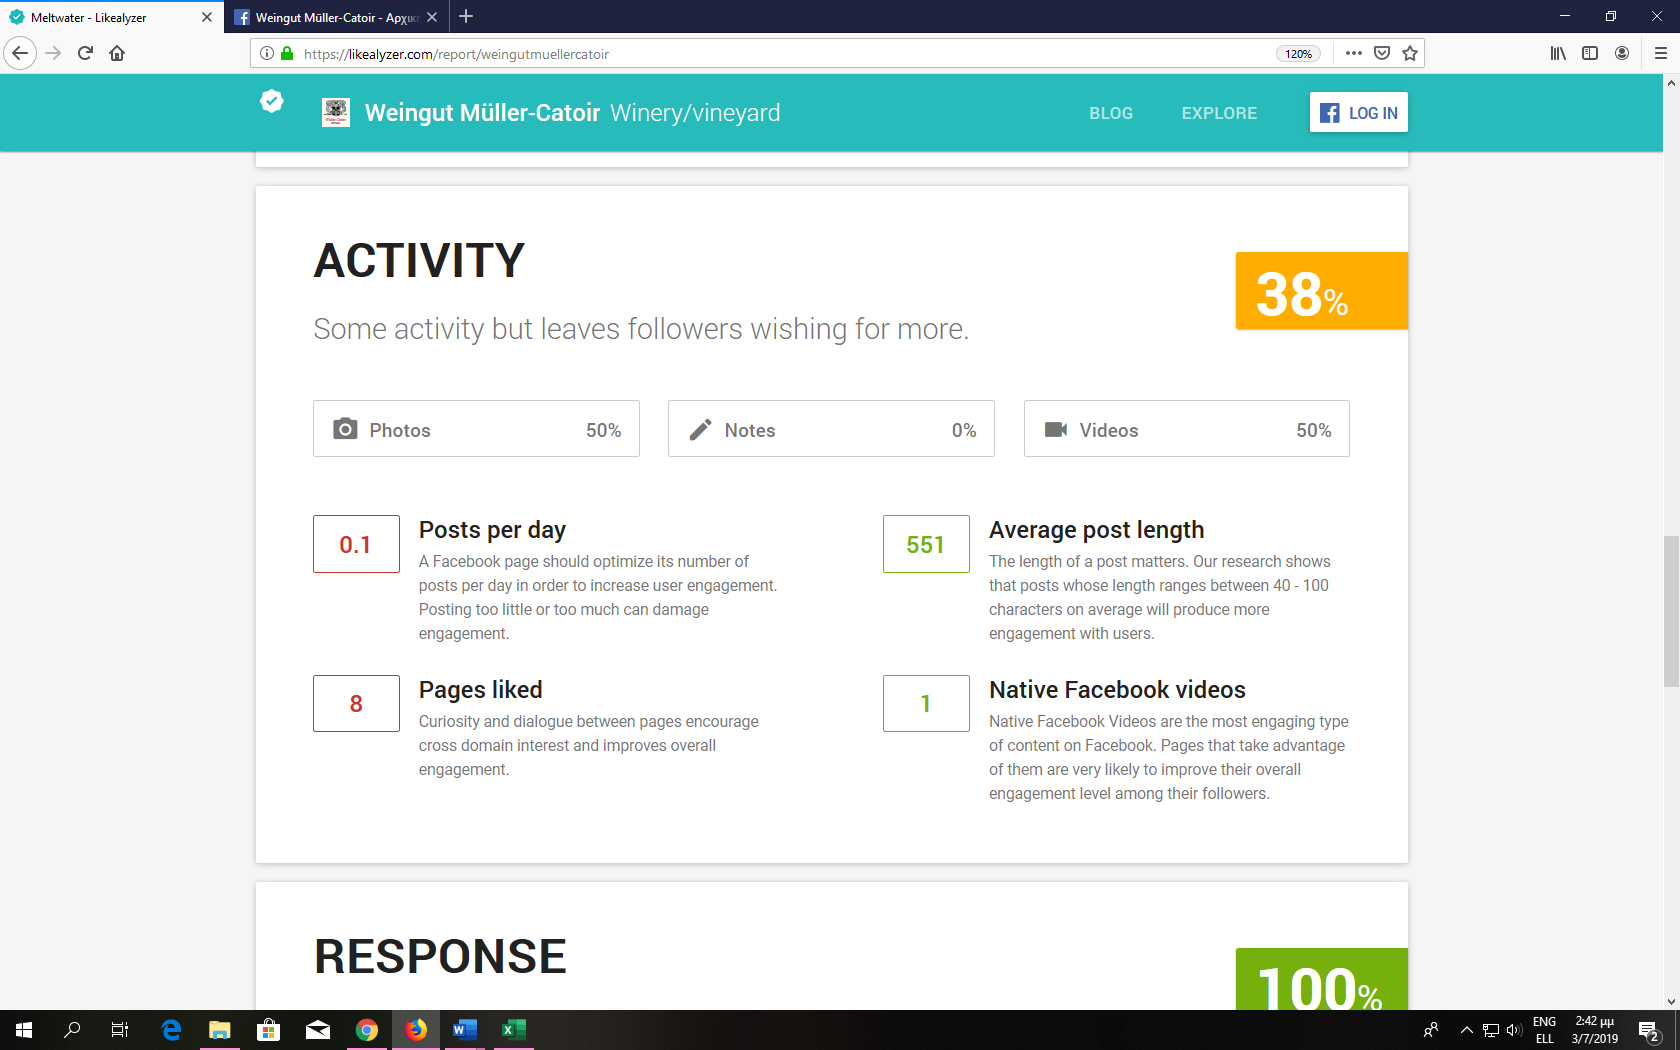 Figure 5. Activity feature assessment by LikeAlyzer
- Discussion
The assessment results of the Greek and German wine industry using Website Grade and LikeAlyzer tools are presented in Table 2. According to the Website Grader evaluation, the performance rating for Greece is 19.45 out of 30, and for Germany 23.61. This slight difference in performance of German corporate websites shows that they create a better first impression and experience for users. However, Greek winery websites enrich their content with many images and videos in addition to a standard description of their products, which significantly reduces their speed. Regarding mobile readiness, Greek and German websites have similar scores, though flexibility and responsiveness for mobile devices have to be further improved. Moreover, according to [4], 60% of users are unlikely to return to a website with accessibility problems from a mobile device, while 40% of users choose to visit a competitor’s site. It is therefore essential for winery websites to offer customers an optimized experience for their smart phones and tablets. SEO was 17.06 for Greek wineries and 16.79 for German. Greece seems to be ranked more highly when customers search through a search engine. As regards security, Greek websites scored 6.12, while German websites are ahead with a score of 7.65. Security seems to be moderate for both countries; Greek websites in particular need immediate improvement with the implementation of security protocols such as SSL.
Table 2. Greek and German winery assessment results from Website Grader and LikeAlyzer
| Features | Countries | |
| Greece | Germany | |
| Website Grader | ||
| Overall | 66.42 % | 70.58 % |
| Performance | 19.45/30 | 23.61/30 |
| Mobile readiness | 23.62/30 | 23.27/30 |
| SEO | 17.06/30 | 16.79/30 |
| Security | 6.12/10 | 7.65/10 |
| LikeAlyzer | ||
| Frontpage | 97.00 | 94.30 |
| About | 72.00 | 82.90 |
| Activity | 54.00 | 42.50 |
| Engagement | 3.00 | 3.00 |
| Response | 85.00 | 90.56 |
Well-designed corporate websites provoke customers’ emotional reactions while browsing [76]. From the study of German and Greek wineries’ corporate websites, there is an overall impression that the website design presents some differentiation. In particular, Greek wineries’ homepages have rich, impressive and colorful photos with people celebrating food and wine, experiences from product use, and information on the winery’s history, showing a better understanding of how to project customers’ ideal experience. In contrast, the appearance of German wineries’ websites is less meticulous, generating less positive or even negative comments/impressions among users [3]. A German study conducted in 2016 showed that websites with large-sized, high-quality photos of joyful people or inspired moments, such as a panoramic view of the vineyard, can potentially create an emotional impact on users/customers [75]. Customers’ emotional influence and engagement can be taken forward when wineries try to tell their own business story, allowing customers to get to know the winemakers better and identifying similar values that connect them.
Our research also provides data on extroversion to foreign customers. Specifically, 83% of Greek wineries and 71% of German wineries provide their websites in at least two languages. This indicates that Greece constitutes a dynamic player in wine exports and endeavors to develop its export activities further, and highlights Germany’s position as the largest importer of wine.
The LikeAlyzer evaluation shows that Greek and German winery Facebook pages are in general terms at similar levels. However, both countries have prospects for further improvement. Regarding the Frontpage feature that shapes visitors’ first impressions, Greece’s score of 97% is higher than Germany’s score of approximately 94%. Concerning the About feature, German pages provide a satisfactory amount of business information. However, it is worth mentioning that Greek wineries exploit Facebook more effectively than Germany by providing more product information. The Activity feature scores are low for both countries although Greek pages have more posts per day, pages liked and native videos. The Engagement feature has the same score (3%) for both countries since only Facebook page administrators have access to the specialized data. Finally, Germany scores more highly for Response, showing that German wineries allow more user interaction.
5. Conclusions
Enterprises recognize the value of SM analytics in innovation and product development, and customer service operations and strategy. Social media analytics are recently used by business managers and professionals.
SM analytics are easier to use than traditional media analysis and can provide a fast, effective and efficient assessment of corporate websites and Facebook pages. This is verified by the current research. Two freely available SM analytics tools were used to assess the corporate websites and Facebook pages of the winery industry in Greece and Germany. Few studies to date have focused on the implementation of SM analytics in the food and beverage industry. In this research the use of such tools has proved easy and effective, providing specialized data which can offer valuable insights into the wine industry in both countries. The websites of German wineries are of higher quality – from a technical perspective – than those of Greek wineries. However, the latter have a stronger Facebook presence. This can be explained by the overall attitude of Greek internet users and businesses towards SM usage. According to the Digital Economy and Society Index 2019 [77], the percentage of internet users that uses SM is 73%, 57% and 65% for Greece, Germany and the European Union respectively; the percentage of businesses that uses SM is 21%, 16% and 21% for Greece, Germany and European Union respectively.
The key contribution of this paper lies in the use of simple standard analytics to help winery managers and practitioners to plan their SM efforts and revise them regularly, using inexpensive open source tools. A limitation of this paper regards the exclusive focus on Facebook. Assessing the overall SM strategy of wineries requires the study of other SM, for example, Pinterest, Instagram, and Twitter. Such platforms can have additional potential for online visibility and direct sales by linking to corporate websites or electronic shops [75]. Future work will focus on the use of free SM analytics tools for Twitter and Instagram for retrieving data that can be used to build an overall assessment of the wine industry, as well as other food and beverage sectors. It is expected that this research will give researchers and practitioners an assessment of the wine industry and motivate them to use SM analytics tools to improve digital marketing strategies in the wine and other industries, for example, tourism, health and entertainment. This in turn can help to create a roadmap for exploitation of SM benefits.
- L. Weber, Marketing to the social web: How digital customer communities build your business. John Wiley & Sons, 2009.
- M. Armara, Digital Marketing: the effectiveness of advertising through Social Media. Master Thesis. University of Piraeus, Department of Industrial Management and Technology, 2015.
- C. Costopoulou, M. Ntaliani, F. Ntalianis, “Social Media in Greek and German Wineries’ Websites” in 2018 9th International Conference on Information, Intelligence, Systems and Applications (IISA), Zakynthos, Greece, 2018. https://ieeexplore.ieee.org/abstract/document/8633596
- D. Zeng, H. Chen, R. Lusch, S. H. Li, “Social media analytics and intelligence” IEEE Intelligent Systems, 25(6), 13-16, 2010.
- I. Fabiatou, “Greek and German Wineries’ Websites”, B.Sc. Thesis, Supervisor: C. Costopoulou, Dept. of Agricultural Economics and Development, Agricultural University of Athens, 2018.
- G. Szolnoki, H. Dieter, “Online, face-to-face and telephone surveys-Comparing different sampling methods in wine consumer research” Wine Economics and Policy, 2(2), 57-66, 2013. https://doi.org/10.1016/j.wep.2013.10.001
- OIV, Organization Internationale de la Vigne et du Vin, State of the Vitiviniculture World Market, State of the sector in 2018. http://www.oiv.int/public/medias/6679/en-oiv-state-of-the-vitiviniculture-world-market-2019.pdf
- A. Morrison, R. Rabellotti, “Gradual catch up and enduring leadership in the global wine industry” Research Policy, 46(2), 417-430, 2017. https://doi.org/10.1016/j.respol.2016.09.007
- L. Thach, T. Lease, M. Barton, “Exploring the impact of social media practices on wine sales in US wineries” Journal of Direct, Data and Digital Marketing Practice, 17(4), 272-283, 2016. https://doi.org/10.1057/dddmp.2016.5
- D. Kolb, L. Thach, “Analyzing German winery adoption of Web 2.0 and social media” Journal of wine research, 27(3), 226-241, 2016. https://doi.org/10.1080/09571264.2016.1190324
- N. A. Viana “Digital wine marketing: Social media marketing for the wine industry” in BIO Web of Conferences 7, 03011, EDP Sciences, 2016. https://doi.org/10.1051/bioconf/20160703011
- G. Szolnoki, D. Taits, M. Nagel, A. Fortunato, “Using social media in the wine business: An exploratory study from Germany” International Journal of Wine Business Research, 26(2), 80-96, 2014. https://doi.org/10.1108/IJWBR-09-2013-0031
- D.A. Laverie, W.F. Humphrey, N. Velikova, T.H. Dodd, J.B. Wilcox “Building wine brand communities with the use of social media: a conceptual model” in 6th AWBR International Conference, Bordeaux, France, 2011.
- R. Dolan, S. Goodman, C. Habel “How (and why) are wineries using Facebook for marketing?” Grapegrower & Winemaker, 595, 85-86, 2013.
- G. Szolnoki, R. Dolan, S. Forbes, L. Thach, S. Goodman, “Using social media for consumer interaction: An international comparison of winery adoption and activity” Wine Economics and Policy, 7(2), 109-119, 2018. https://doi.org/10.1016/j.wep.2018.07.001
- T. Pucci, E. Casprini, C. Nosi, L. Zanni, L. “Does social media usage affect online purchasing intention for wine? The moderating role of subjective and objective knowledge” British Food Journal, 121(2), 275-288, 2019. https://doi.org/10.1108/BFJ-06-2018-0400
- A. Galati, S. Tinervia, A. Tulone, M. Crescimanno, “Drivers affecting the adoption and effectiveness of social media investments: The Italian wine industry case” International Journal of Wine Business Research, 2019. https://doi.org/10.1108/IJWBR-04-2018-0016
- I. Eleftheriadis, “The competitiveness of Greek exports of wine to the markets of Germany and China” Master Thesis, School of Agriculture, Aristotle University of Thessaloniki, 2012.
- T. Ahlqvist, A. Bäck, M. Halonen, S. Heinonen, Social media roadmaps, Helsinki: Edita Prima Oy, 2008.
- R. Jones, “Social Media Marketing 101, Part 1”, 2009. http://searchenginewatch.com/article/2064413/Social-Media-Marketing-101-Part-1
- W. D. Evans, “Social marketing campaigns and children’s media use” The Future of Children, 18(1), 181-203, 2008. https://doi.org/10.1353/foc.0.0009
- D. Nazan, I. Menevi, R. Eyyam, “What is the motivation for using Facebook?.” Procedia-Social and Behavioral Sciences 15, 2642-2646, 2011. https://doi.org/10.1016/j.sbspro.2011.04.162
- J. Zhang, “Social Media and distance education”, 2010. http://deoracle.org/online-pedagogy/emerging-technologies-social-media-and-distance-education.html.
- A. M. Kaplan, M. Haenlein, “Users of the world, unite! The challenges and opportunities of Social Media” Business Horizons, 53(1), 59-68, 2010. https://doi.org/10.1016%2Fj.bushor.2009.09.003
- S. Tsartsaflis, E. Kletsios, “How social media influence the branding of mass catering and entertainment companies in a period of economic crisis”, B.Sc. Thesis, Alexander Technological Educational Institute of Thessaloniki, Department of Marketing, 2013.
- Y. K. Dwivedi, Κ.Κ. Kapoor, H. Chen, “Social media marketing and advertising” The Marketing Review 15(3), 289-309, 2015. https://doi.org/10.1362/146934715X14441363377999
- S. Falkow, “Social media strategy” E+ White paper 2400 (2009).
- R. Felix, P. A. Rauschnabel, C. Hinsch, “Elements of strategic social media marketing: A holistic framework” Journal of Business Research, 70, 118-126, 2017. https://doi.org/10.1016%2Fj.jbusres.2016.05.001
- T. L. Tuten, M. R. Solomon, Social Media Marketing, Sage, 2017.
- G. Schneider, Electronic Commerce, Cengage Learning Editions, 2015.
- J. Mahoney, S. Lawson, R. Stone, “What do you Think of the Return of Dunga-Rees?” Social Media Interactions Between Retail Locations and their Customers” in the 32nd annual ACM conference on Human factors in computing systems, ACM, Toronto, Canada 2014. http://dx.doi.org/10.1145/2559206.2581299
- B. Batrinca, P. C. Treleaven, “Social media analytics: A survey of techniques, tools and platforms” AI & Society, 30(1), 89-116, 2014. doi:10.1007/s00146-014-0549-4
- B. Kaushik, H. Hemani, P.V. Ilavarasan, “Social media usage vs. stock prices: an analysis of Indian firms” Procedia computer science, 122, 323-330, 2017. https://doi.org/10.1016/j.procs.2017.11.376
- R. L. Seidel, A. Jalilvand, J. Kunjummen, L. Gilliland, R. Duszak, “Radiologists and social media: do not forget about Facebook” Journal of the American College of Radiology, 15(1), 224-228, 2018. https://doi.org/10.1016/j.jacr.2017.09.013
- V. S. Kumbhar, “Hotel Websites Facebook Data Analysis Using Weka” in Second International Conference of Commerce and Management (ICCM) on Development through Transformation: Prospects for Inclusive Growth, Shivaji University, Kolhapur, 2017.
- R. McGee, “The Use of Facebook to Promote Tourist Destinations: A Case of the Middle East” Doctoral dissertation, University of New Haven, 2016.
- L. Bingle, “Pinterest in Academic Libraries: Social media policy on visual social networks”. https://ojs.library.ubc.ca/index.php/seealso/article/view/188985/186518
- R. Saravanakumar, C. Nandini, “A survey on the concepts and challenges of big data: Beyond the hype” Advances in Computational Sciences and Technology, 10(5), 875-884, 2017.
- J. Riddell, A. Brown, I. Kovic, J. Jauregui, “Who are the most influential emergency physicians on Twitter?” Western Journal of Emergency Medicine, 18(2), 281, 2017. https://dx.doi.org/10.5811%2Fwestjem.2016.11.31299
- J. M. Delgado, J. T. De Pourcq, E. M. Boquet, J. M. Sesmero, F.M. Alonso, “Social authorities concerning# hospital pharmacy on twitter”, Eur J Hosp Pharm, 2019.
- J. Straus, R. Williams, C. Shogan, M. Glassman, “Social media as a communication tool in Congress: Evaluating Senate usage of Twitter in the 113th Congress” in APSA 2014 Annual Meeting Paper, Washington, D.C., 2014.
- P. E. Lutu, “Data analytics to support social media marketing: challenges and opportunities” in CONF-IRM, Cape Town, South Africa, 54, 2016.
- P. R. Geho, J. Dangelo, “The evolution of social media as a marketing tool for entrepreneurs” The Entrepreneurial Executive, 17, 61, 2012.
- L. Hasan, A. Morris, S. Probets, “Using Google Analytics to evaluate the usability of e-commerce sites” in International Conference on Human Centered Design, Springer, Berlin, Heidelberg, 2009. https://doi.org/10.1007/978-3-642-02806-9_81
- W. Fang, “Using Google Analytics for improving library website content and design: A case study” Library Philosophy and Practice, 1-17, 2007. https://doi.org/doi:10.7282/T3MK6B6N
- B. Plaza, “Google Analytics for measuring website performance” Tourism Management, 32(3), 477-481, 2011. https://doi.org/10.1016/j.tourman.2010.03.015
- S. A. Parnsup, D. Tancharoen, N. Phaphoom, A. Kongthon, “An Adoption of Social Media Monitoring Tools for Business and Market Research” TNI Journal of Business Administration and Languages, 4(1), 1-4, 2016.
- S. Ranfagni, M. Faraoni, “Be Social and be Tuned: Evaluate your Brands in Online Communities” in 2017 Global Fashion Management Conference at Vienna, Austria, 2017. https://doi.org/10.15444/GFMC2017.03.06.01
- E. Gheribi, A. Kotnicka, A. Klemens, M. Klepacz, R. Kwiatkowski “Analysis of Financing Sources for start-up Companies” Management and Education, 14(1), 22-27, 2018.
- S. Asongu, N. Odhiambo, “Tourism and social media in the world: An empirical investigation” African Governance and Development Institute, Working Paper, 2018.
- P. M. Waszak, W. Kasprzycka-Waszak, A. Kubanek, “The spread of medical fake news in social media–the pilot quantitative study” Health Policy and Technology, 7(2), 115-118, 2018. https://doi.org/10.1016/j.hlpt.2018.03.002
- K. Aman, N. Hussin, “The Effectiveness of Social Media Marketing in Higher Education Institution” International Journal of Academic Research in Business and Social Sciences, 8(9), 827-834. http://dx.doi.org/10.6007/IJARBSS/v8-i9/4657
- S. S. Khandare, S. Gawade, V. Turkar, “Survey on website evaluation tools” in 2017 International Conference on Recent Innovations in Signal processing and Embedded Systems (RISE), IEEE, Bhopal, India, 2017.
- S. Kaur, K. Kaur, P. Kaur, “An empirical performance evaluation of Universities Website” International Journal of Computer Applications, 146(15), 10-16, 2016. https://doi.org/10.5120%2Fijca2016910922
- R. Ribeiroae, T.Florentino, “Digital Transformation in Tourism: a high level analysis of the impact that social networks and mass collaboration concept is having at tourism service providers” in 7th International Conference on Cinema and Tourism-ICCT, Porto, 2016.
- E. Ramsey, A. Vecchione, “Engaging library users through a social media strategy” Journal of Library Innovation, 5(2), 71-82, 2014.
- J. H. Kietzmann, K. Hermkens, I. P. McCarthy, B. S. Silvestre, “Social media? Get serious! Understanding the functional building blocks of social media” Business horizons, 54(3), 241-251, 2011. https://doi.org/10.1016/j.bushor.2011.01.005
- S. Thapa, G. Skinner, “Review of Social Media Management Tools and Related Literature” International Journal of Advanced Trends in Computer Applications, 2(1), 89-99, 2015.
- I. Gasparini, “Social Media Marketing: Facebook e le Banche”, Ph.D Thesis, Università di Modena e Reggio Emilia, 2015.
- J. García-Fernández, A. Elasri-Eijaberi, F. Pérez-Tur, X. M. Triadó-Ivern, L. Herrera-Torres, P. Aparicio-Chueca, “Social networks in fitness centres: the impact of fan engagement on annual turnover” Journal of Physical Education and Sport, 17(3), 1068-1077, 2017.
- A. Huertas, E. Marine-Roig, “Destination brand communication through the social media: What contents trigger most reactions of users?” Information and Communication Technologies in Tourism, 295-308, Springer, 2015.
- S. A. Movsisyan, “Social media marketing strategy of Yerevan brandy company”, Annals of Agrarian Science, 14(3), 243-248, 2016. https://doi.org/10.1016/j.aasci.2016.08.010
- M.M. Rodriguez-Fernandez, E. Sanchez-Amboage, V.A. Martinez-Fernandez, “The emergent nature of wine tourism in Ecuador and the role of the Social medium Facebook in optimising its positioning” Revista ESPACIOS, 38(14), 24-37, 2017.
- S. Kaur, K. Kaur, P. Kaur, “Analysis of website usability evaluation methods” in 3rd International Conference on Computing for Sustainable Global Development (IEEE), New Delhi, India, 2016.
- B. F. Canziani, D. H. Welsh, “Website quality for SME wineries: Measurement insights”, Journal of Hospitality and Tourism Technology, 7(3), 266-280, 2016. http://dx.doi.org/10.1108/JHTT-02-2016-0009
- M. M. Rodríguez-Fernández, E. Sánchez-Amboage, C. Rodríguez-Vázquez, M. D. Mahauad-Burneo, “Galician Spas in Facebook, Media and Metamedia Management”, Advances in Intelligent Systems and Computing, 503, Springer, 2017. https://doi.org/10.1007/978-3-319-46068-0_43
- M. Teijeiro-Álvarez, C. Rodríguez-Vázquez, F. Blázquez-Lozano, “The Importance of Social Capital in Higher Education. A Study of The Facebook Fan Pages”, New Advances in Information Systems and Technologies. Advances in Intelligent Systems and Computing, 445, 2016. https://doi.org/10.1007/978-3-319-31307-8_48
- S. Tsitos, “Empirical investigation of Greek winemaking enterprises in international markets”, Master Thesis. Department of Economics, University of Piraeus, 2016.
- O. Notta, A. Vlachvei, “Web site utilisation in SME business strategy: The case of Greek wine SMEs” in 6th International Business and Social Sciences Research Conference, Dubai, UAE, 2013.
- M. Machill, C. Neuberger, F. Schindler, “Transparency on the Net: functions and deficiencies of Internet search engines”, Info 5(1), 52-74, 2003.
- M. Dressler, “The German wine market: A comprehensive strategic and economic analysis” Beverages, 4(4), 92, 2018. https://doi.org/10.3390%2Fbeverages4040092
- A. G. Goncharuk, “Wine business performance benchmarking: A comparison of German and Ukrainian wineries” Benchmarking: An International Journal, 25(6), 1864-1882, 2018. https://doi.org/10.1108%2Fbij-06-2017-0131
- DWI, Deutsches Weininstitut/ The German Wine Institute. www.germanwines.de, 2019
- C. Hoffmann, G.Szolnoki, L. Thach, “Cross-Cultural Comparison of Social Media Usage in the Wine Industry: Differences between the United States and Germany” Successful Social Media and Ecommerce Strategies in the Wine Industry. Palgrave Macmillan, New York, 154-166, 2016.
- P. Merdian, E. Rüger-Muck, G. Raab, “Emotional impact of wine selling websites: An investigation of the online perception of wine web stores” in 9th Academy of Wine Business Research Conference, Adelaide, Australia, 2016.
- S. Wilhelm, “Erfolgsfaktor Online-Handel: Tipps für die E-Commerce-Praxis – von der Gründung bis zur Expansion, Frankfurt am Main, Deutscher Fachverlag, 2012.
- DESI, “The Digital Economy and Society Index (DESI) for 2019”, European Commission, Brussels, 2019 https://ec.europa.eu/digital-single-market/en/de