
Evaluation of the Effects of Bidding Strategy with Customized
Pricing on the Individual Prosumer in a Local Energy Market
Volume 4, Issue 4, Page No 366-379, 2019
Author’s Name: Borislava Spasova1,2,a), Daisuke Kawamoto1, Yoshiyasu Takefuji2
View Affiliations
1Sony Computer Science Laboratories Inc.,141-0022, Japan
2Keio University, Graduate School of Media and Governance, 252-0882, Japan
a)Author to whom correspondence should be addressed. E-mail: b.spasova@gmail.com
Adv. Sci. Technol. Eng. Syst. J. 4(4), 366-379 (2019); ![]() DOI: 10.25046/aj040445
DOI: 10.25046/aj040445
Keywords: Energy trading, Microgrid, Heterogeneous power sources

Export Citations
Peer-to-peer (P2P) energy trading is a mechanism that allows people to share locally the energy they have generated from distributed renewable resources (DER), to generate profit form the unused resources and to reduce the cost for electricity for the household and in the community itself. This calls for the design of new energy markets, accompanied with the development of comprehensive exchange strategies, which reflect both the consumers preferences and the heterogeneity of the renewable sources. The paper presents a study of the behavior patterns of individual prosumers using bidding strategies based on the State-of-Charge of the battery and two different pricing algorithm, one with fixed prices and one based on the battery price of each standalone system as well as the effect such patterns have on a local energy market with solar panels, fuels cells and batteries. The evaluation is achieved by the use of a prototype based on the Open Energy Systems (OES), a community in Okinawa, Japan, made of 19 interconnected houses with residential storage, photovoltaic cells and AC grid connection. In order to simulate heterogeneity, a fuel cell, modeled after Ene-Farm, is added to the original configuration. Each house has a power flow management system, which uses a priority-based algorithm to maintain demand-response efficiency, capable of scheduling the operating hours of the available fuels cells. The energy market is based on Zaraba, a continuous double auction algorithm used by the Japanese Stock Exchange, in which prosumer can bid for a desired amount and price of electricity for a 30-minutes time slot in the future The preliminary numerical evaluation is based on the results from several simulations using different versions of the bidding agent.
Received: 31 May 2019, Accepted: 27 July 2019, Published Online: 19 August 2019
1. Introduction
This paper is written as an extension of the work titled “Energy exchange strategy for local energy markets with heterogeneous renewable sources”, presented at the 2018 IEEE International Conference on Environment and Electrical Engineering and 2018 Industrial and Commercial Power Systems [1] in Palermo, Italy.
In the recent years a huge surge in the usage of renewables worldwide [2]. The growth of the solar photovoltaic capacity installations in particular is remarkable, nearly double those of wind power and adding more net capacity than coal, natural gas and nuclear power combined. This trend can be seen not only on global scale since the dropping prices for energy storage and Feed-In Tariffs(FIT) [3] has led to an increase in the adoption of solar energy by individual consumers. Additionally, the efforts of countries Resources (DER), making on-site energy sources such as fuel cells more popular with consumers [4]. However, the current centralized nature of both the grid infrastructure and the electricity markets is preventing residential customers from participating and taking full advantage of cheaper renewables. The successful implementation of blockchain technology for peer-to-peer (P2P) trading in the Brooklyn Microgrid [5], has not only led to a surge in the adoption of the technology in the development of local energy markets but to new and innovative approach towards designing such markets. Still the increased heterogeneity of the microgrids as well as the needs of the individual prosumers are yet to be addressed.
The paper [1], on which the research presented here is based, studied the impact of introducing a new power source, in this case a hydrogen fuel cells, on already existing on a local energy market with renewables and batteries. The prototype, used for the analysis was built upon and existing system, the Open Energy Systems (OES) [6], operating it real world microgrid in Okinawa, Japan. OES consists of 19 autonomous subsystems, equipped with photovoltaic cells, energy storage and loads and interconnected via DC power bus. The system, currently used by the OES microgrid, has a well-defined exchange algorithm [7], designed to enable energy exchanges between all of the connected subsystems. However, no financial rewards are attributed to the prosumers and the energy is essentially exchanged for free.
The subsequently developed prototype aimed to change that by developing a market-based trading platform which can provide financial incentives for trading and thus enabling all the prosumers to be active participants in the local energy market and to make better use of the generated renewable energy. Such approach contributes to the an increase in the self-sufficiency and the sustainability of the community itself and expands the possibility for developing decentralized energy market to reflect on the decentralized nature of the P2P exchange. Usually trading platforms require the submission of an order bid, using an internal bidding strategy, which may or may not be fully matched, or be matched only partially, with someone else?s bid using a perviously agreed matching method. The matching can be done centrally by aggregating all requests, determining a common market clearing price (MCP) in order to maximize trading volume for a given timeslot. Another approach is to use auctions, a method often used for trading goods, mainly non-fungible goods e.g. E-bay. Continuous or real-time trading, characteristic for spot markets, is used in this prototype as it provides both speed and liquidity. The bids, used here, require for the desired amount and price of the energy for exchange to be set in advance. Both parameters are determined by the individual prosumer’s exchange strategy, which is based on the State of Charge (SoC) of the available battery. A version of the algorithm was already in operation in the OES system, proving to be working well for the for subsystems with solar panels and batteries. In order to further test the SoC-based exchange strategy, a hydrogen fuel cell was added to the original configuration of the subsystems in simulated environment. The fuel cell came to the attention of the authors, due to it rising popularity among Japanese households. Unlike the the fluctuating output of the solar panels, it provides stable generation level which coupled with well devised prediction of consumption patterns can contribute to the building of off-grid communities, completely self-sufficient and independent from the utility grid.
The study presented 2018 IEEE EEEIC and I&CPS showed the broader effects of the SoC-based exchange strategy have on a community with heterogeneous power sources and the strategy itself has a very simplistic pricing algorithm which didn’t account for the actual price of the energy being exchanged. As a result, a new pricing method was added, based on the price of the energy, stored in the battery of each individual subsystem. This paper presents a quantitive evaluation of the effects of this change on the developed market as well as on the behavior of predetermined prosumers’ groups, created based on the daily consumption average. Examining more detailed behavioral patterns allows for better understanding of each prosumer’s needs which can enhanced the development of more customized bidding strategies. Moreover, it opens the possibilities to design a more diverse community, where each standalone system can use different set of power sources, to serve as testing environment in order to achieve more realistic results.
The evaluation, presented in this paper, is based on a study of the effects of SoC-based bidding strategy with simple pricing algorithm and pricing algorithm based on the current price of the energy, contained in the battery of each standalone subsystem, on the local market and on the individual prosumer. It is achiebed by comparing the results, obtained by the simulation with the OES community, with the two bidding strategies. Furthermore, the presented strategies are evaluated in the context of a single member of a prosumers’ group to better understand how changes in the bidding system can affect the individual prosumer.
Section 2 of this paper introduces the basic concepts used in the development of the solution and provides a look into the current state of P2P energy trading and existing blockchain based markets. Section 3 gives a more detailed information about the observed community and the selected prosumers’ groups. Section 4 provides an overview of the prototype’s design and the concrete implementation which is used for the quantitative evaluation. Finally, Section 5 will focus on the analysis of the simulations’ results followed by final remarks and discussion of future works.
2. Research background
This paragraph will introduce existing solutions for energy exchange between interconnected subsystems. Many studies focus on the exchange strategies between interconnected microgrids and the main grid. The research, presented by Asimakopoulou [8], suggests a Leader-Follower strategy for energy management of Multi-Microgrids, achieved with the use of bilateral contracts between microgrids and a large production unit. Wang [9] proposes a control strategy for networked microgrids and distribution systems. Other authors such as Matamoros and Gregoratti [10, 11] has focused on developing an optimization framework for a distributed energy trading algorithm between islanded microgrids. They were also among the first researchers to give a solution for direct trading between microgrids although due to the lack of clear separation between the microgrids’ internal power management strategy and their exchange strategy the proposed system didn’t offer many possibilities of implementing self-interest-based internal strategies.
Such opportunity was offered by Wang [12, 13, 14] who proposed a two-layered optimization method that separates internal and external strategy and helps avoiding undesired power injections and reduces peak consumption. This proposal creates new opportunities for collabotation between self-interest microgrids. Other papers [16, 17] prefer the use of Game Theory for the trading algorithm, while Nunna [18] came up with an multi-agent approach for power trading between microgrids using demand-response and distributed storage.
Dimeas’ paper [19] proposed a multiagent system (MAS) approach, that allows independent agents,Buyers and Sellers, to submit Bids for EnergyPackages according to GridPrices. Other papers also discussed this kind of approaches [20, 21, 22] but mainly from a theoretical point of view without physical prototype.
Starting with Nakamoto’s white paper on Bitcoin [23], Blockchain has received both academic and industry interest for being the first scalable method to successfully decentralize P2P exchanges. It can be applied not only for cryptocurrencies, but also for various other use cases as for instance in the energy sector, notably the here-addressed P2P energy trading [24]. Using Blockchain for trading was first address by Transactive Grid Project [25] which demonstrated the concept of the Brooklyn Microgrid [26], [5]. Later many projects such as Grid+ [25], NRGCoin [27], Bankymoon, Daisee, D3A and Energo Labs [28] followed but so far few pilots and prototypes are completed and the one that are focus more on developing functioning energy market from the perspective of retailers and producers and not from the customer’s perspective.
As stated in previous works [1], a prototype, following the Wang’s approach was developed, which focuses on developing a platform for trading between members of one microgrid. The base concept design allows in the future to expand the market by trading with neighbouring microgrids as well. For research purposes, a prototype was developed, having explicit separation between the internal strategy for energy management and the trading algorithm, defined in the external strategy built-in in its base design. Such division aims to address both the lack of incentive and the decision coupling issue which is particularly affects cases where blockchain is used without separating external and internal logic beforehand. The systems aims to create environment where different energy exchange strategies can be used to better reflect the different targets set by prosumers when using renewable energy. The internal strategy, is tasked with managing the demand-response efficiency of each subsystem and with evaluating the system needs for buying and selling energy, implemented by the priority-based internal agent and the bidding agent, respectfully. The external strategy is the software implementation of the local energy market, used in this study.
Moreover, unlike the other studies, introduced in the paragraph, this research focuses on the small prosumers and aims to create local energy market where each player can use a customized bidding strategy that is best suited to their needs. In order to achieve that, a better understanding of the behavior of different types of prosumers is needed. This paper deepens the study of the market by observing the effects a small change in the bidding strategy can have on the individual prosumer.
3. Application in real world microgrid
This section will provide more detailed information on the real world microgrid, used for the evaluation and on the prosumers’ groups, designed based on the recorded consumption data in the microgrid for the year 2015.
3.1. Microgrid Architecture
The OES is a bottom-up, distributed electric power system that mainly uses renewable energy sources. It presents an alternative way of exchanging energy in-between energy subsystems in order to manage energy fluctuations within the community. Supply and demand are balanced autonomously without impacting the utility grid and thus energy autonomy is increased with minimal infrastructure costs. The concept and feasibility of OES have been demonstrated in a decentralized, peer-to-peer microgrid in Okinawa, Japan. The microgrid has been operating there since late 2014 and consists of 19 houses, each equipped with their own subsystem with photovoltaic cells, residential energy storage in a form of 4.8 kWh batteries, dc nanogrid and loads. All the subsystems are connected via dedicated, shared DC power bus as well as communication line which allows energy exchanges within the community. The subsystem use a direct current (DC) procedure for exchange, combined with pure peer-to-peer
(P2P) communication infrastructure and exchange algorithm [7]. All the houses also have connection to the utility (AC) grid, which can be used as an auxiliary power supply when no other energy supply is available. Bidirectional dc-dc converters are used as an interface between subsystems: they allow for an effective control of the power flow and can be used as an abstraction of the internal subsystem design. This way, dc power can be exchanged within a community to help balancing demand-response requirements without requiring global knowledge or control.
In order to test the system capabilities in simulated environment with heterogeneous power sources, a fuel cell is added to the to the configuration of each standalone subsystem. The fuel cell, used here is largely based on Ene-Farm, a hydrogen fuel cell for home use, that has been gaining popularity in Japan. Ene-Farm is an energy system that can extract hydrogen from natural gas, usually supplied though underground pipes in most major cities in Japan, or propane gas (LPG), usually supplied to a residence via external tanks part of the building design. The hydrogen is then used in combination with ambient oxygen to generate electrical power and at the same time to capture the residual heat which in turn is used to heat up water. Ene-Farm was chosen here for both its wide spread use and its high efficiency ratio.
The extended topology of the observed microgrid, very similar to the real world one, can be seen on Figure 1.
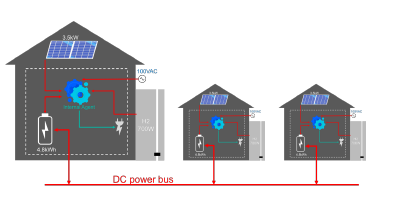 Figure 1: Sample subsystem configuration and general microgrid architecture of the chosen microgrid
3.2. Prosumers’ groups in the OES community
During the process of design and development of the prototype the daily consumption of all 19 members of the OES community for the entire year of 2015 was examined in detailed. Furthermore the solar generation patterns we also mapped for the same period of time. Based on the analysis, the OES consumers were divided into three main groups, defined by their individual average daily consumption for the observed period, using the generated output from the fuel cell and the solar panels patters a baseline indicator. The groups are as follows:
- Group 1: High consumers, with observed daily average consumption of more than 700 watts;
- Group 2: Average consumers, with daily average consumption in the range of 350 to 700 watts;
- Group 3: Low consumers, with daily average consumption of less than 350 watts.
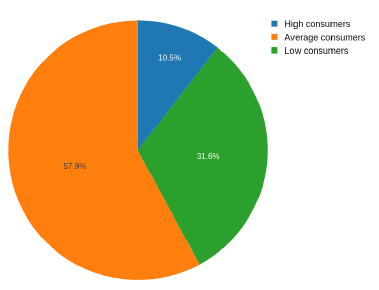 Figure 2: OES prosumers distribution, based on their consumption
Figure 2, shows that more than 50% of the consumers in the OES community are in the second category, a trend that remained unchanged for the entire year 2015. Moreover, no noticeable changes in the members of Group 2 was observed throughout the year. One notable exception was registered in April 2015 when a user moved from Group 3 to Group 1 due customers moving into previously uninhabited house.
Dividing the community into categories, based on such a crucial factor as consumption, helps further the understanding of the community and the prosumers themselves because it provides an effective way to analyze the behavior of different types of consumer since members of one category tend to exhibit similar behavior within an acceptable margin of error. That will allow for the development of different strategies aimed to satisfy the needs of variety of customers.
4. Prototype design and implementation
The prototype, presented here, is developed based on the Open Energy Systems (OES), a real world microgrid operating in Okinawa, Japan. This section will provide an overview of the basic premises and concrete algorithms used in the development of the proposed solution.
4.1. Design assumptions and limitations
During the development of the prototype, presented here, several simplification were incorporated in the design. The following paragraph focuses only on the ones that have major implication for the research, subject of this paper. For more detailed list, please refer to the cited paper [1].
- No losses, including conversion and transmission losses, are taken into account during the powerflow management;
- Projected transmission losses, however, are taken into consideration in the pricing algorithm;
- Initial investment in the renewable source is disregarded when calculating the energy price;
- Each subsystem is equipped battery, used for absorbing imbalances in the network;
- The price of the battery is calculated for ∀t ∈ T , where T is time series.
- The price of the battery is calculated as a sum of the amount charged in the battery from each power source multiplied by the predefined energy price of the source and then divided by the current amount of energy in the battery. The formula can be seen bellow.
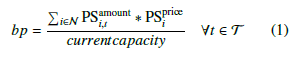 Users are charged when storing energy in the battery, not when discharging the stored energy for the consumption
- It is presumed that the data, provided by the power meters and the controllers, can be trusted;
- The DC line capacity is set as 2.5 kw for all subsystems;
- Japanese yen is selected as main currency for all the financial transactions, due to the microgrid location;
- The battery is charged solely from the renewable sources;
- There is no Feed-in to the utility grid
4.2. Prototype design
The following paragraphs will give a short description of the internal and externals strategies, focusing on the bidding component of the former. For more information about the chosen algorithms, please refer to the cited paper [1].
4.2.1 Internal strategy
The internal strategy, used in this paper, is tasked with managing the demand-response efficiency of each subsystem and with evaluating the system needs for buying and selling energy. It is comprised of two main components: prioritybased agent and bidding agent, each implementing different side of the internal agent. They are designed to work independently using only the same data in order to increase encapsulation. More information about the basis of the algorithms cam be found in the paragraphs bellow.
Priority-based internal agent: The internal agent is responsible for scheduling the power flows to and from the modules, configured for each individual subsystem. It is designed for standalone house equipped with residential storage, energy sources and loads. The fundamental premise built into the design of the system is inherent flexibility when it comes to changing the number and types of the installed power sources. Essentially the system allows for various sources such as photovoltaic and fuel cells, wind turbines, standard electricity grid, etc. to be added to the configuration at any moment, given that each source is a assigned a priority level, a parameter used to control when it is going to be used, and a price for electricity for kWh. The priority is normally determined by factors such as energy price and cost for curtailment. In the current system the priority is set as follows: fuel cell output; solar generation; battery; utility grid. In this case power sources with what is considered an expensive curtailment, like fuel cells, are given higher priority in order to fully utilize their generation even though the cost for electricity for other sources such as solar tends to be much lower. Once the priority is defined, the algorithms uses it to satisfy the demand-response requirements by accessing the available energy from each source until the demand is satisfied. If after using all the power from the renewables, the demand is still not satisfied, the system gets the remaining necessary power from the AC grid. If there is still available renewable energy after the demand-response requirements are satisfied, it is charged to the battery if there is enough capacity, the remaining energy is curtailed. As it can be seen, in this system, the battery plays a dual role as both a power source and a load. The role of the agent is to maintain internal power balance at any moment:
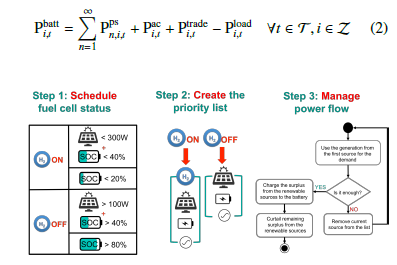 Figure 3: Scheduling conditions and simplified workflow of the internal agent.
Following the research presented in previous works [1] a scheduling component was added to the functionality of the internal agent. This software module is tasked with scheduling the operating hours of power sources with constant output like a fuel cell. The module analyzes the future energy requirements and gives command to shut down or turn on the fuel cell. Fuel cells of the Ene-Farm type require 30 minutes to stop and start operation therefore the default conditions are set based on the solar generation output and the SoC of the battery to take into account the future state of the system.
Figure 3 shows the basic workflow of the priority-based internal agent with the defined configuration. As shown the fuel cell is scheduled to shut down when the SoC of the battery is higher that 80%, which is more than enough to satisfy any upcoming changes in the consumption and to reduce to risk of curtailment from this power source. Even if the SoC is lower, if there is an observed spike in the solar generation, the fuel cell also turn off to enable the solar generation to be fully absorbed by the battery, thus utilizing better the generation and lowering the bidding price. In the opposite scenario, the fuel cell is scheduled to resume operations, when the SoC falls under 20% in order to prevent the activation of the connection to the utility grid, which has much higher price than the fuel cell generation. For the same reasons, the fuel cell turns on, when there is a decline in solar generation whether due to reduced solar radiation caused by weather conditions or during nightfall. This conditions help reduce the electricity cost for the household by decreasing the reliance on the utility grid.
Bidding agent: The bidding agent is a module that is installed together with the internal agent and is tasked with generating a sell or buy bid for the next timeslot and dispatching it for matching. Each bid consists of desired amount of electricity for a certain price for kWh. The amount is determined based on a detailed analysis of the status of each subsystem which includes the number and type of configured power sources, e.g. batteries, PV, fuel cell, etc., and current consumption and generation patterns. This is then used by a pricing function to determine the future need for electricity and is reflected in the bids that follow.
The bidding strategy, subject to evaluation of this paper, uses the State-of-charge (SoC) of the installed battery to predict the amount of electricity that will be needed for the next 30-minute timeslot but with two different pricing algorithms. The base amount, seen in Figure 4a,b, refers to the minimum amount of electricity available for exchange, calculated as a function of the DC line capacity and the trading timeslot duration to avoid line congestion.
In the case of the previously used bidding strategy, the prices are fixed based on the prices for the electricity, paid by the customer, as seen on Figure 4a. It is assumed that the lower the SoC level, the more inclined is the prosumer to buy electricity. Since all systems are connected to the AC-grid, the highest price for the electricity in the market was designed to always be less than the price of the grid. Similarly, there is a higher incentive to sell the generated renewable energy when the battery is getting full. The price in this case is set as a minimum price at which electricity can be sold while still generating profit. This pricing, although well designed for the original OES configuration, is not as effective in the presence of a stable power source such as fuel cell, because of the difference in the price for energy, generated from the solar panels and from Ene-Farm.
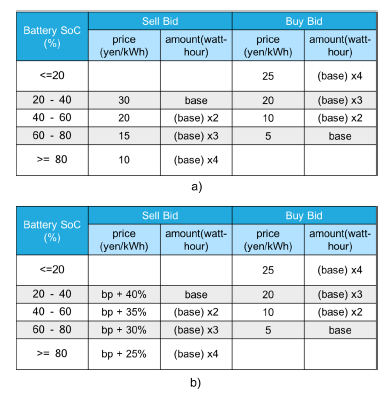 Figure 4: Bidding prices and amounts for State of Charge (SoC)-based bidding strategy with simple pricing algorithm(a) and pricing algorithm based on battery price (b).
The new pricing algorithm, shown on Figure 4b, takes into account the price of the electricity, currently stored in each individual subsystem, noted as bp in the table. It currently affects only the sell bid with the price similarly decreasing with the increased incentive to sell. The percentage is based on a projected transmission loss of nearly 15% which in the case of the studied community is paid by the Seller.
4.2.2 External Strategy:
The external strategy represents the software implementation of the local energy market, used in this study. At the core of the market is the matching algorithm, a simplified version of the Zaraba method, which is a continuous double auction algorithm used by the Japanese Stock Exchange. The trading is done in real time, with multiple sell and buy bids received for the duration of each 30-minute timeslot. They are match on on first-come first-served basis with the most beneficial counter bid being chosen each time as a counterpart. At the end of the timeslot the agreed deals are sent to the internal agent to execute the physical exchange and all the unmatched bids are invalidated.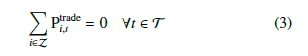
Since the DC losses are neglected, we assume that the sum of all energy trading must be equal to zero:
4.2.3 Virtual Wallet:
In order to keep an accurate record of all financial transaction, including detailed information about the used energy from the renewable sources and from the grid, cost of the energy charged to batter and cost/revenue from the energy trading, each subsystem has a virtual wallet. The data, kept in the wallet, is accessible via simple user interface which provides basic analysis and monthly reports.
5. Simulation Setup and Results
For numeric evaluation purposes, this study uses the results of multiple simulations, obtained using prototype, comparatively similar to the OES Simulator [7], written in Python 3.6. The prototype provides a software approximation of the internal power flow of each system and of the community. All the implemented algorithms are consistent with the descriptions given in the previous section and in other works [1]. The following subsection will display the general configuration of studied subsystems, the data, provide information of the scope of the data used as an input for the simulator and will discuss the results of the performed tests.
5.1. Input Data and Configuration
In order to further the research, shown in previous works [1], the simulation uses the same dataset for the consumption and solar radiation, recorded for 19 houses, part of OES in Okinawa, Japan, in the duration of year 2015 with 10 minutes granularity. The bidding is done for a 30-minutes timeslot in the future, which amounts in total to 48 trading timeslots per day.
Each subsystem in the community has the following configuration of modules:
- Solar panels with average area of 20 m2, with estimated panel yield of 19% and 75% performance ratio. Since the initial investment is not taken into consideration in the estimate, the price for solar energy is set to 0 yen for kWh.
- Fuel cell with factory output of 700 watts and predefined price for electricity of14 yen for kWh, based solely on the price of the fuel used, since the initial investment is also disregarded during calculations.
- Utility grid, used as an auxiliary power source with no power limitations. The price for electricity is considered 30 yen for kWh, which is an approximation of the real price of the electricity in Japan. This is necessary due to the varying prices for different regions as well as different usage categories.
- Battery with capacity of 4.8kWh, charged at 50% with energy price of 10 yen for kWh, used only in the first iteration of the algorithm. For the remaining of the simulation, it is calculated in the beginning of each iteration, how much energy was charge it in the previous cycle and from which renewable source.
- Wallet with 100,000 Japanese yen available.
5.2. Results
In order to evaluate the added functionality presented in this paper, two simulations are performed, each using different bidding strategies as listed below:
- SoC-based bidding strategy, described in the cited paper [1].
- SoC-based bidding strategy with pricing algorithm based on the battery price of each standalone system, presented in this paper.
All simulations are performed using a only selected potion from the available dataset with length of 1 calendar month, in this case August 2015. To simplify the visualization of the results, only one week, from August 2nd to August 9th, is taken for the analysis of the whole market. That particular week is chosen because of the variety of weather conditions that occurred during that period. The selected timeframe consisting of several sunny days and two partially cloudy day is chosen. In order to better study the behavior pattern of the individual participants, only data from 1 day, August 5th 2015, with daily generation close to the month’s average is examined.
5.2.1 Community overview
This section will provide a detailed analysis of the effects of the new bidding strategy on the entire community before focusing on selected members of the predefined prosumers’ groups. The second portion of the analysis can be seen in the next section. Detailed analysis of the results of the simulations showed 55% decrease in the number of deals with the new bidding strategy. This is due to less available matches in the preferable price range of the prosumers which makes them less willing to either sell or buy energy if it is not beneficial for them. This has had an effect on the market price as well as seen on Figure 5.
Fig. 5b shows that the pricing algorithm, has led to predictable patterns for market price, with stable peaks that indicate higher prices in comparison with the case of fixed pricing, Fig. 5a. Most influenced by the new pricing algorithm are the high consumers which show 10% decrease in energy spending. Average consumers and low consumers with daily average consumption more than 100 watts spent 7% less for electricity for the same period of time while systems with daily average consumption of less than 100 watts registers a surplus increase of 10%.
Despite the lower number of deals, there has been observed in 10% increase in the utilization of solar generation due to a drop in the consumption of electricity from the AC grid. The numbers are based on the numeric evaluation of the results though a slight reduction the curtailment peaks can be seen on Figure 6. The increase is due to more customized bidding strategy and shows that better focus on customers’ energy requirements and implementing them into individual bidding strategy can be used as a foundation for building self-sustainable community. There is no visible curve for the Fuel cell curtailment since it remains 0 for the entire period due to the efficiency of the scheduling component of the internal agent.
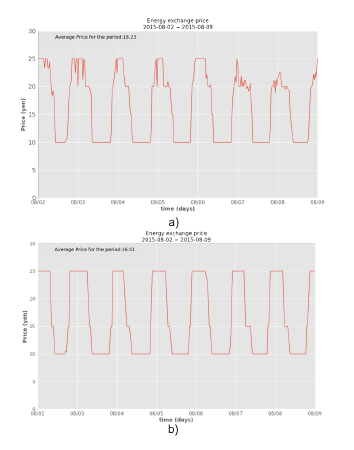 Figure 5: Market price within a community, comprised of standalone houses with solar panels and fuel cells, SoC-based bidding strategy with fixed pricing(a) and SoC-based bidding strategy with pricing algorithm based on the battery price (b)
5.2.2 Analysis of individual prosumers from the predefined groups
The analysis of a selected members of the groups, described above, provides a deeper understanding of the results shown above. Consumers of all groups showed slight in the usage of the energy stored in their battery which is a contributing factor for the slight decrease in the solar curtailment.
For a Group 1 consumer the increase has led to lowering the usage of the AC grid, shown on Fig. 7, while for consumer from Groups 2 and 3, the difference is compensated by using less electricity directly from the Fuel cell, shown on Fig. 8 and Fig. 9 respectively. The solar usage remained unchanged. Since solar energy is considerable cheaper than the one from AC or Fuel cell it can be considered as a factor in the general lowering of the energy cost.
Deeper analysis of the sources of energy for the battery further shows that the new pricing algorithm has contributed to the higher utilization of the solar energy. Although the results shows very little change for customers of Group 1, Fig. 10, in the case of customers from both Group 2 and
3, Fig. 11 and Fig. 12 respectively, shows increased charging from the solar generation while the no energy has been bought from the market. That scenario shows better management of the energy and of the trading which is more consistent with the system requirement of this two types of consumers since both should have enough energy so be entirely self-sufficient and participate in the market only to sell their excess energy. The graph of the energy exchanged through the DC bus gives even better idea of what is happening. As we can see on Fig. 14 for customers of Group 2 and Fig. 15 for customers of Group 3, there is a distinctive
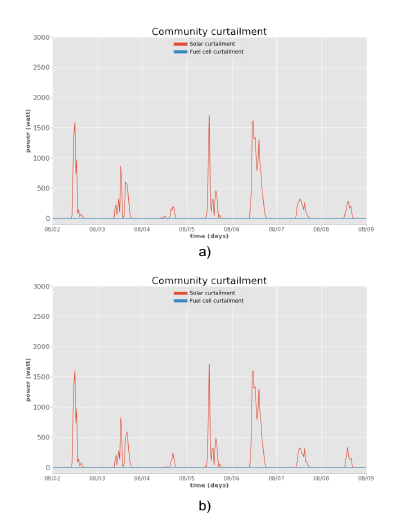 Figure 6: Average curtailment in community, comprised of standalone houses with solar panels and fuel cells, SoC-based bidding strategy with fixed pricing(a) and SoC-based bidding strategy with pricing algorithm based on the battery price (b)
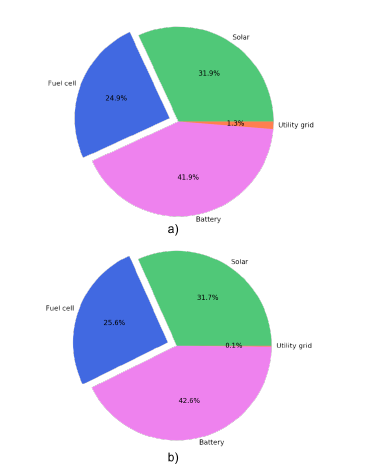 Figure 7: Energy usage by power sources for Group1 consumer that use SoC-based bidding strategy with fixed pricing(a) and SoC-based bidding strategy with pricing algorithm based on the battery price (b)
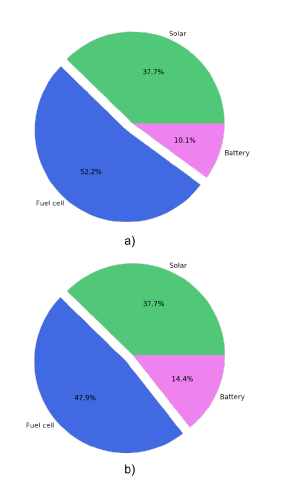 Figure 8: Energy usage by power sources for Group2 consumer that use SoC-based bidding strategy with fixed pricing(a) and SoC-based bidding strategy with pricing algorithm based on the battery price (b)
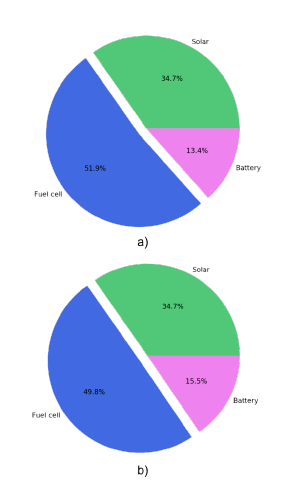 Figure 9: Energy usage by power sources for Group3 consumer that use SoC-based bidding strategy with fixed pricing(a) and SoC-based bidding strategy with pricing algorithm based on the battery price (b)
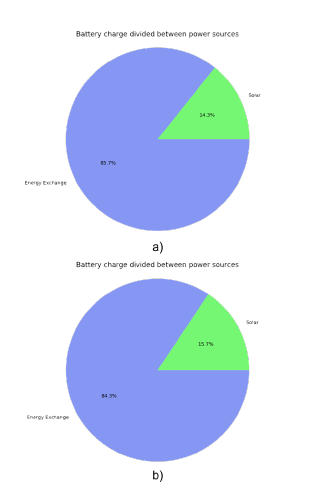 Figure 10: Energy charged to the battery by power sources for Group1 consumer that use SoC-based bidding strategy with fixed pricing(a) and SoC-based bidding strategy with pricing algorithm based on the battery price (b)
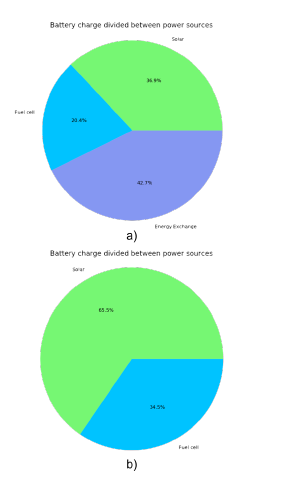 Figure 11: Energy charged to the battery by power sources for Group2 consumer that use SoC-based bidding strategy with fixed pricing(a) and SoC-based bidding strategy with pricing algorithm based on the battery price (b)
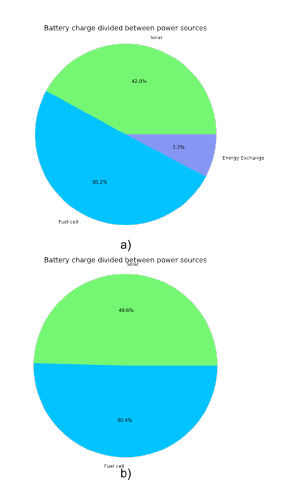 Figure 12: Energy charged to the battery by power sources for Group3 consumer that use SoC-based bidding strategy with fixed pricing(a) and SoC-based bidding strategy with pricing algorithm based on the battery price (b)
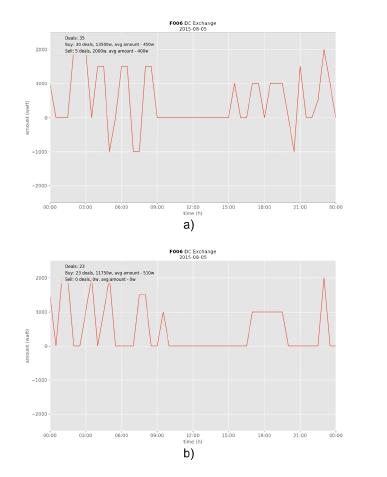 Figure 13: Deals distribution for Group1 consumer using SoC-based bidding strategy with fixed pricing(a) and SoC-based bidding strategy with pricing algorithm based on the battery price (b)
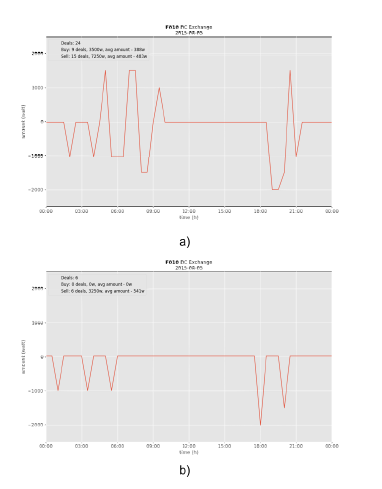 Figure 14: Deals distribution for Group2 consumer using SoC-based bidding strategy with fixed pricing(a) and SoC-based bidding strategy with pricing algorithm based on the battery price (b)
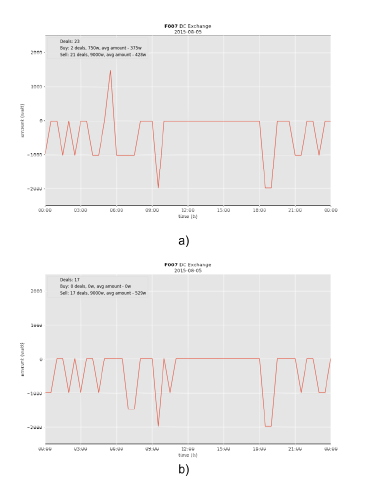 Figure 15: Deals distribution for Group3 consumer using SoC-based bidding strategy with fixed pricing(a) and SoC-based bidding strategy with pricing algorithm based on the battery price (b)
lack of spikes that indicate buy deals, which shows that in the case of the simple SoC strategy we have moments early morning and late evening where prosumers with enough energy are forced to buy from other prosumers electricity on higher prices because they have previously sold their for lower price. Reversed pattern can be observed for customers of Group 1, Fig. 13, because their have electricity demand that on average exceeds their generation by 50% so they should not be selling energy in those periods of time as well.
Although the effects on the community are only marginal, the new pricing method had shown significant shift in the patters of all of the observed individual customers. Further customization can provide better results and can make the prosumers more competitive in the market but in the context of their individual needs.
6. Conclusion
This study shows the impact of enhanced pricing algorithm, which accounts for the price of the electricity contained in the battery of standalone systems, part of a local energy market with renewables and batteries. The evaluation is done by analyzing the results, generated by a prototype with the use of real data from a full-scale microgrid in Okinawa, Japan. The microgrid represents a community of 19 houses each equipped with residential storage, photovoltaic cells, fuel cell and AC grid connection. All the houses are connected via dedicated, shared DC power bus which allows them to exchange energy with their neighbors. A continuous doubleauction algorithm, used by the Japanese Stock exchange, is used for the implementation of the trading platform. Each house can bid on the local market, using a State-of-Charge based bidding strategy. Similar to previous works [1], some simplifications were taken during the development of the simulation platform, including neglecting all losses and ignoring the price of the energy, stored in the battery when calculating the desired exchange price. The effects of the incorporation of the losses in the algorithm are yet to be studied but it is expected that such change will cause an increase in the market price. The topic is currently being investigated and will be a subject to future works.
This paper focuses on studying how including the battery price in the pricing algorithm affects different types of consumers and the community as a whole. The results show that increasing the customization leads to higher utilization of the renewables and further reduces the cost of electricity for consumers with daily average consumption higher than 100 wats. Since this was achieved with customizing a single parameter, it is the opinion of the authors that further analysis of the behavior of the individual system is need in order to create bidding strategy, tailored to each prosumer. It is the opinion of the authors that a well design exchange strategy should allow for the customers to set individual goals such as maximizing profit, maintaining independence from the utility grid, reducing energy waste, etc. It should implement a prediction algorithm which accounts for consumption and generations patterns and include weather predictions for better evaluation of the energy needs. Furthermore, with the wide spread of renewables and distributed renewable resources (DER), more diverse communities are likely to appear so further tests in the community with standalone systems with various configuration power sources can serve as a testing environment to achieve more realistic results.
Conflict of Interest
The authors declare no conflict of interest.
Acknowledgment
This paper would not have been possible without the continuous support of the Okinawa Institute of Science and Technology and H.Kitano. The authors would like to thank A.Werth and M.Hoshino, for their contribution in forming these ideas.
- B. Spasova, D. Kawamoto, Y. Takefuji, “Energy exchange strategy for local energy markets with heterogenous renew-able sources”, 2018 IEEE International Conference on Envi-ronment and Electrical Engineering and 2018 Industrial and Commercial Power Systems, 12-15 June 2018, Palermo, Italy. https://doi.org/10.1109/eeeic.2018.8494458
- Renewable energy policy network for the 21st century REN21, “Renewables 2018 Global Status Report (GSR)”, http://www.ren21.net/gsr-2018/
- A. Brautigam, T. Rothacher, H. Staubitz, and R. Trost, “The Energy Storage Market in Germany”, 2017.
- P. De Martini, K.M. Chandy and N.A. Fromer, “Grid 2020: Towards a Policy of Renewable and Distributed Energy Resources”, Tech-nical Report, California Institute of Technology, Resnick Institute: Pasadena, CA, USA, 2012.
- E. Mengelkamp, J. Garttner, K. Rock, S. Kessler, L. Orsini, and C. Weinhardt, “Designing microgrid energy markets. A case study: The Brooklyn Microgrid”, Applied Energy, vol. 210, pp. 870-880, 2017. https://doi.org/10.1016/j.apenergy.2017.06.054
- A. Werth, N. Kitamura, and K. Tanaka, “Conceptual Study for Open Energy Systems: Distributed Energy Network Using Interconnected DC Nanogrids”, IEEE Transactions on Smart Grid, vol. 6, pp. 1621–1630, jul 2015. https://doi.org/10.1109/tsg.2015.2408603
- A. Werth, A. Andre, D. Kawamoto, T. Morita, S. Tajima, M. Tokoro,
D. Yanagidaira, and K. Tanaka, “Peer-to-peer Control System for DC Microgrids”, Smart Grid, IEEE Transactions on, pp. 1–8, 2016. https://doi.org/10.1109/tsg.2016.2638462 - G. E. Asimakopoulou, A. L. Dimeas, and N. D. Hatziargyriou, “Leader- follower strategies for energy management of multi-microgrids”, IEEE Transactions on Smart Grid, vol. 4, no. 4, pp. 1909–1916, 2013. https://doi.org/10.1109/tsg.2013.2256941
- Z.Wang, B.Chen, J.Wang, M.M.Begovic,and C.Chen, “Coordinated energy management of networked microgrids in distribution systems”, IEEE Transactions on Smart Grid, vol. 6, no. 1, pp. 45–53, 2015. https://doi.org/10.1109/tsg.2014.2329846
- J. Matamoros, D. Gregoratti, and M. Dohler, “Microgrids energy trading in islanding mode”, 2012 IEEE 3rd International Conference on Smart Grid Communications, SmartGridComm 2012, pp. 49–54, 2012. https://doi.org/10.1109/smartgridcomm.2012.6485958
- D. Gregoratti and J. Matamoros, “Distributed Energy Trad-ing: The Multiple-Microgrid Case”, IEEE Transactions on In-dustrial Electronics, vol. 62, no. 4, pp. 2551–2559, 2015. https://doi.org/10.1109/tie.2014.2352592
- H. Wang, “Economic Mechanisms for Integrating Smart Grid Tech-nologies into Power System”, PhD thesis, The Chinese University of Hong Kong, 2016.
- H. Wang and J. Huang, “Bargaining-based energy trading mar-ket for interconnected microgrids”, IEEE International Confer-ence on Communications, vol. 2015–Septe, pp. 776–781, 2015. https://doi.org/10.1109/icc.2015.7248416
- H. Wang and J. Huang, “Cooperative Planning of Renew-able Generations for Interconnected Microgrids”, IEEE Trans-actions on Smart Grid, vol. 7, no. 5, pp. 2486–2496, 2016. https://doi.org/10.1109/tsg.2016.2552642
- A. Werth, N. Kitamura, I. Matsumoto, and K. Tanaka, “Evaluation of centralized and distributed microgrid topologies and comparison to Open Energy Systems (OES)”, 15th International Conference on Environment and Electrical Engineering (EEEIC), pp. 492–497, IEEE, June 2015. https://doi.org/10.1109/eeeic.2015.7165211
- L. Zhang, Z. Li, C. Wu, “Randomized Auction Design for Electricity Markets between Grids and Microgrids”, SIGMET-RICS ’14 The 2014 ACM International Conference on Mea-surement and Modeling of Computer Systems, pp. 99–110. https://doi.org/10.1145/2591971.2591999
- W. Saad, Z. Han, and H. V. Poor, “Coalitional game the-ory for cooperative micro-grid distribution networks”, IEEE In-ternational Conference on Communications, pp. 6–10, 2011. https://doi.org/10.1109/iccw.2011.5963577
- H. S. V. S. Kumar Nunna and S. Doolla, “Energy management in microgrids using demand response and distributed storage – A multia-gent approach”, IEEE Transactions on Power Delivery, vol. 28, no. 2, pp. 939–947, 2013. https://doi.org/10.1109/tpwrd.2013.2239665
- A. Dimeas and N. Hatziargyriou, “A multiagent sys-tem for microgrids”, in IEEE Power Engineering Society General Meeting, 2004., vol. 2, pp. 55–58, IEEE, 2004. https://doi.org/10.1109/pes.2004.1372752
- A. Amato, B. D. Martino, M. Scialdone, and S. Venticinque, “A Negotiation Solution for Smart Grid Using a Fully Decentralized, P2P Approach”, 2015 Ninth International Conference on Complex, Intelligent, and Software Intensive Systems, pp. 527–534, 2015. https://doi.org/10.1109/cisis.2015.78
- J. Lagorse, D. Paire, and A. Miraoui, “A multi-agent sys-tem for energy management of distributed power sources”, Renewable Energy, vol. 35, pp. 174–182, jan 2010. https://doi.org/10.1016/j.renene.2009.02.029
- H. Algarvio and F. Lopes ,“Multi-agent Retail Energy Markets : Bi-lateral Contracting and Coalitions of End-use Customers”, 12th In-ternational Conference on the European Energy Market (EEM), p. 5, 2015. https://doi.org/10.1109/eem.2015.7216750
- S. Nakamoto, “Bitcoin: A Peer-to-Peer Electronic Cash System”, Consulted, pp. 1–9, 2008. https://bitcoin.org/bitcoin.pdf
- M. Swan, ”Blockchain: Blueprint for a New Economy”, O’Reilly, 2015.
- Consensys, “GRID+ Welcome to the Future of Energy”, 2017.
- J. Lilic, “Building the Decentralized Utility on the Ethereum Blockchain”, in EcoSummit Berlin, 2016.
- M. Mihaylov, S. Jurado, N. Avellana, K. Van Moffaert, I. M. De Abril, and A. Nowe, “NRGcoin: Virtual currency for trading of renewable energy in smart grids”, International Conference on the European En-ergy Market, EEM, 2014. https://doi.org/10.1109/eem.2014.6861213
- E. Labs, “White Paper: Decentralized Autonomous Energy System”, 2017.