
Long-term Traffic Flow Forecasting Based on an Artificial Neural Network
Volume 4, Issue 4, Page No 323-327, 2019
Author’s Name: Alimam Mohammed Karim1,a), Alimam Mohammed Abdellah1, Seghuiouer Hamid2
View Affiliations
1Abdelmalek Essaˆadi University, Avenue Khenifra, T´etouan 93000, Morocco
2E´cole nationale des sciences applique´es de Te´touan, ENSA de Avenue de la Palestine Mhanech I. Te´touan, Morocco
a)Author to whom correspondence should be addressed. E-mail: karim.alimam@gmail.com
Adv. Sci. Technol. Eng. Syst. J. 4(4), 323-327 (2019); ![]() DOI: 10.25046/aj040441
DOI: 10.25046/aj040441
Keywords: Traffic forecasting, Neural network, Supervised learning algorithm, Highway

Export Citations
There is no doubt that a good knowledge of traffic demand has a direct impact on improving traffic management. Road traffic is strongly correlated with many factors such as day of week, time of day, season and holidays which make it suitable for prediction. In this paper, we develop a neural network model for hourly traffic prediction that makes full use of these temporal characteristics. The proposed algorithm is tested on a real-world case, and the experiment results is presented to evaluate its accuracy.
Received: 01 June 2019, Accepted: 20 July 2019, Published Online: 19 August 2019
1. Introduction
Accurate traffic volume prediction plays a significant role in traffic management and control. Estimate the number of vehicles passing per unit time can help traffic managers make the right decisions. Up to now a variety of traffic flow prediction algorithms have been proposed. These methods can be arranged into two categories: parametric approach and non-parametric approach.
Since the early 1980s, a wide range of parametric techniques have been studied such as historical average algorithms, smoothing techniques, linear regression, filtering techniques [1], and autoregressive integrated moving average (ARIMA)[2] family. Later on, researchers began to explore the potential of non-parametric techniques in traffic forecasting, including neural networks [3, 4, 5, 6, 7], support vector machines [8, 9], k-nearest neighbor [10, 11], etc. These methods have gained more attention compared to parametric techniques considering that they can capture the stochastic and nonlinearity of the traffic flow. They are flexible in their use and are generally quite robust.
The rest of the paper is structured as follows. Following this introductory section, a description of the proposed methodology is provided. The dataset for the numerical experiments is introduced in section 3 along with the results and performance evaluation. Finally, concluding remarks are stated in section 4.
2. Methodology
In this section, a description of the Artificial Neural Network structure is presented. Artificial Neural Networks (ANNs) are one of the recent methods employed for traffic forecasting. They have the ability to approximate almost any function due to their properties of self-learning and self-adaptive capabilities.
2.1. Prediction logic with artificial neural network
A neural network consists of a set of interconnected processing elements, called neurons, which are arranged in a series of layers: an input layer, one or more hidden layers and an output layer.
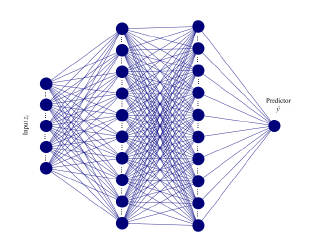 Figure 1: Architecture of a neural network prediction model
There is no connection between neurons in the same layer. However, each neuron in a layer is fully connected to all neurons in the next layer. Those connections are unidirectional: information from the inputs pass through the hidden units to eventually reach the output units. This type of architecture is called feedforward neural network (Fig. 1).
Neural networks are able to perform different categories of tasks, including regression. ANN can be trained to model the relationship between a number of input variables and a set of continuous results (target variables).
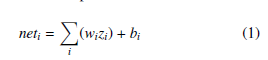
The inputs zi reach the neuron through connection links, each with an associated weight wi. The higher the value of a weight, the stronger the intensity of the incoming signal. When the signals are received, a weighted sum of the inputs plus a bias b, called the net input, is calculated:
 The output is then determined by applying a transfer function f to the net input. The transfer function can be any differentiable non-linear function.
![]() This output will serve as input to other neurons in the next layer and so on. When the entire network has been executed, the neurons in the output layer become the outputs of the entire network (predicted values).
This output will serve as input to other neurons in the next layer and so on. When the entire network has been executed, the neurons in the output layer become the outputs of the entire network (predicted values).
3. Experiments
In this section, the real-world data used in this study is described and the forecasting model along with the results are presented. The forecasting model is implemented using Python and Keras.
3.1. Data preparation and description
Data on the volume of traffic on hourly basis has been collected from the Melloussa Toll plaza. This traffic represents the number of vehicles passing through the system during each hour of the day. The Toll Lane Controller collects data from the lanes and transmits it to a server where all transaction data are stored.
The Melloussa Toll plaza is one of the major toll highways in Tangier. It is located on a North-South motorway axis that leads directly to The Port of Tangier, Africa’s biggest port, allowing the toll plaza to become an important transit point between Morocco and the European continent, with a throughput volume that could approach 900 vehicles per hour during summer peak periods.
Collected data for experiments spans for two years ranging from 2017/01 to 2018/12. The first 80% of the observations was selected to train the forecasting model, while the remaining 20% was treated as the testing dataset.
Missing and abnormal data are almost inevitable in practice. Their presence can affect the quality of data and can lead to incorrect results and conclusions. Therefore, missing and abnormal data were removed and repaired by estimating values from historical data.
To fit into the ANN model, the data was arranged in the following format (see Tab. I):
| Year | Month | Day | Hours | Holiday | Traffic |
| 2017 | January | Sunday | 1 | Yes | 61 |
| 2017 | January | Sunday | 2 | Yes | 32 |
| 2017 | January | Sunday | 3 | Yes | 17 |
| 2017 | January | Sunday | 4 | Yes | 16 |
| 2017 | January | Sunday | 5 | Yes | 33 |
| … | … | … | … | … | … |
| … | … | … | … | … | … |
| 2018 | December | Monday | 23 | No | 83 |
| 2018 | December | Monday | 24 | No | 47 |
Table 1: Data structure used in the experiment
Before being able to model a problem with a machine learning algorithm, it is often necessary to perform a number of transformations on the data, so that the problem can be easily understood and interpreted by the machine learning algorithm.
Therefore, the data, including Hours, Day, Month, and Holiday were converted into binary variables (for example, “Day of Week” feature 2 is transformed to 001000).
3.2. The forecasting model
Artificial neural networks are characterized by two main parameters: the number of hidden layers and the number of neurons per hidden layer.
There is no general method for determining the appropriate values of these parameters. Thus, it is usually necessary to proceed by trial and error in order to find the optimal structure.
In our approach, a three-layer ANN with 100 hidden neurons in each layer was found to achieve the lowest error rates. ReLU(Rectified Linear Unit) was used as the activation function for the hidden layers while the linear function was used for the output layer.
3.3. Model Evaluation
The mean square error (MSE) was used as the indicator of the accuracy of the prediction method, defined as:
 Where,
- N is the number of data points
- fi is the predicted value (the network’s output)
- yi is the target value for the ith observation
3.4. Forecasting results
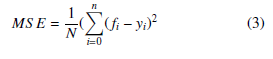
As we mentioned earlier, the traffic flow data is divided into two parts: the first part is the training sample and the second part is the testing sample. The training data is used to identify the pattern of data and the test data is used for checking the performance. The forecasting results of the testing data set are shown in Fig. 2.
The error is quantified using Mean Square Error (MSE) and the values obtained for each iteration are shown in Fig.2(b).
 Figure 2: The forecasting results
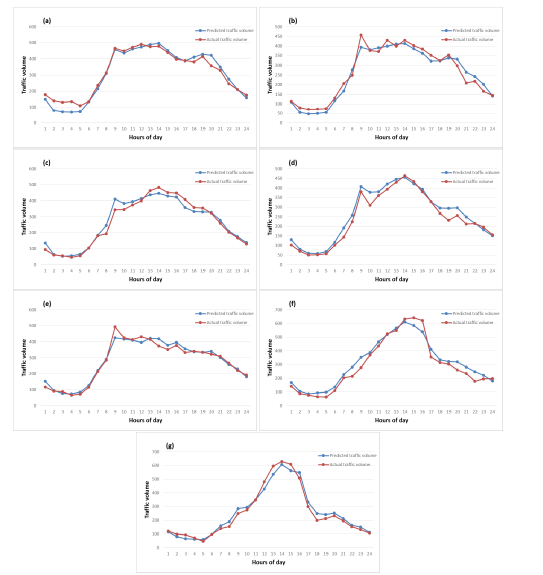 Figure 3: The hourly traffic volumes of different days in a week: (a) Monday, (b) Tuesday, (c) Wednesday, (d) Thursday, (e) Friday, (f) Saturday, and (g) Sunday
From Fig. 2(a), it can be seen that the line graph is divided into two parts: the first part is the one with the highest traffic volume and varying traffic patterns, which corresponds to the month of August. The second part presents the remaining months of the year, which shows a relatively stable traffic patterns. The model perform reasonably well in predicting the second part compared to the first one. This could be explained by the following reasons:
- During this time period, the variations of traffic flow are high. Traffic patterns are not the same comparing day with day, which makes it hard to capture pattern similarities.
- The shifting nature of Eid festivals had a direct impact on the traffic flow pattern. In this particular period, Eid Al-Adha, one of the most important festivities of the year, coincides with the end of the summer holidays and the start of the school year, which help increase the variability in traffic demand.
- The proposed method is trained to learn the behavior and predict future outcomes using historical data. Therefore, a larger training set provides better results. Here in this study, we only have August of 2017 as historical data.
In order to better underline the predictive accuracy of the ANN model, a comparison of estimated and actual traffic values for different times of the day and week is presented in Fig. 3. We can observe that the ANN model performs well in capturing the data patterns on hourly and daily basis. The same results has been obtained for the next year (see Fig. 4).
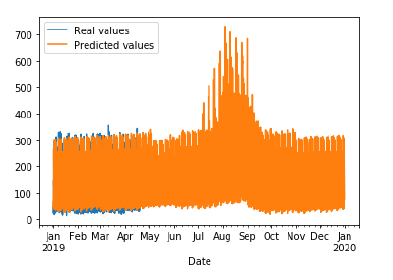 Figure 4: Prediction results of the hourly traffic volume for the first four months of 2019.
On a seasonal basis, the proposed model was able to accurately capture the behaviour of traffic over time as can be seen in Fig. 5. Traffic tends to pick up heavily during the summer months compared to other time of the year.
4. Conclusion
By visually exploring the traffic data, we observe that traffic is affected by a number of temporal features. In this paper, we developed an ANN algorithm for the prediction of hourly traffic volume that model the relationship between the traffic and these temporal features. The suggested model is tested on real world traffic volume, collected from The Melloussa toll plaza and the results showed that the method was able to identify the changes in traffic pattern at different period of time.
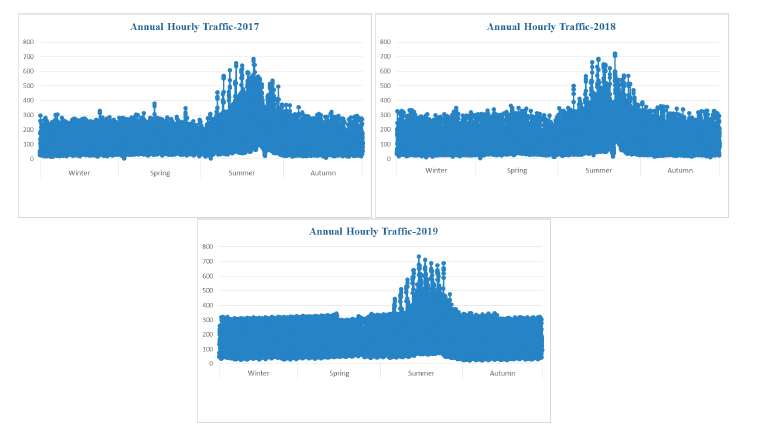 Figure 5: Seasonal variation in traffic flows Special events are also one of the factors that can greatly affect traffic pattern. Adding this feature to the model is worth studying.
- Okatuni, I., and Y. J. Stephanedes.(1984) “Dynamic Prediction of Traffic Volume Through Kalman Filtering Theory,” Transportation Research Part B, Vol. 18, No. 1, pp. 1–11.
- M. Levin and Y. D. Tsao. , “On forecasting freeway occupancies and volumes (Abridgment),” Transportation Research Record, No. 722, 1980, pp. 47-49.
- Centiner, B. G., Sari, M., and Borat, O. (2010). “A neural network based traffic-flow prediction model,” Mathematical and Computa-tional Applications, 15, 269-278.
- Licheng Qu, Wei Li, Wenjing Li, Dongfang Ma, Yinhai Wang (2018). “Daily long-term traffic flow forecasting based on a deep neural net-work,” Expert Syst. Appl. 121: 304-312.
- Kranti Kumar, M.Parida, V.K.Katiyar. “Short term traffic flow prediction for a non urban highway using artificial neural net-work,”Procedia – Social and Behavioral Sciences, 2013, Vol. 104. P. 755- 764.
- M.S.A Siddiquee, S. Hoque. “Predicting the daily traffic volume from hourly traffic volume using Artificial Neural Network,” 2017.
- Melinda Barabas, Georgeta Boanea, Andrei B. Rus, Virgil Dobrota, Jordi Domingo-Pascual. “Evaluation of network traffic prediction based on neural networks with multi-task learning and multiresolu-tion decomposition,” 2011 IEEE 7th International Conference on Intelligent Computer Communication and Processing.
- Sapankevych, N., Sankar, R., et al, 2009. “Time series prediction using support vector machines: a survey. Comput,” Intell. Mag., IEEE 4 (2), 24–38.
- Amanda Yan Lin, Mengcheng Zhang. “Highway Tollgates Travel Time and Volume Predictions using Support Vector Regression with
- Zheng, Z., Su, D., 2014. “Short-term traffic volume forecasting: a k-nearest neighbor approach enhanced by constrained linearly sewing principle component algorithm,” Transport. Res. Part C : Emerg. Technol, 43, 143–157.
- F. Habtemichael, and M. Cetin. “Short-Term Traffic Flow Rate Fore-casting Based on Identifying Similar Traffic Patterns,” Transporta-tion Research Part C, 66, pp. 61-78, 2016.
- Van Der Voort, M., M. Dougherty, and S. Watson. “Combining Ko-honen Maps with ARIMA Time-Series Models to Forecast Traffic Flow,” Transportation Research Part C, Vol. 4, No. 5, 1996, pp. 307–318.
- Ahmed, M. S., and A. R. Cook. “Analysis of Freeway Traffic Time-Series Data by Using Box–Jenkins Techniques,” Transportation Research Record 772, TRB, National Research Council, Washington, D. C., 1979, pp. 1–9.
- Williams, B. M. “Multivariate Vehicular Traffic Flow Predic-tion: Evaluation of ARIMAX Modeling,” Transportation Research Record: Journal of the Transportation Research Board, No. 1776, TRB, National Research Council, Washington, D.C., 2001, pp. 194–200.
- Mario Cools, Elke Moons, and Geert Wets. “Investigating the Vari-ability in Daily Traffic Counts Through Use of ARIMAX and SARI-MAX Models,” Transportation Research Board of the National Academies, No. 2136, Washington, D.C., 2009.
- Williams, B. M., and L. A. Hoel. “Modeling and Forecasting Ve-hicular Traffic Flow as a Seasonal ARIMA Process: A Theoretical Basis and Empirical Results,” Journal of Transportation Engineering (ASCE), Vol. 129, No. 6, 2003, pp. 664–672.
- Blaz Ka ˇ ziˇ c, Dunja Mladeni ˇ c and Alja ́ z Ko ˇ smerlj (2015). “Traffic Flow Prediction from Loop Counter Sensor Data using Machine Learning Methods,” Proceedings of the 1st International Conference on Vehicle Technology and Intelligent Transport Systems (VEHITS-2015), pages 119-127.