
DSTATCOM-Fuel Cell System on Radial Low-voltage Distribution Network for Mitigating Voltage Rise Caused by High Penetration of Photovoltaic Systems
Volume 4, Issue 4, Page No 285-291, 2019
Author’s Name: Dylon Hao Cheng Lam, Jianhui Wonga), Yun Seng Lim, Jimmy Chin Yong Hee
View Affiliations
Department of Electrical and Electronic Engineering, Universiti Tunku Abdul Rahman, Selangor, Malaysia
a)Author to whom correspondence should be addressed. E-mail: wongjh@utar.edu.my
Adv. Sci. Technol. Eng. Syst. J. 4(4), 285-291 (2019); ![]() DOI: 10.25046/aj040436
DOI: 10.25046/aj040436
Keywords: Grid-connected, DSTATCOM, Fuel cell, Distribution Network, Voltage rise

Export Citations
The Malaysian government has recently announced to increase the share of renewable energy generation from 2% to 20% of the total electricity consumption by year 2030. However, integrating a significant level of renewable energy sources on the distribution network without proper coordination will cause adverse effects that leads to unnecessary operation costs to the stakeholders. Various solutions including energy storage system are proven to be an effective way to overcome the issues caused by the integration of renewable energy sources. However, energy storage system using batteries have limitations such as limited life cycle and environmental hazards. As such, alternative source such as fuel cell which is well known for its zero pollutant can be considered. In this paper, a distributed static synchronous compensator integrated with a hydrogen system (DSTATCOM-Fuel cell) is proposed. The hydrogen system consists of fuel cell and electrolyzer to perform power exchange within the grid for regulating the voltage magnitude at 1 p.u. Various case studies have been conducted to validate the efficacy of this proposed combination and the results have shown that the DSTATCOM-Fuel cell can effectively mitigates the voltage rise up to 12.3% while maintaining high penetration of the photovoltaic systems.
Received: 31 May 2019, Accepted: 27 July 2019, Published Online: 07 August 2019
1. Introduction
This paper is an extension of work originally presented in the International Conference on Smart Grid and Clean Energy 2018 [1]. Malaysia is expected to receive significant growth of the grid-connected renewable energy sources as the government has recently set a new target to commit on increasing the renewable energy generation from the current 2% to 20% of the total electricity consumption by year 2030 [2]. However, the growth of renewable energy sources on the electrical networks without proper coordination can create technical challenges that lead to the malfunction of power electronic devices, reduction of network efficiency, and improper operation of power protection system which gives high operating cost impact to the stakeholders. Curtailing and limits the amounts of grid-connected renewable energy have always been applied in order to avoid the deterioration of electrical power quality [3] despite these measures can greatly reduce the generation of clean energy and affect the commitment to increase the share of renewable energy generation [4]. Many solutions have been research, and realized that integrating large-scaled energy storage system by manipulating the real and reactive power exchange within the system can be used to regulate the network voltage [5–9]. Besides, energy storage system integrated with STATCOM are used to enhance the transient stability [10–14], improve voltage sags [15], smoothen wind farm power output and terminal voltage by incorporates real and reactive power control ability [16–18]. Although these combinations have proven useful, however, batteries have few disadvantages such as limited life cycle, voltage and current limitation and environmental hazards [19–21]. Therefore, more exploration on new alternative solutions and their corresponding control strategies become obligatory. Unlike the other batteries, fuel cells is an environmental friendly and well known for its zero pollutant, high efficiency, modularity, high power and reliable [22] which has the capability of high charge and discharge cycles. In this paper, a distributed static synchronous compensator integrated with a hydrogen system (DSTATCOM-Fuel cell) is proposed for active and reactive power compensation. In this combination, the DSTATCOM regulates reactive power output to maintain the voltage at 1 p.u. with the hydrogen system operates through the discharging and charging of the fuel cell and electrolyzer respectively to regulate active power based on the PV power output and voltage magnitude. Various case studies are conducted to validate the performance of the proposed solution to mitigate the voltage rise issues while allowing high penetration from grid-connected PV systems.
2. Typical Malaysian Low-voltage Distribution Network in Radial Topology
The paper begins with a preliminary study to investigate the impact on system voltage with the integration of grid-connected PV systems on the radial distribution network. It is followed by an efficacy analysis using MATLAB Simulink to validate the performance of the proposed DSTATCOM-Fuel cell system to regulate the system voltage at 1 p.u while maximize the capacity of the grid-connected PV systems on the distribution network.
2.1. Modeling Electrical Network
A typical Malaysian low-voltage distribution network for small sub-urban area as shown in Figure 1. This network can be categorized into three sections according to its voltage level; (i) 132 kV incoming supply, (ii) 33 kV distribution substations, (iii) 11 kV distribution substations. The 132 kV incoming supply is the sub-transmission network of the national grid, the voltage is then stepped down to 33 kV by the 132/33 kV power transformers installed in the 33 kV distribution substations. The 33 kV is further stepped down to 11 kV using the 33/11 kV power transformer to a suitable voltage level for utilization. In this network, feeder 4 being the longest feeder will be modelled and the proposed DSTATCOM-Fuel cell system is integrated on feeder 4 to validate the efficacy.
There are 11 distribution substations across the radial feeder 4 with each of them are rated at 11/0.4 kV. The distance between each substation is indicated in Figure 1. The primary sides of the 11/0.4 kV transformers are labelled as 1, 2, 3 … and 11, while the secondary sides of the 11/0.4 kV transformers are labelled as 1a, 2a, 3a … and 11a. Table 1 and Table 2 show the technical specifications of the power transformer and conductor respectively. The locations of the distribution substations, the typical load characteristics and photovoltaic system power output were collected from the utility company.
A three-phase PV system is placed at the terminals 1a, 2a, and 3a in case 1 and 9a, 10a, and 11a in case 2 to investigate the impact of PV systems towards voltage rise on the network. Equation 1 shows sizing of the PV system is based on the penetration levels as follows:
![]() where,
where,
is the penetration level of the PV system (%)
is the total PV energy yield for the day (kWh)
is the daily energy consumption at the load (kWh)
Based on the PV power output profile and load profile used in this study, it is determined that for 100% PV penetration level, the PV system should be sized at 500 kW. Thus, the PV system capacity for 60%, 70%, 80%, and 90% PV penetration are 300 kW, 350 kW, 400 kW, and 450 kW respectively.
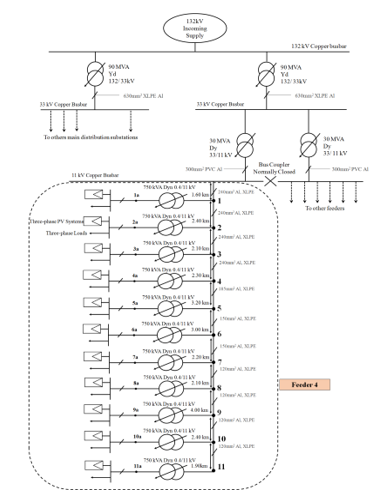 Figure 1: Typical Malaysian low-voltage distribution network in a sub-urban area.
Table 1: Technical Specification of the oil-immersed power transformers
| Descriptions |
Voltage Level (kV) |
Rated Power (MVA) |
Vector Group |
Percent Reactance (%X) |
| Three-phase power transformers | 132/33 | 90.00 | Yd11 | 13.50% |
| 33/ 11 | 30.00 | Dyn11 | 10.00% | |
| 11/ 0.4 | 0.75 | DYn11 | 4.75% |
Table 2: Technical Specification of the conductors
| Voltage Level (kV) | Cross-sectional Area (mm2) | Material | Insulator |
R (Ω/km) |
XL (Ω/km) |
| 0.4 | 300 | Al | PVC | 0.1300 | 0.0720 |
| 11.0 | 120 | Al | XLPE | 0.2990 | 0.0873 |
| 150 | Al | XLPE | 0.2645 | 0.1603 | |
| 185 | Cu | PILC | 0.1950 | 0.0829 | |
| 240 | Al | XLPE | 0.1610 | 0.1524 | |
| 33.0 | 630 | Al | XLPE | 0.0627 | 0.1070 |
2.2. Modeling DSTATCOM-Fuel Cell System
The proposed DSTATCOM-Fuel cell system is shown in Figure 2. The system consists of a DSTATCOM with an integrated hydrogen system. The hydrogen system consists of a fuel cell, an electrolyzer, and a hydrogen storage tank. The hydrogen system is connected to the DC capacitor of the DSTATCOM through a boost converter which regulates the DC voltage from the hydrogen system to the desired level. The DSTATCOM consists of a DC capacitor, a three-phase pulse-width-modulated voltage source converter (VSC), and a coupling transformer. The coupling transformer connects the VSC to the network and functions to provide galvanic isolation and voltage regulation at the point of common coupling (PCC). The DSTATCOM, fuel cell, and electrolyzer are rated at 500 kVAr, 500 kW, and 500 kW respectively to match the PV system capacity at 100% PV penetration.
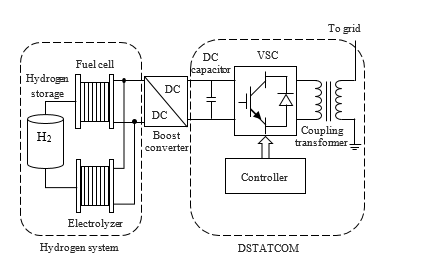 Figure 2: Schematic diagram of DSTATCOM-Fuel cell
The proton membrane exchange fuel cell (PEMFC) is used for the hydrogen system as it has a low operating temperature of 60-80°C, a high electrical efficiency range of 40-50%, a fast start up time, and high power density which makes it suitable for use in distribution networks [23,24]. A 500 kW PEMFC is modelled based on the NedStack PS6 datasheet. The parameters of the 500 kW PEMFC stack is shown in Table 3. The voltage-current (V-I) and power-current (P-I) curve of the fuel cell stack is shown in Figure 3.
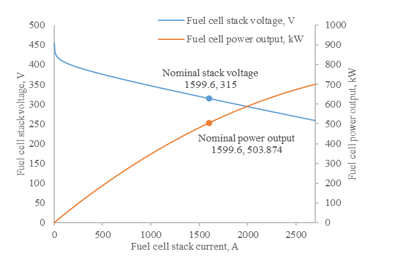 Figure 3: V-I curve and P-I curve of the fuel cell stack.
Table 3: Technical specification of the PEMFC stack
| Rated capacity | 504 kW |
| Nominal voltage | 315 V |
| Nominal current | 1333 A |
| Number of cells connected in series | 455 |
| Number of strings connected in parallel | 12 |
| Total number of cells in the fuel cell stack | 5460 |
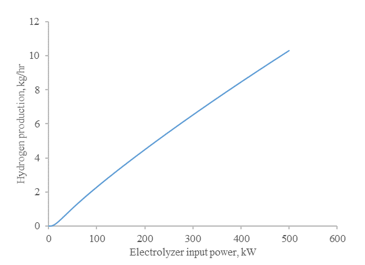 Figure 4: Hydrogen production of electrolyzer stack.
An alkaline electrolyzer stack is modelled based on the Photovoltaik, Elecktrolyse, Brennstoffzelle Und Systemtechnik (PHOEBUS) plant installed at Julich, Germany as reported in [25]. In order to create a 500 kW electrolyzer system, 19 electrolyzer stacks each rated at 26 kW are modelled and connected in parallel. The voltage-current relationship and hydrogen production of the electrolyzer system are modelled as described in [26,27]. The hydrogen produced by the electrolyzer is stored into a hydrogen storage tank without compression. The hydrogen storage tank capacity is 30 kg of hydrogen. The hydrogen production of the electrolyzer model is shown in Figure 4.
2.3. Control Strategies for Voltage Regulation
Figure 5 shows the control scheme for the DSTATCOM-Fuel cell. The objective of the controller is to mitigate voltage rise issue on the network by active and reactive power compensation. The voltage at the PCC, VPCC, is measured and DSTATCOM performs reactive power compensation to regulate the voltage at 1 p.u. The voltage rise on the network occurs mainly due to high PV penetration. Hence, controller will initiate the hydrogen system charging operation when the PV power output, PPV, is higher than the load consumption, Pload and the hydrogen tank level is less than 100%. If PPV is less than Pload, the control will check if VPCC is below the statutory limit of 1.1 p.u. If yes, the control will initiate the hydrogen system discharging operation if the hydrogen tank level is more than 20%. A minimum threshold of 20% for the hydrogen tank level is set to ensure a safe operation of the fuel cell. If VPCC exceeds the 1.1 p.u. limit, the control will stop the charging and discharging of the hydrogen system and only reactive power compensation will be used to regulate the voltage.
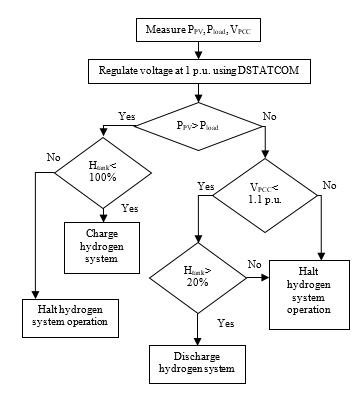 Figure 5: Flow chart of the DSTATCOM-Fuel cell controller.
3. Simulation Results
3.1. Impact of PV system allocation on voltage rise severity:
In this case study, the impact of PV system allocation on the system voltage is studied. Two cases are considered; i) Case 1 where a PV system is connected at terminals 1a, 2a, and 3a respectively, ii) Case 2 where a PV system is connected at terminals 9a, 10a, and 11a respectively. The PV power output profile used in this case study is the average hourly PV power output measured at Selangor, Malaysia during the month of April, 2018. The network is simulated for a period of 24 hours to determine the maximum voltage rise that occur within one full day.
Figure 6 shows the voltage magnitude of the load terminals 1a, 2a, and 3a for case 1. Figure 7 shows the voltage magnitude of the load terminals 9a, 10a, and 11a for case 2. In both cases, the maximum voltage is measured when there is 0%, 60%, 70%, 80%, 90%, and 100% PV. The voltage magnitudes shown in these two figures are the maximum voltage measured within the 24-hour period.
In case 1, the maximum voltage at terminal 1a, 2a, and 3a violates the 1.1 p.u. statutory limit when PV penetration exceeds 70%, 80% and 90% respectively. The maximum voltages at 1a, 2a, and 3a when PV penetration is 100% are 1.12 p.u., 1,12 p.u. and 1.11 p.u. respectively. It is noticed that in this case, the voltage rise severity reduces at terminals further away from the 11 kV main substation.
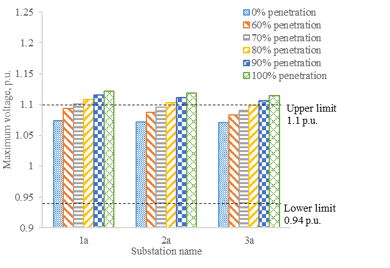 Figure 6: Maximum voltage magnitude of the load terminals when the PV system is connected at the terminals 1a, 2a, and 3a.
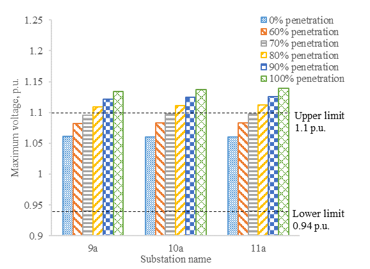 Figure 7: Maximum voltage magnitude of the load terminals when the PV system is connected at the terminals 9a, 10a, and 11a.
In case 2, the maximum voltage at terminal 9a, 10a, and 11a violates the 1.1 p.u. statutory limit when PV penetration exceeds 80%. The maximum voltages at 9a, 10a, and 11a when PV penetration is 100% are 1.13 p.u., 1.14 p.u., and 1.14 p.u. respectively. It is noticed that in this case, the voltage rise severity increases at terminals further away from the 11 kV main substation.
Comparing case 1 and case 2, it is noticed that when several PV systems are placed near the 11 kV substation, the voltage rise impact is greatest at the terminal located nearest to the main substation. Conversely, when multiple PV systems are placed at the end of the load terminals, the voltage rise is most severe at the terminal located furthest from the main substation.
Overall, it is observed that the voltage rise is more severe when multiple PV systems are placed at terminals furthest to the 11 kV main substation. The voltage increase as PV penetration increases is also more significant when the PV system is connected to the last three terminals compared to the first three terminals.
3.2. Efficacy Analysis for DSTATCOM-Fuel Cell System:
In order to determine the effectiveness of the proposed system for mitigating voltage rise caused by PV systems, a DSTATCOM-Fuel cell system is connected to terminals 1a, 2a, and 3a in case 1 and to terminals 9a, 10a, and 11a in case 2.
Figure 8 and Figure 9 show the comparison of the voltage rise for both cases when the PV system penetration level is 100%. It is observed that in both cases, the maximum voltage is maintained at 1 p.u when DSTATCOM-Fuel cell is connected. The regulation of voltage at the terminals with a connected PV system also affects the voltage at the other terminals. This effect is more significant in case 2 where the voltage at the neighboring terminals is reduced by as much as 2%. Overall, by using DSTATCOM-Fuel cell voltage rise can be reduced by as much as 10.7% in case 1 and 12.3% in case 2.
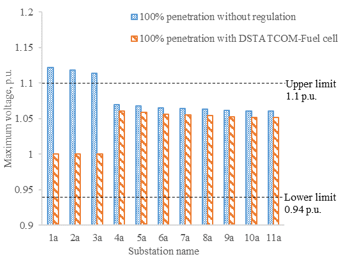 Figure 8: Comparison of voltage rise at 100% with and without regulation by DSTATCOM-Fuel cell in case 1.
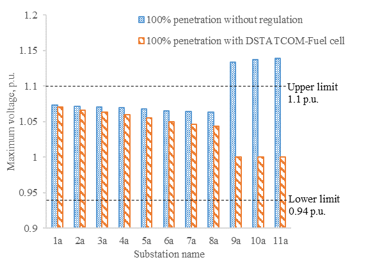 Figure 9: Comparison of voltage rise at 100% with and without regulation by DSTATCOM-Fuel cell in case 2.
Figure 10 shows the regulated power output at terminal 11a in case 3 after active power compensation by the DSTATCOM-Fuel cell system relative to the PV power output and load consumption. In order to mitigate voltage rise issues caused by reverse power flow, a combination of active and reactive power compensation is used depending on the PV power output and hydrogen tank level. When the PV power output is less than the load consumption, the hydrogen system in the DSTATCOM-Fuel cell will supply active power to the network to match the load consumption if the voltage does not exceed the statutory limit of 1.1 p.u. and the hydrogen tank level is not less than 20%. When the PV power output exceeds the load consumption, the hydrogen system charging operation is initiated if the hydrogen tank level is not full and the excess power is absorbed by the hydrogen system and converted to hydrogen.
It is observed that from 3:45:00 to 7:15:00 and 21:30:00 to 0:00:00, the regulated power is 0 kW. This is due to the hydrogen tank level being below 20%. Hence, the hydrogen system does not carry out the discharging operation during this period.
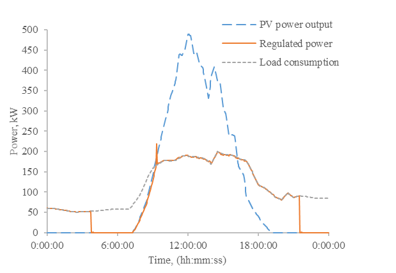 Figure 10: Regulated power output relative to PV power output and load consumption at terminal 11a in case 2.
Figure 11 shows the voltage levels throughout the day at terminal 11a in case 3. It is observed that there is significant voltage rise up to 1.14 p.u. which coincides with the peak output of the PV system. When the DSTATCOM-Fuel cell system is connected, the voltage is regulated at 1 p.u. throughout the day.
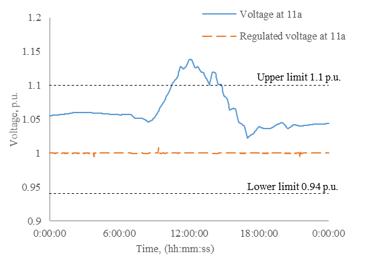 Figure 11: Regulated and unregulated voltage using DSTATCOM-Fuel cell at terminal 11a when a photovoltaic system generates 100% of the total consumed power.
Figure 12 shows the active power compensation by the fuel cell and electrolyzer and the reactive power compensation of the DSTATCOM. It is noticed that the DSTATCOM is constantly absorbing reactive power to reduce voltage level and regulated the voltage at 1 p.u. The hydrogen system charging and discharging operation depends on the PV power output. When the PV power output is high and exceeds the load consumption, the electrolyzer absorbs active power and converts it to hydrogen. When the PV power output is low and is less than the load consumption, the fuel cell supplies active power if the voltage magnitude is within the statutory limit of 1.1 p.u. It is noticed that from 3:45:00 to 7:15:00 and 21:30:00 to 0:00:00, the fuel cell does not supply any active power due to low hydrogen tank levels.
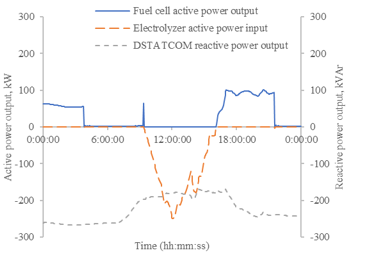 Figure 12: DSTATCOM-Fuel cell active and reactive power output at terminal 11a.
Figure 13 shows the hydrogen tank levels throughout the day. For this study, a starting level of 50%, which is 15 kg of hydrogen, has been assumed in this simulation. It is noticed that when the hydrogen tank level reaches 20%, the discharging operation of the system is turned off. Hence, only a minimal amount of hydrogen is consumed by the fuel cell to maintain the DC voltage in the DSTATCOM.
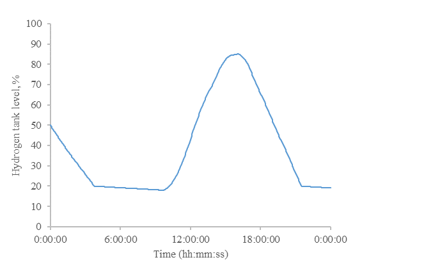 Figure 13: Hydrogen tank levels throughout the day.
4. Conclusion
Integrating large amount of renewable energy sources without suppressing the power quality always has been a challenge to the utility company. The voltage rise issues become severe when large amount of PV systems are installed across the end of a long feeder in a radial distribution network. This paper presented a DSTATCOM-Fuel cell system to perform power exchange within the grid for mitigating the voltage rise issues without curtailing the high penetration of PV systems. Excess power generated from the PV system will be converted into hydrogen and store in a hydrogen tank via an electrolyzer. In the event of high load consumption during low renewable energy generation, fuel cell will generate electricity using the hydrogen stored in the tank. Various case studies are conducted in this paper to validate the efficacy of the proposed DSTATCOM-Fuel cell system and the results have shown that this combination can mitigate the voltage rise issues up to 12.3%, maintaining the voltage at 1 p.u. while allowing high penetration of PV systems presence in the network.
Conflict of Interest
The authors declare no conflict of interest.
Acknowledgment
This work was supported by the Ministry of Higher Education (MOHE) Fundamental Research Grant Scheme (FRGS) under the grant number FRGS/1/2017/TK04/UTAR/02/2 and Universiti Tunku Abdul Rahman (UTAR) Research Fund.
- J. C. Y. Hee, J. Wong, Y. S. Lim, J. H. Tang, “Assessment on Various Allocations of Energy Storages Systems on Radial Distribution Network for Maximum PV Systems Penetration” in 2018 Int. Conf. Smart Grid Clean Energy Technol. ICSGCE, 2018. https://doi.org/10.1109/ICSGCE.2018.8556803.
- N. S. Eusoff, “Malaysia sets new goal of 20% clean energy generation by 2030” The Edge, 2018. https://www.theedgemarkets.com/article/malaysia-sets-new-goal-18-clean-energy-generation-2030.
- A. Shafiu, T. Bopp, I. Chilvers, G. Strbac, “Active management and protection of distribution networks with distributed generation” in IEEE Power Eng. Soc. Gen. Meet. 2004, 2004. https://doi.org/10.1109/PES.2004.1373011.
- L. Kane, G. Ault, “A review and analysis of renewable energy curtailment schemes and Principles of Access: Transitioning towards business as usual” Energy Policy, 72, 67–77, 2014. https://doi.org/10.1016/j.enpol.2014.04.010.
- T. Mahto, V. Mukherjee, “Energy storage systems for mitigating the variability of isolated hybrid power system” Renew. Sustain. Energy Rev., 51(Supplement C), 1564–1577, 2015. https://doi.org/10.1016/j.rser.2015.07.012.
- M. S. Ali, M. M. Haque, P. Wolfs, “A review of topological ordering based voltage rise mitigation methods for LV distribution networks with high levels of photovoltaic penetration” Renew. Sustain. Energy Rev., 103, 463–476, 2019. https://doi.org/10.1016/j.rser.2018.12.049.
- P. Ariyaratna, K. M. Muttaqi, D. Sutanto, “A novel control strategy to mitigate slow and fast fluctuations of the voltage profile at common coupling Point of rooftop solar PV unit with an integrated hybrid energy storage system” J. Energy Storage, 20, 409–417, 2018. https://doi.org/10.1016/j.est.2018.10.016.
- F. H. M. Rafi, M. J. Hossain, J. Lu, “Hierarchical controls selection based on PV penetrations for voltage rise mitigation in a LV distribution network” Int. J. Electr. Power Energy Syst., 81, 123–139, 2016. https://doi.org/10.1016/j.ijepes.2016.02.013.
- E. L. Ratnam, S. R. Weller, “Receding horizon optimization-based approaches to managing supply voltages and power flows in a distribution grid with battery storage co-located with solar PV” Appl. Energy, 210, 1017–1026, 2018. https://doi.org/10.1016/j.apenergy.2017.08.163.
- Z. Yang, C. Shen, L. Zhang, M. L. Crow, S. Atcitty, “Integration of a StatCom and battery energy storage” IEEE Trans. Power Syst., 16(2), 254–260, 2001. https://doi.org/10.1109/59.918295.
- M. A. Rahman, M. H. Shawon, S. K. Ghosh, S. K. Nath, “Transient stability enhancement of fuel cell system using D-STATCOM” in 2014 3rd Int. Conf. Dev. Renew. Energy Technol. ICDRET, 2014. https://doi.org/10.1109/ICDRET.2014.6861663.
- M. Stella, M. A. G. Ezra, A. Peer Fathima, C. Khang Jiunn, “Research on the efficacy of unified Statcom-Fuel cells in improving the transient stability of power systems” Int. J. Hydrog. Energy, 41(3), 1944–1957, 2016. https://doi.org/10.1016/j.ijhydene.2015.11.130.
- S. Morris, M. Ezra, Y.-S. Lim, “Multi-machine power transmission system stabilization using MPSO based neuro-fuzzy hybrid controller for STATCOM/BESS” Int. Rev. Electr. Eng., 7, 2012.
- M. A. Bhaskar, D. Sarathkumar, M. Anand, “Transient stability enhancement by using fuel cell as STATCOM” in 2014 Int. Conf. Electron. Commun. Syst. ICECS, 2014. https://doi.org/10.1109/ECS.2014.6892553.
- A. Hajizadeh, M. A. Golkar, “Control of hybrid fuel cell/energy storage distributed generation system against voltage sag” Int. J. Electr. Power Energy Syst., 32(5), 488–497, 2010. https://doi.org/10.1016/j.ijepes.2009.09.015.
- S. M. Muyeen, R. Takahashi, T. Murata, J. Tamura, Mohd. H. Ali, “Application of STATCOM/BESS for wind power smoothening and hydrogen generation” Electr. Power Syst. Res., 79(2), 365–373, 2009. https://doi.org/10.1016/j.epsr.2008.07.007.
- S. W. Mohod, M. V. Aware, “A STATCOM-Control Scheme for Grid Connected Wind Energy System for Power Quality Improvement” IEEE Syst. J., 4(3), 346–352, 2010. https://doi.org/10.1109/JSYST.2010.2052943.
- S. W. Mohod, S. M. Hatwar, M. V. Aware, “Grid Support with Variable Speed Wind Energy System and Battery Storage for Power Quality” Energy Procedia, 12, 1032–1041, 2011. https://doi.org/10.1016/j.egypro.2011.10.135.
- A. Lenka, A. Papachen, A. P. Fathima, “Three Area AGC of An Interconnected Power System with Superconducting Magnetic Energy Storage” Int. J. Ind. Electron. Electr. Eng., 2, 54–58, 2014.
- A. A. K. Arani, H. Karami, G. Gharehpetian, M. Akhavanhejazi, “Review of Flywheel Energy Storage Systems structures and applications in power systems and microgrids” Renew. Sustain. Energy Rev., 69, 2017. https://doi.org/10.1016/j.rser.2016.11.166.
- E. MacA. Gray, C. J. Webb, J. Andrews, B. Shabani, P. J. Tsai, S. L. I. Chan, “Hydrogen storage for off-grid power supply” Int. J. Hydrog. Energy, 36(1), 654–663, 2011. https://doi.org/10.1016/j.ijhydene.2010.09.051.
- M. Jouin, R. Gouriveau, D. Hissel, M.-C. Péra, N. Zerhouni, “Prognostics and Health Management of PEMFC – State of the art and remaining challenges” Int. J. Hydrog. Energy, 38(35), 15307–15317, 2013. https://doi.org/10.1016/j.ijhydene.2013.09.051.
- E. G. T. Services, Fuel Cell Handbook, Seventh Edition, 2004.
- H. R. Ellamla, I. Staffell, P. Bujlo, B. G. Pollet, S. Pasupathi, “Current status of fuel cell based combined heat and power systems for residential sector” J. Power Sources, 293(Supplement C), 312–328, 2015. https://doi.org/10.1016/j.jpowsour.2015.05.050.
- H. Barthels, W. A. Brocke, K. Bonhoff, H. G. Groehn, G. Heuts, M. Lennartz, H. Mai, J. Mergel, L. Schmid, P. Ritzenhoff, “Phoebus-Jülich: An autonomous energy supply system comprising photovoltaics, electrolytic hydrogen, fuel cell” Int. J. Hydrog. Energy, 23(4), 295–301, 1998. https://doi.org/10.1016/S0360-3199(97)00055-4.
- M. H. Nehrir, C. Wang, Modeling and Control of Fuel Cells: Distributed Generation Applications, John Wiley & Sons, 2009.
- Ø. Ulleberg, “Modeling of advanced alkaline electrolyzers: a system simulation approach” Int. J. Hydrog. Energy, 28(1), 21–33, 2003. https://doi.org/10.1016/S0360-3199(02)00033-2.