
A Novel Strategy For Prompt Small Cell Deployment In Heterogeneous Networks
Volume 4, Issue 4, Page No 265-270, 2019
Author’s Name: Dorathy Abonyia)
View Affiliations
Department of Electrical and Electronic Engineering, Enugu State University of Science and Technology, Nigeria
a)Author to whom correspondence should be addressed. E-mail: abonyi.dorathy@esut.edu.ng
Adv. Sci. Technol. Eng. Syst. J. 4(4), 265-270 (2019); ![]() DOI: 10.25046/aj040433
DOI: 10.25046/aj040433
Keywords: Heterogeneous networks, RSSI, Direction-of-arrival estimation

Export Citations
Popularity and a_ordability of smart phones and other data hungry devices add exponentially to the tra_c demand of existing cellular networks. Cell densification and small cell deployment over existing macrocell has been identified as an e_ective solution to high tra_c demand predicted for future wireless networks like 5G. Small cells are deployed over existing macrocells in a Heterogeneous network to o_oad tra_c, ensure balanced load and good quality of service in the network. To achieve the purpose of HetNet, small cells are deployed in locations of high user concentration. Operators are required to be able to identify these locations for optimum small cell deployment. Presently, this decision is based on long term tra_c data which create latency in small cell deployment especially in areas of unexpected hotspots. The work presented in this paper is a new strategy that can practically help operators to promptly identify locations for small cell deployment based on user cluster. This strategy involves a monitoring system that can be easily incorporated in a mobile cellular network base transceiver station (BTS) to monitor the coverage area and periodically identify positions for prompt and optimum small-cell deployment in HetNets. The monitoring system is a two element array system that uses RSS data to resolve DoA, range, user cluster and identify positions for small cell deployment. At any point in time, the network operator can visualize cluster locations relative to the base station and is able to identify hotspots. When small cells like micro-, pico-, or femto-cells are promptly deployed in areas of higher user concentration, high data rates and good quality of service in the network are maintained at all times. The network coverage area is divided into a series of azimuthal and range sectors, and users are located into the sectors where they belong. The strategy was simulated in MATLAB environment for WiFi networks with thirty users and results indicate 100% accurate DoA estimation and MAE in range estimation of 6m for a known environment. Optimum positions for small cell deployment based on user clusters were correctly determined. Simulation was validated with experiment and result indicate close relationship between experiment and simulation with MAE di_erence in range estimation of 1m.
Received: 27 May 2019, Accepted: 11 July 2019, Published Online: 08 August 2019
1. Introduction
The exponential growth in data traffic demand on cellular deployed within the existing macrocell and integrated as a networks and the promising solution offered by heteroge- heterogeneous network. These small cells are cheaper to neous network and small cell deployment has triggered a lot implement and site acquisition is also easier to get since of research interest in this area. It is obvious that homoge- even an existing electric pole or building roof is a potential neous networks involving macro- only cells are insufficient site. Deploying small cells within existing macrocell gives in solving the capacity requirement of the present and future rise to a big umbrella cell with a number of small cells, each networks like 5G. This is due to high cost of macrocell BTS positioned to serve a smaller coverage area within the big cell as shown in Figure 1.
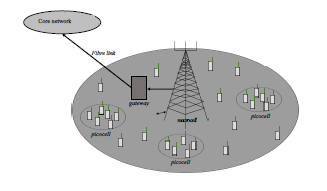 Figure 1: Heterogeneous network showing an umbrella macrocell with deployed picocells forming a 2-tier HetNet
Three main aim of heterogeneous network are (1) To offload traffic from macrocell, (2) Ensure balanced load in the network and (3) Ensure good quality of service to users. To achieve these objectives, small cells are deployed in a well targeted manager in most cases within locations of high user concentration (HUC). This therefore requires the network operators to be able to identify locations of HUC. Presently, these locations are determined using collected traffic data over a period of time and locations with high traffic demand is taken as HUC and position for small cell deployment. This approach does not give opportunity for prompt traffic offload, balanced load and good QoS using small cells especially in unexpected hotspot cases. This paper is an extension of the work originally presented in International Workshop on Computer Aided Modeling and Design of Communication Links and Networks (CAMAD) [1] which introduced the system based on simulation only. The work presented in this paper presents the application of the previous work as a strategy for prompt identification of optimum position for small cell deployment. Both simulation and experimental validation are presented to demonstrate the applicability of proposed strategy.
Strategies for small cell deployment can broadly be classified as Random Deployment Strategy (RDS) and Deterministic Deployment Strategy (DDS). RDS in most In RDS, small cells are randomly deployed within the macrocell while in DDS, the position for small cell deployment is determined based on some standing factors. Network performance for DDS and RDS was compared in [2] and their result indicate that DDS is a better option. Well targeted small cells has been shown to enhance QoS, offload traffic from macro-cell [3], ensure balance network load [4], improve energy saving capability and generally optimize performance [5] of the network. DDS can further be classified into uniformly distributed strategy (UDS), Cell edge strategy (CES) and user aware strategy (UAS). In UDS, a predetermined pattern of small cell deployment is followed for all macrocells owned my the network operator [6]. For CES approach, Small cells are arranged around the macrocell edge [7]. In UAS, locations of users are considered for small cell deployment based on usage or population. Normally, these data are obtained from long term traffic information [8] which does not provide prompt response to capacity requirement of hotspots especially when they are unexpected. Hotspots are locations of high demand characterized by high user concentration. A mobile small cell deployment strategy for unexpected hotspots which will ensure prompt response to traffic was proposed in [9] but with the assumption that network operators are able to promptly identify hotspot locations. To the best of our knowledge, there is no existing small cell deployment strategy with hotspot identification which is the contribution of this paper.
2. Problem Statement and Proposed Strategy
Considering a macrocell of a cellular network with 360◦ coverage. Looking at only 180 degrees coverage of this network as illustrated in Figure2 with base station (BS) located as indicated with red dot. Assuming there are so many users causing traffic overload on the existing macrocell and low quality of service (QoS) resulting to customer dissatisfaction. Some locations in this network are characterized with obvious clusters of users within the cell causing an overload on the macrocell base transciever station servicing this area. The strategy proposes a monitoring system to be deployed on the BS tower to monitor the coverage area so that it divides the area into azimuthal and range sectors as shown in Figure 2. By locating users into the individual azimuth-range classes, positions with HUC can be identified for small cell deployment. With blind or random placement of small cells in this network, the uncertainty of achieving the objective of HetNet will be high but with a monitoring system, it is almost certain that optimal placement of small cell based on user concentration will be achieved.
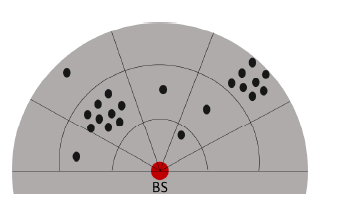 Figure 2: The proposed strategy for prompt small cell deployment
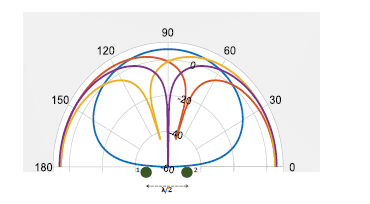 Figure 3: The proposed strategy for prompt small cell deployment
Assuming a two element array system is used for monitoring so that a directional main beam is produced on azimuth and steered to other azimuth locations as shown in Figure 3. This creates azimuth locations differentiated by main beam positions for angle of arrival localization of network users. By sharing the network coverage into range classes relative to the BS and estimating user range, users are located into different azimuth-range classes and users clusters can be identified.
3. User Cluster Localization and Optimum Position for Small Cell Deployment
To localize users by cluster, the system first estimates the DoA of each user. This is based on the azimuth position from where the maximum RSS was calculated when compared with measured RSS from other beam steered azimuth positions. It should be noted that the estimated DoA is not a precise estimate but considering the application, only a sector estimate is required. Second the system estimates range of each user using a range estimation model that is based on RSS-distance relationship. By fitting a curve in least square sense, a mathematical model that is applied for user range estimation is obtained. Combining estimated DoA and range, users are classified into created azimuth-range classes of the network.
3.1. Simulation
To test the proposed strategy, thirty users were randomly distributed within a simulated network coverage area as shown in Figure 4. The aim is to determine locations of user cluster and optimum positions for small cell deployment based on number of users in each cluster.
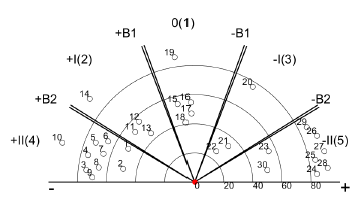 Figure 4: Actual location of users before localization
Assuming the network channel to be FSPL environment, the system acquires data for localization by calculating user RSS from all four main azimuth positions. Figure 5 is a plot of calculated RSS from all four main beam positions. From the calculated RSS data, it can be seen that different RSS values are measured from each azimuth position with a unique maximum value for each user. Using the calculated RSS, user DoA is calculated based on the azimuth position with highest calculated RSS for each user. Estimated DoA result of each user is shown in Figure 6.
Comparing the result of Figure 6 with the actual user locations of Figure 4, it can be seen that all users were correctly located to the azimuth position where they belong.
Considering the accuracy of DoA estimation as the ability to locate users into each of the created azimuth sectors, this result gives 100% DoA estimation accuracy.
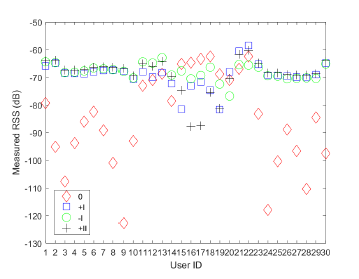 Figure 5: System simulated RSS from user devices in four main azimuth positions showing possibility of classifying DoA based on maximum RSS
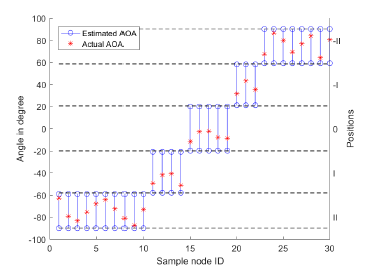 Figure 6: Estimated user DoA showing correct azimuth position localization of all users in the Network
To test the range estimation, four different environments, FSPL, HATA, ITU and WINNER defined by their empirical pathloss models of Equations 1, 2, 3 and 4 respectively were considered.
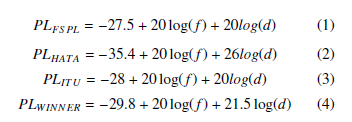 where f is radio wave frequency in MHz, d is distance between BTS and user in meters. These environments were modeled and range estimation model developed for each environment. Using the measured RSS from FSPL environment, the four range estimation models for FSPL, HATA, ITU and WINNER were applied to estimate user range. Figure 7 shows the actual user range with the result of estimated range using these range models. To determine which of the network location area is the optimum position for small cell deployment, users are classified into each of the sectors based on the estimated DoA and range. By counting the number of users in each class, user population per class is determined. Based on a preset threshold of number of users for small cell deployment depending on the type of small cell for the network, the optimum position for small cell deployment is determined. Assuming a micro-picocell network where a picocell is deployed in positions with atleast six users, optimum positions for small cell deployment in the simulated network are obtained as shown in Figure 8.
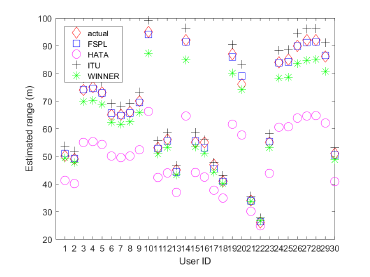 Figure 7: Estimated range of users using all four environment range estimation models for calculated RSS in FSPL environment
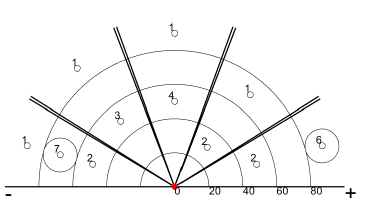 Figure 8: User cluster localization and optimum small cell deployment position identification
The range estimation result of Figure 7 gives a mean absolute error (MAE) of approximately 6m, 16m, 10m and 7m using FSPL, HATA, ITU and WINNER range models respectively. FSPL environment has given the least error in estimation because RSS was calculated in FSPL environment. This means that if the environment is known, the system is able to determine range estimation up to an accuracy of 6m but if the environment is unknown, the error in range estimation can increase up to 16m. By visually observing the result of Figure 7 and considering range estimated using FSPL range estimation model, it can be seen that users with
ID numbers 1 to 10 and 23 to 30 located at azimuth positions +II and -II respectively were located with error in range estimation lying between 0 and 1m. Users with ID 11 to 14 and 20 to 22 located at azimuth positions +I and -I respectively were located with range estimation error between 1m and 37m. This is an indication that in a switched beam based localization systems, range estimation is azimuth position dependent. This will further be investigated in future work. Result of Figure 8 shows that user cluster and positions for small cell deployment can be determined.
3.2. Experimental Validation
Experiment was performed outdoor in the open field space of Ponderosa park in Sheffield, UK using a network of WiFi nodes as users. Figure 9 is a picture of the experimental setup. Figure 10 shows a model of the experimental environment with deployed users in their actual positions.
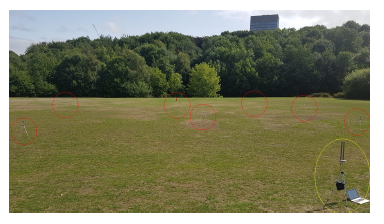 Figure 9: Outdoor experimental setup showing some of the distributed users on red and deployed observer system on yellow
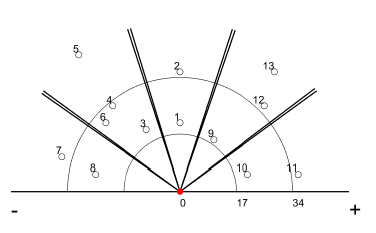 Figure 10: A model of the actual user position before localization
Ten RSS of these users were measured from a reference point where the monitoring system was positioned. Mean of the experimental measured RSS for each user from four main azimuth positions were obtained and plotted as shown in Figure 11. Using the measured RSS, DoA of users were estimated and result shown in Figure 12. Using the same measured RSS, user range were estimated using four range models representing four different environment scenarios. Result of Figure 13 shows actual, ITU simulated and experimental estimated range of users using all environment models. Next is to locate user clusters and identify locations for small cell deployment based on set threshold. Since only few (thirteen) users were used in this experiment, it was assumed that locations with up to two users are qualified for small cell deployment. Due to the small experimental area, coverage area was shared into three range sectors. Combining the estimated DoA and range, users are classified into clusters by counting the number of users in each azimuthrange sectors of the coverage area. Figure 14 is result of experimental localized user clusters.
4. Result Analysis and Discussion
Comparing the actual user azimuth positions and the DoA estimation result of Figure 12, it can be seen that all users were correctly localized to their azimuth positions. Result has shown 100% accuracy for the used sample of users which validates the simulation DoA estimation result.
Result of range estimation shown in Figure 13 gives a mean absolute error (MAE) between actual and experiment of 2.51m, 3.56m, 2.19m and 2.54m for FSPL, HATA, ITU and WINNER open space range models respectively. This shows that the environment of RSS measurement is closely related to ITU model than other used range models. Comparing simulation and experiment, MAE in range estimation between experiment and simulation in ITU environment is 1.36m. This means that the mean deviation of experiment from simulation is approximately 1m and 2m from actual range. This shows that range estimation is achievable with manageable error levels. Apart from HATA which has a model that is well deviated from others, all other models are on the average, about 2.5m close to actual range. Deviation of experiment from simulation is just approximately 1m which means that this strategy is applicable and would work as modeled in simulation with a mean difference of ≤ 1.5m of range estimation in most known environments.
Comparing result of Figures 14 with the actual user positions, four small cell deployment locations were identified instead of two. This is due to over estimation of two of the users as a result of noise in measurement. This error may have been caused by the drizzling weather condition during this experiment. Also with few users and small number of users for small cell deployment as used here, this is expected but with a practical higher number of users required for small cell deployment in a real cellular network, this discrepancies will be reduced. The possibility of user cluster and small cell deployment position identification is promising with the results obtained from this experiment.
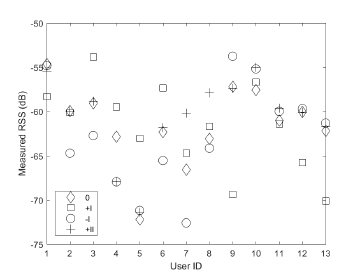 Figure 11: Measured RSS from user devices at all azimuth positions
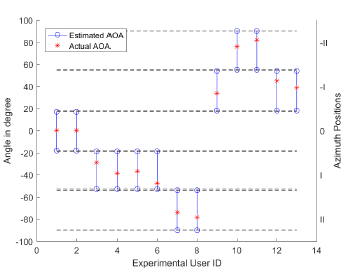 Figure 12: Experimental estimated DoA of users
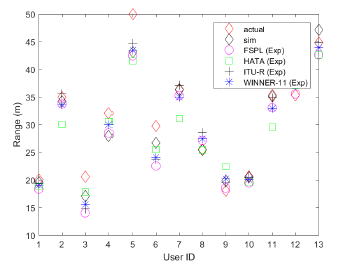 Figure 13: Experimental range estimation showing actual, simulated and experimental estimate
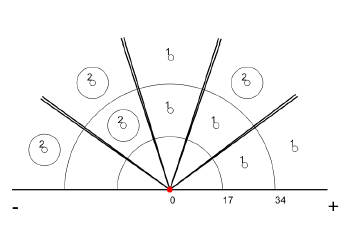 Figure 14: Experimental user cluster localization and optimum small cell deployment position identification
5. Conclusion
The work presented in this paper describes a novel and practical strategy for prompt small cell deployment in a heterogeneous network. This strategy involves using a monitoring system to periodically monitor the network coverage area of a wireless network and identify locations for small cell deployment based on user cluster localization. The entire network coverage area is shared into azimuth and range locations for user cluster localization. By applying DoA and range estimation, user relative position is estimated. Number of users in each class is determined to identify optimum positions for small cell deployment. Both simulation and experimental results have shown that this strategy is applicable and user clusters can be correctly identified with minimal error.
Conflict of Interest
The authors declare that there is no conflict of interest.
Acknowledgment
I wish to acknowledge Enugu State University of Science and Technology and the Federal Government of Nigeria through Tertiary Education Trust Fund (TETF) for sponsoring this research.
- D. Abonyi and J. Rigelsford, “A System for Optimizing Small-Cell Deployment in 2-Tier HetNets,” in 2018 IEEE 23rd International Workshop on Computer Aided Modeling and Design of Communication Links and Networks (CAMAD). IEEE, sep 2018, pp. 1–6.
[Online]. Available: https://ieeexplore.ieee.org/document/8514981/ - G. Su, L. Li, X. Lin, and H. Wang, “On the optimal small cell deployment for energy-e_cient heterogeneous cellular networks,” in 2014 Sixth International Conference on Ubiquitous and Future Networks (ICUFN). IEEE, jul 2014, pp. 172–175. [Online]. Available: http://ieeexplore.ieee.org/lpdocs/epic03/wrapper. htm?arnumber=6876775
- A. Nika, A. Ismail, B. Y. Zhao, S. Gaito, G. P. Rossi, and H. Zheng, “Understanding data hotspots in cellular networks,” in 10th International Conference on Heterogeneous Networking for Quality, Reliability, Security and Robustness. IEEE, aug 2014, pp. 70–76. [Online]. Available: http://ieeexplore.ieee.org/document/6928662/
- M. H. Qutqut, H. Abou-zeid, H. S. Hassanein, A. M. Rashwan, and F. M. Al-Turjman, “Dynamic small cell placement strategies for LTE Heterogeneous Networks,” in 2014 IEEE Symposium on Computers and Communications (ISCC). IEEE, jun 2014, pp. 1–6. [Online]. Available: http://ieeexplore.ieee.org/document/6912536/
- S. Landstrom, H. Murai, and A. Simonsson, “Deployment Aspects of LTE Pico Nodes,” in 2011 IEEE International Conference on Communications Workshops (ICC). IEEE, jun 2011, pp. 1–5. [Online]. Available: http://ieeexplore.ieee.org/document/5963602/
- Y. Park, J. Heo, H. Kim, H. Wang, S. Choi, T. Yu, and D. Hong, “E_ective Small Cell Deployment with Interference and Tra_c Consideration,” in 2014 IEEE 80th Vehicular Technology Conference (VTC2014-Fall). IEEE, sep 2014, pp. 1–5. [Online]. Available: http://ieeexplore.ieee.org/lpdocs/epic03/wrapper. htm?arnumber=6965951
- J. Hoadley and P. Maveddat, “Enabling small cell deployment with Het- Net,” IEEE Wireless Communications, vol. 19, no. 2, pp. 4–5, apr 2012. [Online]. Available: http://ieeexplore.ieee.org/document/6189405/
- I. Bahceci, “On femto-cell deployment strategies for randomly distributed hotspots in cellular networks,” in 2014 IEEE Wireless Communications and Networking Conference (WCNC). IEEE, apr 2014, pp.2330–2335. [Online]. Available: http://ieeexplore.ieee.org/ document/6952713/
- N. E, X. Chu, and J. Zhang, “Mobile Small-Cell Deployment Strategy for Hot Spot in Existing Heterogeneous Networks,” in 2015 IEEE Globecom Workshops (GC Wkshps). IEEE, dec 2015, pp. 1–6. [Online]. Available: http://ieeexplore.ieee.org/document/7414060/