
A Perceptually Optimized Embedded Image Coder and Quality Assessor Based Both on Visual Tools
Volume 4, Issue 4, Page No 230-238, 2019
Author’s Name: Abderrahim Bajit1,a), Mohammed Najid2, Ahmed Tamtaoui3, Abdellah Lassioui1
View Affiliations
1Ibn Toufail University, GERST Electrical Engineering Department, National School of Applied Sciences, Kénitra, Morocco
2Hassan II University, Electrical Engineering Department, Faculty of Sciences and Technologies, Mohammedia, Morocco
3Mohammed V University, SC Department, INPT Institute, Rabat, Rabat, Morocco
a)Author to whom correspondence should be addressed. E-mail: abderrahim.bajit@gmail.com
Adv. Sci. Technol. Eng. Syst. J. 4(4), 230-238 (2019); ![]() DOI: 10.25046/aj040428
DOI: 10.25046/aj040428
Keywords: Human Visual System HVS, Discrete Wavelet Transform, Contrast Sensitivity Function, Just Noticeable Difference, Luminance & Contrast masking, SPIHT embedded Coder, Objective Quality Metric, Subjective Quality Metric, Mean Opinion Score MOS

Export Citations
In this paper, we propose a new Perceptually Optimized Embedded Zero Tree Image Coder EVIC and its improved version MEVIC. The coder presents a new perceptual model to weight wavelet coefficients to enhance SPIHT embedded coding. The new visual coder aims to improve the visual quality obtained by the reference SPIHT coder for a given targeted bit rate. In addition, the paper presents three-evaluation approaches (Objective, Subjective and Quantitative) based all on a quality score PS given by the objective visual quality metric named MWVDP which is an optimized version of Daly Visible Difference Predictor VDP. It incorporates the human visual system HVS properties, correlates largely well with the mean opinion score known as MOS and provides an important feature in image coding quality assessment. The visual coders EVIC/MEVIC are fully dependent to the HVS properties, from which, they include various masking effects and visual models. Based on this model, the visual coders weight the original wavelet coefficients and reshape their spectrum to optimize the perceptual quality coding for a given observation distance and bit rate. The visual weighting model processes within all wavelet sub-bands: 1) the contrast sensitivity filter CSF to mask invisible frequencies, 2) the threshold elevation to correct the luminance and elevate the contrast, 3) the Just Detectable Distortions JND to quantize visually the wavelet coefficients according to their corresponding thresholds. The visual coder EVIC and its optimized version MEVIC have the same software complexity as their reference SPIHT. However, they perform qualitatively and quantitatively excellent results experimentation and features improvement either in image coding and quality assessing.
Received: 31 May 2019, Accepted: 24 July 2019, Published Online: 30 July 2019
1. Introduction
Recently increasing works effort made in embedded wavelet based image coder [1], which not only improves features in image compression, but also has the ability to truncate the bit stream at any desired bit budget and still capable to decode and reach an enhanced quality image. Embedded Wavelet Zero Tree coding (EZW) initiated first by J. M. Shapiro [2] and optimized next by A. Said and W. A. Pearlman [3] performs an algorithm that Sets Partitioning In Hierarchical Trees (SPIHT) the wavelet coefficients. These embedded coders have proven to be a very effective image compression and distortion measurement using spatial metrics like PSNR. Reducing such spatial errors does not necessarily guarantee the preservation of good perceptual quality of the decoded images and may result in visually annoying artifacts despite good PSNR measures. This is naturally true in low binary budget applications where we aim eliminating increasingly more redundant information while still minimizing visual distortions. Consequently, these exigencies obliged us to provide more efforts to develop a new wavelet based perceptual quality metric named MWVDP. This metric inspired from the Daly model known as Visible Difference Predictor and related to a psychometric function computes the probability of detecting errors in frequency domain and yields a score called PS serving for quality evaluation.
In computer vision, great successes are obtained by a class of wavelet based embedded visual image coders, such as PEZ, EZW, SPIHT and many others. Some coders did not compress the original wavelet coefficients with respect to the Just Noticeable Distortion JND thresholds like the optimal ones proposed by Watson model. The model experiments a psycho-visual tests applied to the 9/7 biorthogonal wavelet basis [4] which offers an optimal quantization threshold that ensures a visually lossless compression quality improvement [5-8]. In other works, the use of many interesting HVS features were not adopted like, contrast sensitivity function CSF [9-12], luminance and Contrast Masking [13-16] whose special aim is to mask spatially the image spectrum invisible frequency contents according to HVS features. Implementing these properties, we may control image contrast, reduce considerable invisible information, quantize visually its frequency contents, and still efficiently improve its coding quality.
In this work, we propose a new visual optimized version MEVIC, which is a Visually Optimized version of EVIC [17] relative to its older version POEZIC introduced in [18] and its foveal one POEFIC presented in [19]. This scheme is fully dependent to the HVS properties, which, before coding the original wavelet coefficients it previously applies perceptual weights according to their visual importance. The visual model weights the original wavelet coefficients, reshapes their spectrum to optimize the final quality coding for a targeted viewing and bit budget conditions and finally assesses its reached quality to its reference SPIHT version. Although the latter reduces effectively the MSE, it is not explicitly deployed to compensate perceptual distortions that match the HVS capacities. The visual weighting model processes within all wavelet sub-bands: Contrast Sensitivity Function, Luminance and Contrast Masking and Threshold Elevation according to its perceptual thresholds JND that we employ to reduce the human observer detect ability of compression errors.
We organize the paper as follow: in section two, we will develop the visual coder scheme and flow diagram and will explain briefly its main components. Then in section three, four and five, we will detail the deployed visual models and demonstrates their important role in reshaping the original wavelet coefficients spectrum so that it keeps and encodes the necessary information and eliminates as much as possible all redundant ones. Next in the sixth section, we will introduce a new wavelet-based image quality assessor; itself is based on visual models, which takes an interesting role in optimizing and measuring objectively the image coding quality. Our new wavelet assessor, named Modified Wavelet based Visible Difference Predictor MWVDP and its versions employ all a psychometric function used to compute the probability of detecting errors in frequency domain and provide a score called PS aiming for quality assessment. Finally, in section seven, we will discuss in more detail the obtained results with respect to the qualitative, quantitative and subjective approaches and will compare them to the mean opinion score known as MOS derived experimentally from subjective tests.
2. Visual Wavelet Based Image Coding Flow Diagram
In this paper, we propose a visual coder as shown in figure 1 combines the following stages, successively: Discrete Wavelet Transform DWT, Contrast Sensitivity Filter CSF, Luminance correction, contrast adaptation known as threshold elevation more detailed in Figure 2 and set-up according to optimal wavelet visual thresholds JND, and finally SPIHT embedded coding. The visual coder MEVIC’s flow diagram, in the first step, based on Daubechies biorthogonal wavelet filter (Watson model) decomposes discretely the candidate image to perform a cortical-like representation [20] despite its channel limitation. Having some special mathematics features, this wavelet ensures a perfect reconstruction, which urges the image compression standard JPEG2000 committee to recommend the filter to be the most used in image vision lossless-based compression.
The perceptual model Setup reshapes the original wavelet coefficients spectrum in order to eliminate much more redundant information and keep only important one regarding to some entered constraints exclusively the targeted bit budget with respect to a given observation distance. These constraints play an important role in evaluating objectively and subjectively both the image coder and the quality assessor. The weighting model as schematized in Figure 2 and detailed next, apply the contrast sensitivity filter, within all spatial-frequency sub-bands, to maintain perceptible frequencies and eliminate all invisible ones according to the SVH properties (Section III). In addition, we apply the wavelet-based perceptual thresholds JND that we derive from Watson experimental model to compute the wavelet coefficients threshold elevation. Applying these thresholds, the quantization distortions are under visibility control and the targeted perceptual lossless compression is achieved (section IV).
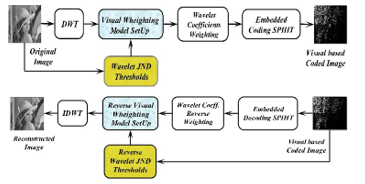 Figure 1: Visual-based Embedded Wavelet Image Coder Flow Diagram.
In the second stage, we compute the contrast masking known as the contrast thresholds elevation. Its process begins first on calculating the luminance masking related the image filtered wavelet coefficients. Then it deploys the perceptual thresholds required for contrast correction computation, known as contrast threshold elevation. This operation shadows invisible contrast components and elevates perceptible ones with respect to the level of the Just Noticeable Difference JND thresholds (Section IV).
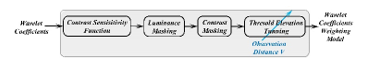 Figure 2: Wavelet-based weighting model diagram.
The main purpose of this optimized visual-based weighting model employed exclusively to MEVIC (optimized version of EVIC [17]) is the ability to tune none linearly the image spectrum shape depending on the observation distance. In this optic, as the observation distance grows from low level to the greatest ones the shape intends to cover the important frequencies. For low distances the visual models cover much more the low frequencies. In the opposite way -higher observation distances- the visual weighting model covers this case much more frequencies.
In the final step, we apply an embedded coder to encode progressively with scalable resolution the visual based wavelet coefficients until reaching the targeted resolution related to a given bit rate. In our paper, we have adopted the standard SPIHT embedded coding. The latter itself is an optimized version that belongs to the set of the wavelet-based embedded Zero Tree EZW image coders initiated exclusively by Shapiro and optimized thereafter by A. Said and W. A. Pearlman.
3. Contrast Sensitivity Filtering Approaches
Rather than coding directly the image wavelet-based coefficients spectrum and optimize the perceptual quality of its reconstructed version, we apply the contrast sensitivity function CSF [9-12] benefits. This filter implies, quantitatively, how much the HVS perceives a pattern located spatially in image region of interest. It sets the contrast perception related to spatial frequency usually represented in cycles per optical degree. This feature makes the CSF filter spectrum shape, as plotted in Figure 3, specifically independent to the observation distance. Common to classical compression techniques focus efforts in optimizing their coding efficiency and reducing computational complexity, which is not sufficiently complete in improving its perceptual quality.
The mathematical property of the CSF filter reshapes the spectrum of the wavelet-based transformed image to perceptual domain, which gives the ability to remove significantly all imperceptible frequencies regarding the human cortical domain. In the context, we suppose that the viewing conditions (spatial resolution: r, and observation distance: r) are fixed. In reality, this is not a fortiori true, because an observer can see the image from any distance. Nevertheless, specifying the spatial resolution r and observation distance v is mandatory to apply a visual weighting. Therefore it is observed, that modifying slightly the CSF frequency spectrum shape and the assuming the ”worst case of viewing conditions”, a CSF masking filter that works perfectly for varying viewing conditions and scalable resolution devices must be conform to JPEG2000 adopted model we plotted in Figure 3.
In lossless compression applications, the CSF filter weights the original wavelet coefficients to reshape their previous spectrum, and code weighted version. In the opposite way, in non-visual coding algorithms, encoder codes classically the perceptible frequencies and many other redundant residues proved to be unusual to the human visual system, which consumes additional coding bits budget and increases significantly computational time.
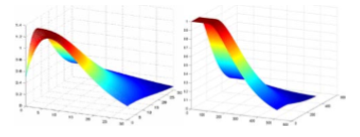 Figure 3: Mannos contrast Sensitivity filter in the left, and Daly in the right.
To implement the CSF and apply it to wavelet image spectrum, there exits many strategies. Conventional implementation weights all wavelet coefficients belonging to one sub-band adopting a single invariant weighting factor [11]. This strategy named Invariant Single Factor (ISF). It assigns one weight factor across wavelet channel. This strategy is very simple and still an excellent weighting approach. Filtering implementation weights the original wavelet spectrum matching exactly the shape of the CSF. This approach keeps the possibility of an orientation dependent weighting inside the sub-band and is adapted locally to image contents properties. Adaptive approach mixes both strategies. We apply the ISF approach to low frequency spectrum and we match the rest (higher frequencies) using adaptive strategy.
4. Luminance Masking and Threshold Elevation
The main step adopted in our visual coding process is the contrast masking-weighting filter, which we exclusively adopt in this work. In fact, we apply this operation to the original wavelet spectrum. Its conception is based on three psychophysical properties we model to implement and setup the visual weighting filter, successively: first, we determine the perpetual thresholds JND experienced by Watson, then we apply light adaptation [13-14] (also known as, luminance masking), Contrast correction [15-16] known as threshold elevation. Once computed, the model is applied to wavelet coefficients after ensuring a cortical-like decomposition, then compared to the real model processed by the famous Human Visual System cortical decomposition which we finally verify their perfect correlation.
To reach this aim, we first compute the JND thresholds using a base detection related to wavelet sub-bands. We derive its model from the psychophysical experiments processed by Watson. The experienced model corresponds exclusively the Daubechies biorthogonal wavelet filter. Modeling thresholds in image compression, depends on the mean luminance over a selected region in the image. To calculate the contrast sensitivity we take into account its variation that we may tune using luminance masking correction factor. In our paper, we adjust the luminance masking with a factor exponent of 0.649, based on the power function, adopted seemly in JPEG2000 image coder.
In addition, contrast correction or contrast threshold elevation, is a second factor that affects significantly the detection threshold. This elevation keeps in mind the idea that the visibility of one image pattern component changes significantly with the presence of an image masker compound [13-16]. Contrast masking corrects the variation of the detection threshold of a pattern component as a function of the masker compound. The masking result refers to us as contrast function of a target threshold versus a masker. In this paper, wavelet coefficients represent the masker signal he input image to code visually, while the quantization distortion represents the target signal. In figure 4, we display the final wavelet based visual weighting model process. We plot in 3D dimension the shape of the visual models. The figure presents successively the visual masking effects, applied to the image spectrum, the original image wavelet coefficients, their corresponding weights, and their weighted visual-based version.
In the beginning, the process decomposes the original image to provide wavelet coefficients -first step-. Then calculates their corresponding perceptual thresholds JND -second step-. These later stages rely both to Daubechies biorthogonal filter. Next, it computes the contrast sensitivity function CSF filter to reshape the image wavelet spectrum by weighting their coefficients –third step-. After that, it adapts the image corresponding luminance -fourth step-, and elevates the contrast according to perceptual thresholds. Finally, -fifth stage-, it applies the designed filter to weights the wavelet coefficients and progressively encode them according to SPIHT embedded coding philosophy.
We illustrate in 3D plotting demo, the visual weighting process applied to Lena test image with respect to a given viewing distance V=4. This process shows how we reshape the image wavelet spectrum with our designed visual weights, and shows how the filter affects the wavelet distribution across sub-bands. It reshapes considerable medium and low frequencies that constitute naturally the main image contents. Note that, one may tune and refine the spectrum shape dependently to a varying observation distance.
5. Wavelet Visual-Based Weighting Model Process
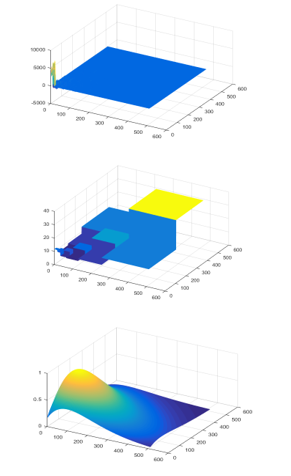
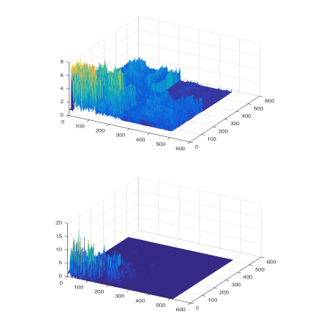 Figure 4: Visual weighting model stages process designed for LENA test image. We display from the top to bottom, its components as follow: Original Wavelet Coefficient DWT, Wavelet perceptual thresholds JND, Contrast Sensitivity Function CSF, Threshold Elevation (Contrast Masking), and the Visually Weighted Wavelet Coefficients to encode progressively by SPIHT coder.
6. Wavelet Visual Based Objective Quality Assessor
To assess the image coding quality and evaluate compression techniques we compare reliably measure the image compression quality according subjectively the mean opinion score (MOS) reference factor. The use of mathematical model such as the mean squared error (MSE) and its optimized version the peak signal to noise ratio (PSNR) are simple and computed spatially. However, these metrics correlate poorly with the mean opinion score MOS depending on advantages that offer the HVS properties.
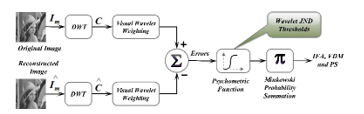 Figure 5: Modified Wavelet Visible Difference Predictor Flow Diagram.
Recently, we apply a cortical-like metrics based on the HVS properties to optimize the correlation factor with the Mean Opinion Score MOS. it predict the introduced errors in a degraded image naturally invisible to human observer [21-33]. The VDP metric [28] behaves like such assessors, which inspired on cortical models provides an indication degree of visual errors as a function of image location. Adaptive metrics based on wavelet transform becomes efficient in image coding, because of its similarity to human cortical channels. Despite their channels limitation, the wavelet-based assessors still provide an excellent quality measure and contribute in optimizing the image compression schemes.
In this paper, we have developed a new wavelet based image quality metric; named Modified Wavelet-based Visible Difference Predictor MVDP shown in figure 5. This visual metric is an optimized version of the WVDP we used in [34-36]. The later computes the visible errors summation using the Minkowski unit to reach the visible difference map and yields of course the quality factor PS using the psychometric function. The former, first, weights both the original image and its visual image using the same visual model we deployed in section 3. This way it eliminates all invisible information and compare only the important ones. Then it transfers these errors to the Minkowski summation unit to reach the visible difference map and the quality factor PS using the psychometric function. This factor contributes efficiently in visual-based image encoders aiming to enhance their performance. It expresses the ability of perceiving distortions within wavelet channels. In the following formula, we express detection probability:
Where is the quantization distortion detection, is the location , is the perceptual thresholds, β denotes a refining parameter the correspondence location , and P the probability summation. Inspired from Minkowski summation, we sum within all wavelet sub bands all computed probabilities to reach the evaluation score. The final objective score is computed as follow:
Note that as more and more this factor approaches the unit the quality becomes better. In addition, this factor ranges from ‘0’ for poor quality to ‘1’ for excellent coding quality.
7. Quality Results Discuss
In vision, the visual coders are fully dependent to visual quality metrics which theoretically and practically correlate well with visual reference known as the mean opinion score MOS. In this paper, we tested the visual EVIC and its optimized version MEVIC coders using 8 bits monochrome test images. We assessed their quality using the wavelet visual-based objective metric WVDP for the former and its modified version MWVDP for the later. In this purpose, we compare EVIC and MEVIC quality coding with respect to their reference, respectively SPIHT for the former and EVIC for the later. In this optic, we deployed three evaluation approaches: OBJECTIVE, SUBJECTIVE, and QUANTATIVE, both according to bit budget and viewing distance conditions.
The first approach depends in the factor quality PS values are obtained from the evaluation of the visual quality coding EVIC vs SPIHT and MEVIC vs EVIC applied to ZELDA and GOLDHILL test images. As shown in figures 5 and 6, the results are given for increasing bit rates varying from 128:1 which corresponds to 0.0078125bpp till 1:1 synonymous to 1bpp and a fixed viewing distance of values V=1, 3, 6 and 10. As a results, all approaches approve that for very low binary budget (less than 0.0625bpp), many spatial patterns are hardly perceivable in SPIHT coded image, however visual coders EVIC and MEVIC exhibit much more interesting information in those regions. Similarly, at medium bit rate less than 0.25bpp, the reference still providing blurred images, while the concurrent EVIC/MEVIC coders show significant quality across the whole image. On the other hand, for bit rates around 0.5bpp, the concurrent EVIC/MEVIC quality still always superior than its reference SPIHT. Finally, when the bit-rate reaches very high bit rate more than 1bpp, visual coder approaches uniform resolution and all mentioned coders (reference SPIHT, visual EVIC, and its optimized version MEVIC) decode indistinguishable images difference.
The second strategy performs an averaged subjective assessment notation scores applied to both reference visual coders. As shown in Figures 7-8, we evaluate subjectively the EVIC versus SPIHT and MEVIC versus EVIC coding qualities of ”Barbara” test image for varying bit budget and still observation distance V and approve the subjective quality notation to the objective values related to the measured probability score PS. The second approach approves that, at low binary budget, visual coders EVIC/MEVIC maintain considerable quality across the whole image. Similarly, for intermediate binary budget, the gazed patterns are weakly recognizable in reference coded images; however those regions are strongly perceivable in visual coders and exhibits much more interesting information across image. At higher binary budget and viewing distance, the visual coder behaves perfectly over all image contents whereas the standard one becomes significant.
The last strategy (QUANTITATIVE approach), the quality gain provided by the visual coder relative to the reference coder SPIHT is calculated according to these formulas:
100*(PSEVIC – PSSPIHT)/PSSPIHT
100*(PSMEVIC – PSEVIC)/PSEVIC
We can conclude as filled in tables 1, 2 and 3, that with increasing binary budget and viewing observation conditions the quality gain grows progressively up. This constitute the aim of our visual coder and its intimate quality assessors, which are able of enhancing coding performances and avoiding errors introduction.
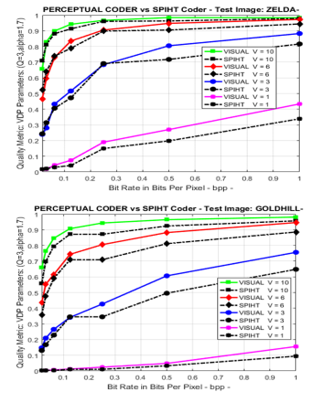 Figure 5: Visual coder EVIC vs standard SPIHT, WVDP-based visual quality metric applied to test images ZELDA (top) and GOLDHILL (bottom) for varying targeted bit rate and a given viewing distances 1, 3, 6, and 10.
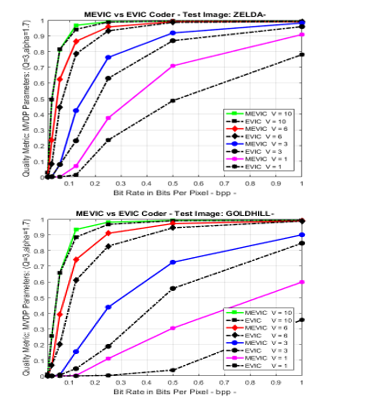 Figure 6: Visual coders MEVIC vs EVIC Quality measures, MWVDP-based visual quality metric applied to test images ZELDA (top) and GOLDHILL (bottom) for varying targeted bit rate and a given viewing distances 1, 3, 6, and 10.
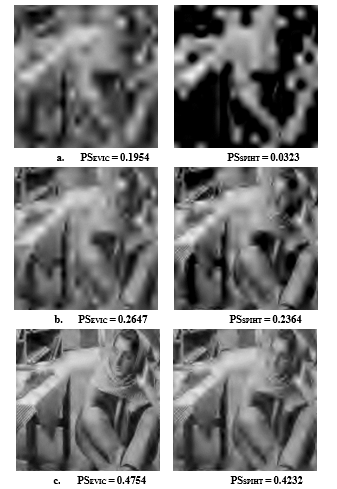
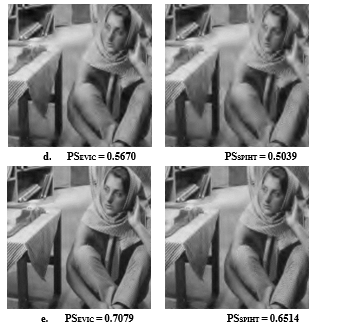 Figure 7: Barbara EVIC visual coding images (left column) versus the standard SPIHT coding images (right column) and their quality scores PS using visual WVDP assessor given for varying bit rate and fixed observation distance. The bit rate varies, respectively as follow: a. 0.0313 bpp, b. 0.0625 bpp, c. 0.15 bpp, d. 0.25 bpp, and e. 0.5 bpp. Moreover, the viewing distance is tuned to V= 4. ISAECT19 ORIGINAL RESULTS
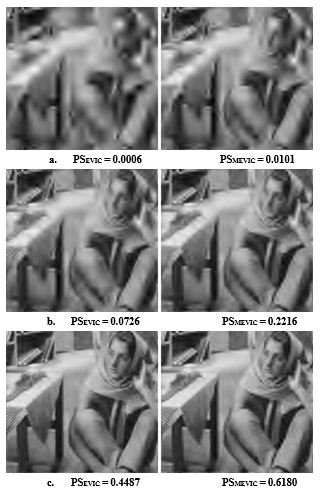
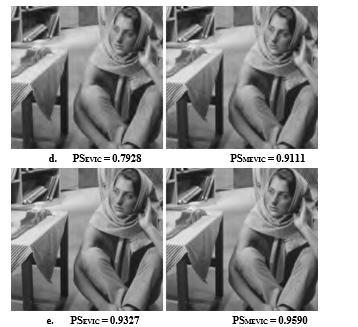 Figure 8: Barbara visual coding images EVIC (left column) versus its optimized version MEVIC (right column) and their quality scores PS using visual MWVDP assessor given for varying bit rate and fixed observation distance. The bit rate varies, respectively as follow: a. 0.0313 bpp, b. 0.0625 bpp, c. 0.15 bpp, d. 0.25 bpp, and e. 0.5 bpp. Moreover, the viewing distance is tuned to V= 4.
ASTESJ EXCLUSIVE RESULTS
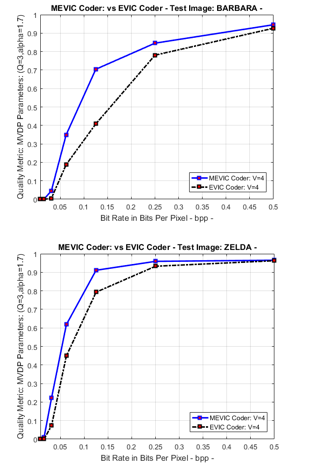 Figure 9: MEVIC vs EVIC Quality measure for varying binary budget and given observation distance 4 for images BARBARA (top) and ZELDA (bottom).
Table 1: EVIC vs SPIHT WVDP-based metric quality gain for varying bit rates and still viewing conditions. ISAECT19 ORIGINAL RESULTS
|
Targeted Bit Rate |
Quality Gain (%) | |||
| LENA | BARBARA | MANDRILL | BOAT | |
| BPP = 0.0625 | 6.4562 | 0.7250 | 24.6382 | 17.3908 |
| BPP = 0.25 | 3.8569 | 19.6639 | 32.9948 | 48.4490 |
| BPP = 1 | 5.2489 | 2.9949 | 9.8373 | 1.8828 |
Table 2: EVIC vs SPIHT WVDP-based metric quality gain applied to images: LENA, BARBARA, MANDRILL and BOAT for varying viewing distances and static binary budget. ISAECT19 ORIGINAL RESULTS
| Observation Distance | Quality Gain (%) | |||
| LENA | BARBARA | MANDRILL | BOAT | |
| V = 1 | 15.1549 | 29.6901 | 45.1232 | 78.9933 |
| V = 3 | 7.6339 | 12.1079 | 18.0167 | 24.8798 |
| V = 6 | 4.7876 | 10.9930 | 14.7008 | 12.1474 |
| V = 10 | 6.1027 | 8.8758 | 10.1884 | 8.2992 |
Table 3: MEVIC vs EVIC MWVDP-based metric quality gain applied to images: LENA, BARBARA, MANDRILL and BOAT for varying viewing distances and static binary budget. ASTESJ EXCLUSIVE RESULTS
| Observation Distance | Quality Gain (%) | |||
| LENA | BARBARA | MANDRILL | BOAT | |
| V = 1 | 166 | 2367 | 1687 | 3420 |
| V = 3 | 2972 | 59 | 344 | 8862 |
| V = 6 | 6 | 5 | 15 | 50 |
| V = 10 | 9 | 8 | 7 | 15 |
8. Subjective quality metric
In this section, we will introduce a new method of assessing coding quality. This method is based on a subjective approach as it was used in the previous section. It provides a quality factor called MOS (Mean Opinion score) which averages the subjective measures applied on images coded by MEVIC for different compression rates. The measurements are collected on the basis of a study established by a group of observers of different class, sex and age on a subjective scale ranging from very poor to excellent quality. We applied the MOS factor to validate the use of the MEVIC visual coder and that of the MWVDP visual metric.
8.1. Conditions to be met in Subjective Quality Metrics
The subjective quality evaluation is normalized by the CCIR recommendations [33-38], originally designed for television images without taking into account the introduced degradations in the original image. We aim to evaluate the detected distortions between degraded image and its reference and adopt comparative measures tests. In addition, we suppose that the images can be edited, zoomed and viewed from nearest observation distance. Therefore, we assume that the evaluation conditions experienced by Fränti, as recommended in the CCIR and defined in Table. 4, are partially respected. In addition, we normalize the evaluation range so that we avoid introducing additional errors that depends naturally to the environment tests. To reach an excellent environment, we must avoid additional light sources unless those initially used for the room lighting. In worst case, significant degradation will the image quality. In addition, the screen monitor position must avoid external light source, and the observer’s vision, or disturb the monitor reflections.
| Test Images | Standard Test Images |
| Viewing Conditions | Environment of Normal Desk |
| Observation Distance V | This parameter is left to the observer’s choice |
| Viewing Duration | Unlimited |
| Observers Number | From 15 up to 39 |
| Quality Scale Range | Varies from 0 up to 10 |
Table 4: Conditions to met when using Subjective Quality Evaluation
8.2. Subjective versus Objective Metrics Correlation Score
To compute the correlation factor between the objective measures (vector X) and the subjective measures (observation vector Y), we apply the correlation’s score defined as follow:
Where and , i = 1 to n, denote respectively the vector components of X and Y. n denotes the number of components. and perform, respectively, the average of the vectors X and Y values, with respect the following formula:
And determines the variance value, as follow:
8.3. Subjective Metric MOS Assessment Experimental Results
To experiment the MOS calculation, the test images are displayed on a CRT screen of a Personal computer PC, according to 10.5cm x 10.5cm size (512×512 image resolution) [33-38]. The MOS factor varies from 0 up to 10 (2: very annoying degradation, 4: annoying, 6: a little bit annoying, 8: perceptible, but not annoying, 10: Imperceptible). In addition, we allow the observers to adjust their obtained scores and note their marks by half-values. To compute the subjective score for a given distorted image, we average all noted marks provided by the observers. Finally, we perform a correlation coefficient for a single kind of image. The index n it adjusted to 8 (JPEG2000, 512×512 images).
Figure 10 shows the MOS subjective measures vs the probability scores PS given by the MWVDP metric applied to some test images degraded by the reference JPEG2000 image coder. Let assume that the probability score PS evaluate according to MOS score applied especially to highly textured images at lower bit rates. This proves a better correlation between objective and subjective measures. The correlation factor reaches 0.9529 and 0.9396 respectively for “Barbara” and “Mandrill” test images.
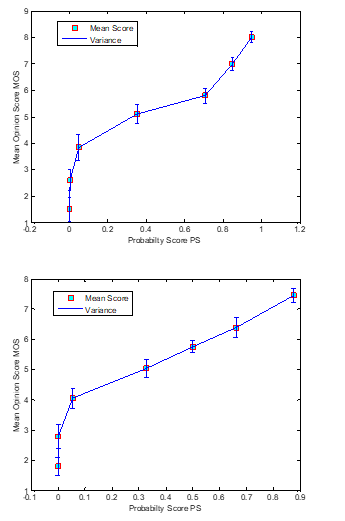 Figure 10: Subjective notes MOS vs Objective scores PS applied to “Barbara” (top) and “Mandrill” (bottom) according to the following setup: 512×512 coded images JPEG2000, observers=24, image-degraded versions=24, .V=4.
9. Conclusion
We proposed in our paper a new visual image coder named a Modified Embedded Visual based image coder MEVIC based on its previous version Embedded Visual based image coder EVIC. We derived the proposed coders from their predecessor POEZIC and its foveal version POEFIC. We also introduced a new visual image coding quality metric named Modified Wavelet Visible Difference Predictor MWVDP. Both of visual coder and quality assessor applies a battery of perceptual tools, and exploits both various visual weighting masks according to the human psychophysical properties HVS. The visual based weighting model incorporates successively the CSF filter, the perceptual thresholds JND, the Luminance adaptation and the thresholder contrast elevation. The provided model reshapes the original wavelet coefficients spectrum, keeps the important information and eliminates all invisible and redundant ones.
By doing so, we encoded and assessed the useful information, which according to a given binary budget and observation distances we reached more enhanced image quality compared to its reference version that coded directly the original wavelet spectrum. The visual coder and quality assessor compute both a cortical-like decomposition, which despite its frequency channels limitation enhances the image decomposition, minimizes perceptually more relevant distortion, reaches the targeted bit rate and optimizes the visual quality compared to its reference SPIHT. It also has the ability to tune non-linearly the image spectrum shape depending on the coding and viewing conditions. In this optic, as the observation distance grows up from low level to the greatest ones the shape intends to cover the important wavelet channels.
Moreover, we developed in this present work, a new wavelet-based image quality assessor named MWVDP, which applies the designed visual weighting model, provides a probability score PS, which takes an important place in optimizing and evaluating objectively the image coding quality. The provided factor deploys a Minkowski probability summation according to a psychometric function across wavelet channels. We applied this to the reference SPIHT, also to its visual version EVIC and MEVIC to predict the perceptual differences between each other. Note that the greatest this factor is, the best the coding quality is. Also, note that this metric plays an important role in our visual based coders, whose experimental results show very exciting performance and powerful quality improvement. In addition, we gathered, discussed and compared the obtained results with different evaluation strategies we meant objective, subjective and quantitative approaches to approve and validate our work.
To finalize our modest work, note that either visual coder and its quality intimate evaluator constitute both an interesting single task belonging a research work that designs a real time embedded system that we will integrate in an Automotive Embedded ARM-based System On Chip -SoC- applied to artificial intelligence AI-based antonymous driving assist and security systems –ADAS-.
- N. Jayant, J. Johnston, and R. Safranek, “Signal compression based on models of human perception,” Proc. IEEE, vol. 81, no. 10, pp. 1385– 1422, Oct. 1993.
- J. M. Shapiro, “Embedded image coding using zerotrees of wavelet coefficients”, IEEE Trans. Signal Processing, vol. 41, pp. 3445-3462, 1993.
- A. Said and W. A. Pearlman, “A new, fast and efficient image codec based on set partitioning in hierarchical trees”, IEEE Trans. Circuits and Systems for video Technology, vol. 6, pp. 243-250, June 1996.
- Michael Unser, Fellow, IEEE, and Thierry Blu, Member, IEEE Mathematical Properties of the JPEG2000 Wavelet Filters [39], IEEE TRANSACTIONS ON IMAGE PROCESSING, VOL. 12, NO. 9, SEPTEMBER 2003
- A. B. Watson, “DCT quantization matrices visually optimized for individual images,” in Proc. Hum. Vis., Visual Process. Digital Display IV, 1993, pp. 202–216.
- Watson and J. A. Solomon, “A model of visual contrast gain control and pattern masking,” J. Opt. Soc. Amer., vol. 14, pp. 2397–2391, 1997.
- T. Pappas, T. Michel, and R. Hinds, “Supra-threshold perceptual image coding,” in IEEE Int. Conf. Image Processing, 1996, pp. 237–240.
- A.B Watson, G.Y.Yang, J.A.Solomon, and J.Villasonor, “Visisbility of Wavelet Quantization Noise, ” IEEE Trans. Image Processing, vol.6 no, 8, pp. 1164-1175 1997.
- J. M. Foley and G. M. Boynton, “A new model of human luminance pattern vision mechanisms: analysis of the effects of pattern orientation, spatial phase and temporal frequency,” in Comput. Vis. Based Neurobiol, vol. 2054, 1994, pp. 32–42.
- J. M. Foley, “Human luminance pattern-vision mechanisms: masking experiments require a new model,” J. Compar. Neurol., vol. 11, no. 6, pp. 1710–1719, 1994.
- S. Daly, W. Zeng, J. Li, S. Lei, Visual masking in wavelet compression for JPEG 2000, in: Proceedings of IS&T/SPIE Conference on Image and Video Communications and Processing, San Jose, CA, Vol. 3974, January 2000.
- Marcus J. Nadenau, Julien Reichel, and Murat Kunt,” Wavelet-based Color Image Compression: Exploiting the Contrast Sensitivity Function” 2000.
- G. E. Legge and J. M. Foley, “Contrast masking in human vision,” J. Opt. Soc. Amer. A, vol. 70, no. 12, pp. 1458–1471, 1980.
- D. G. Pelli, “Effects of Visual Noise,” Ph.D. dissertation, Cambridge Univ., Cambridge, U.K., 1981.
- J. Ross and H. D. Speed, “Contrast adaptation and contrast masking in human vision,” in Proc. Roy. Soc. Lond. B, 1991, pp. 61–69.
- R. J. Safranek, “A comparison of the coding efficiency of perceptual models,” Proc. SPIE, vol. 2411, pp. 83–91, 1995.
- Bajit, A., Nahid, M., Tamtaoui, A, Lassoui, A, “A Perceptually Optimized Embedded Image Coder and Quality Assessor Based on Visual Tools” 2018, ISACET 2018 -IEEE-International Symposium on Advanced Electrical and Communication Technologies, 2018.
- A. Bajit, M. Nahid, A. Tamtaoui, and E. H. Bouyakhf, “A Perceptually Optimized Wavelet Embedded ZeroTree Image Coder” International Journal of Computer and Information Engineering Vol:1, No:6, 2007
- A. Bajit, M. Nahid, A. Tamtaoui, and E. H. Bouyakhf, “A Perceptually Optimized Foveation Based Wavelet Embedded ZeroTree Image Coding” International Journal of Computer Science Volume 2 Number 4, 2008
- I. Honsch and L. J. Karam, “Adaptive image coding with perceptual distortion control,” IEEE Trans. Image Process., vol. 11, no. 3, pp. 213222, Mar. 2002.
- A. B.Watson, “Probability summation over time,” Vis. Res., vol. 19, pp. 515–522, 1979.
- J. G. Robson and N. Graham, “Probability summation and regional variation in contrast sensitivity across the visual field,” Vis. Res., vol. 21, pp. 409–418, 1981.
- P. C. Teo and D. J. Heeger, “Perceptual image distortion,” in Proc. IEEE Int. Conf. Image Processing, 1994, pp. 982–986. [21]
- J. G. Robson and N. Graham, “Probability summation and regional variation in contrast sensitivity across the visual field,” Vis. Res., vol. 21, pp. 409–418, 1981.
- S. J. P. Westen, R. L. Lagendijk and J. Biemond, “Perceptual Image Quality based on a Multiple Channel HVS Model,” Proceedings of ICASSP, pp. 2351-2354, 1995.
- C. Zetzsche and G. Hauske, “Multiple Channel Model Prediction of Subjective Image Quality,” SPIE, Human Vision, Visual Processing, and Display, 1077, pp. 209-215, 1989.
- S. Daly, “The visible differences predictor: An algorithm for the assessment of image fidelity,” in Digital Images and Human Vision (A. B. Watson, ed.), pp. 179-205, Cambridge, MA: MIT Press, 1993W.-K. Chen, Linear Networks and Systems (Book style). Belmont, CA: Wadsworth, 1993, pp. 123–135.
- Andrew P. Bradley “A Wavelet Visible Difference Predictor” Member IEEE Transactions on Image Processing Vol. 8. No. 5. May 1999.
- X. Zhu, S. Yao, B. Sun, Y. Qian” Image quality assessment: Combining the characteristics of HVS and structural similarity index May 2018, Harbin Gongye Daxue Xuebao/Journal of Harbin Institute of Technology 50(5):121-128.
- C, Hillar ; S, Marzen, “Revisiting Perceptual Distortion for Natural Images: Mean Discrete Structural Similarity Index”, IEEE Xplore, 4-7 April 2017.
- E. F. Navarro, M. C. Hernandez, M. N. Miyatake, H. M. P. Meana ”Visible Watermarking Assessment Metrics Based on Just Noticeable Distortion” November 2018, IEEE Access PP (99):1-1.
- Yim and A. C. Bovik, “Quality assessment of deblocked images, ”IEEE Transactions on Image Processing, vol. 20, no. 1, pp. 88–98, 2011.
- Zhou Wang, Qiang Li”, Information Content Weighting for Perceptual Image Quality Assessment, IEEE TRANSACTIONS ON IMAGE PROCESSING, VOL. 20, NO. 5, MAY 2011.
- M. Nahid, A. Bajit, A. Tamataoui, El. Bouyakhf “A New Image Psychovisual Coding Quality Measurement based Region of Interest”, World Academy of Science, Engineering and Technology World Academy of Science, Engineering and Technology 32 2007ol 32 2007
- M. Nahid, A. Bajit, A. Tamataoui, El. Bouyakhf ” Wavelet Image Coding Measurement based on System Visual Human”, Applied Mathematical Sciences, Vol. 4, 2010, no. 49, 2417 – 2429
- Nahid, M., Bajit, A., Baghdad, “A., Perceptual quality metric applied to wavelet-based 2D region of interest image coding” SITA 2016 – 11th International Conference on Intelligent Systems: Theories and Applications, 2016.
- C. Deng, Z. Li, W. Wang, S. Wang, L. Tang, A. C. Bovik “Cloud Detection in Satellite Images Based on Natural Scene Statistics and Gabor Features” IEEE Geoscience and Remote Sensing Letters, 2018.
- H. Kalva, A. Bovik, H. Chen, K. Egiazarian, Z. Wang, “Introduction to the Issue on Perception Inspired Video Processing”, IEEE Journal of Selected Topics in Signal Processing, 2014, Vol. 8 , Issue 3, pp : 355- 357