
Predictive Modelling of Student Dropout Using Ensemble Classifier Method in Higher Education
Volume 4, Issue 4, Page No 206-211, 2019
Author’s Name: Nindhia Hutagaola), Suharjito
View Affiliations
Computer Science Department, Binus Graduate Program – Master of Computer Science, Bina Nusantara University, Jakarta, Indonesia 11480
a)Author to whom correspondence should be addressed. E-mail: nindhia.hutagaol001@binus.ac.id
Adv. Sci. Technol. Eng. Syst. J. 4(4), 206-211 (2019); ![]() DOI: 10.25046/aj040425
DOI: 10.25046/aj040425
Keywords: machine learning, prediction modeling, dropout, ensemble classifier method

Export Citations
Currently, one of the challenges of educational institutions is drop-out student issues. Several factors have been found and determined potentially capable to stimulate dropouts. Many researchers have been applied data mining methods to analyze, predict dropout students and also optimize finding dropout variables in advance. The main objective of this study is to find the best modeling solution in identifying dropout student predictors from 17432 student data of a private university in Jakarta. We also analyze and measure the correlation between demographic indicators and academic performance to predict student dropout using three single classifiers, K-Nearest Neighbor (KNN), Naïve Bayes (NB) and Decision Tree (DT). We found indicators such as student’s attendance, homework-grade, mid-test grade, and finals-test grade, total credit, GPA, student’s area, parent’s income, parent’s education level, gender and age as student’s dropout predictors. The results only get 64.29 (NB), 64.84% (DT), and 75.27%(KNN) while we tried to combine algorithms with Ensemble Classifier Methods using Gradient Boosting as meta-classifier and gets better about 79.12%. In addition, we also get the best accuracy of about 98.82% using this method which was tested by 10-fold cross-validation.
Received: 15 May 2019, Accepted: 06 June 2019, Published Online: 30 July 2019
1. Introduction
Higher education tends to be a benchmark to define student education quality as a human resource. In general, higher education is considered as a reputable institute if students are qualified in their fields and get good achievements. Conversely, student’s failure will impact negatively on students and universities. At present, the problem of student failure is known as an ongoing university challenges to investigate many factors that trigger the dropout, such as academic performance, demographic, financial support, and student behavior and etc. Dropout is determined as a consequence for students who cannot complete their education until the specified study period. It makes students’ skills and ability of dropout students in their fields less than student retention and significantly affects institution quality [1].
Drop out is not a novelty thing but still being a serious topic which attracts researchers’ attention due to its impact on decreasing higher education values and can be an adverse impact on the social environment, where other prospective students lose their opportunity to study in higher education. In the last 10 years, many research has been carried out by utilizing technology to find ways how to prevent dropout issues, which is called Education Data Mining [2]. Educational Data Mining (EDM) represents a variety of algorithmic methods to address various problems in the educational system and even generates new knowledge, to calculate student’s academic performance, predict student’s behavioral and especially to predict variables or indicators that influence dropout in higher education [3].
Some indicators are widely used by researchers to predict dropouts, such as cumulative grade point average (CGPA), internal assessment, student demographics, external assessment, extra-curricular activities, high school background, and social interaction network [4]. The most potentials variables are the cumulative grade point average (CGPA) and internal evaluation indicators because its value maximizes the measurement of the student’s skills in present and future. [5] In the first two years of study, demographic indicators, especially gender were also influence learning qualities, not only occur on conventional higher education but also online program students. Dropout possibilities are also caused by age, financial constraints, student absence, parental influence, employment opportunities, marital status [6] [7].
In Indonesia, based on data statistics in 2017 [8], the dropout rate in higher education approximately about 195,176 students. Data shows dropout students’ percentage at private universities is greater than public universities. A related work in [9], 799 dropout students at educational institutions in Jakarta was examined and found dropouts usually occur in people aged 12 to 19 years who come from suburban and rural areas with a low average economic background. Low economic indicators trigger students to choose to get a job than continuing their studies in higher education. Another similar study as shown in [10], variable age and study program are also correlated to decide dropout students through the first-year study.
The main objective of this study is to find the best modeling solution in identifying dropout student indicators especially in the first two years of the study period. We will use student data from the Faculty of Social and Political Science in one of a private university in Jakarta and measure how many demographic data had a significant influence on student dropout predictions. In this major, students tend to leave study until dropout or expelled in the first trimester. This study will focus on the demographic and academic indicator and propose a predictive modeling concept by combine Decision Tree, K-Nearest Neighbor and Naïve Bayes which are widely used as statistical models to predict dropout students and optimize results using Ensemble Classification Method. The remainder of the paper is organized as follows. In Section 2, we review previous studies on the various prediction modelling in education field and also educational data mining research. Section 3 explains our research method to find classification techniques to find student dropout predictors. Section 4 presents a discussion of the results includes the evaluation of the Ensemble Classification Method as compared to several Decision Tree, K-Nearest Neighbor and Naïve Bayes methods. Section 5 concludes the study.
2. Literature Review
Educational Data Mining (EDM) is an interdisciplinary area which related to methods development to investigate a variety of unique data in the education area, which aims to understand the student’s needs and determine properly learning methods [11]. Generally, EDM is applied to predict problems in order to improve the quality both of student performance, and teaching-learning process [12]. Its concerns about how to adapt data mining methods and find patterns that are generally very difficult to solve because of massive data in the educational dataset [13]. Data mining, as a decision-making standard, has been helped in discovering dataset with different approaches such as statistical models, mathematical methods, and also machine learning algorithms [14].
Based on a review in paper [4] some theoretical algorithms are carried out to predict student performance. In her work, she found and compare accuracy between Naïve Bayes, Neural Network and Decision Tree to predict CGPA, the students’ demographics, high school, study and social network attributes as the most critical factor student passed or failed studies. Naïve Bayes has better accuracy because of attributes more significant to predict than Neural Network and Decision Tree. Another study, paper [15] compares various and appropriate data mining methods for classification in prediction, specifically to determine dominant factors in student performance predictions. It shows predictive results of Random Forest and J48 generate classification model and find the most significant factor as a determinant on student’s attainment, such as study time, academic year, age and parent education.
To identify dropout, this paper [16] have been used Artificial Neural Network, Decision Tree, and Bayesian Network to explore great potential factor. Conducting empirical research on a dataset of 3.59 million student data in an online training program, Tan discovered two attribute variables as test inputs, that is, student characteristics and academic performance. As a result, the Decision Tree algorithm was more precise to prove those variables are effectively used as key factors in student dropout prediction. As shown in this study [13], Marquez proposed a new method to optimize accuracy predictive modeling, called Modified Interpretable Classification Rule Mining. Marquez held an experiment in 419 schools to find the student dropout factors. The evaluation was performed in six phases using 60 different variables from 670 students. It results in Modified Classification Rule Mining more accurate than JRip.
Currently, predictive modeling challenges are efficiency and accuracy of various prediction models which are generally due to inadequate variables with the base classifier. Related work in [17], Decision Tree, Naïve Bayes, KNN, and Artificial Neural Network applied to generate predictive student dropout model and adopt ensemble clustering on student’s demographic detail, academic performance, and enrollment record. Experiment verified ensemble method which is used to transform original data to a new form can increase the accuracy of prediction models. Another similar study as shown in [18] discussed and examined the ensemble method able to reduce error and increase student performance prediction accuracy.
After reviewing background research, predictive modeling method has weakness in some way depend on attributes. In such conditions, accuracy may be misleading if we only have small attributes and data. In this study, we will compare Decision Tree, K-Nearest Neighbor, and Naïve Bayes and combine those methods to find the correlation between demographic and academic performance variables in dropout prediction. We will adopt an ensemble method to optimize accuracy results and also use Confusion Matrix to evaluate models.
2.1. Classification Methods
Decision Tree (DT) widely known as a popular and interesting machine learning algorithm, especially in classification. It can generate or measure pattern using a tree-structured rule and describes the relationship between variables by recursively partitioning inputs into two parts. Each part forms the decision node that is linked by a branch from the root node to the leaf node [19] [20]. In data mining, several well-known decision three algorithms, namely ID3, C4.5, CART, J48, and CHAID. In this study, the CART algorithm is used to generate models.
The k-Nearest Neighbor (k-NN) is a simple classification method that is measured based on the majority vote of its neighbors [21]. The best choice of k depends upon the data; generally, larger values of k reduce the effect of noise on the classification but make boundaries between classes less distinct. However, this method has a weakness with the presence of noisy or irrelevant features, or if the feature scales are not consistent with its importance in modeling.
Naïve Bayes as a simple probabilistic classifier can be developed easily on a large amount of data because it does not need complex parameter estimation which makes it outperform over another sophisticated method [2]. Naïve Bayes was also able to learn conditional probability feature separately so it also has been very effective in classifying small datasets. In this study, Bayes’ theorem is used to predict probability dropout.
2.2. Ensemble Classifier Method
Ensemble method is a modeling concept with multiple learners to resolve problems which called base learners. It constructs and combines a set of hypotheses to fix weakness of training data using single-learners approach [22]. We also can find solutions and collect and combine a set hypothesis from big chance hypotheses into one single prediction. As known as Importance Sampling Learning Ensembles (ISLE) framework, it shows four classic ensemble methods, namely Bagging, Random Forest, Boosting (AdaBoost) and Gradient Boosting.
This method consists of several approaches commonly used in classification to construct models that are several approaches can be used to bagging, boosting and stacking. Based on this paper [17] [18] which has been successfully used stacking approaches (stacked generalization), this study will use Gradient Boosting as an ensemble classifier and do different things to reduce error and optimize accuracy finding.
3. Research Method
The stages of this study are four-fold as shown in Figure 1. Step 1, extract variable data related to student dropouts from Academic Information System of educational institutions, construct the training data set and do feature selection using Ensemble Bagging Tree method to get the best-correlated attribute to predict dropout. Step 2, use the data to train the prediction models that were constructed based on machine learning methods such as the Artificial Neural Network (ANN), Decision Tree (DT) and Bayesian Network (BN) to derive the samples of the prediction model. Step 3, extract another section of data as a testing data set and feed it into the actual samples of the prediction model previously generated. Step 4, apply ensemble-Decision Tree to optimize and evaluate predictive modeling accuracy of student dropout.
3.1. Data Preparation
This study used the dataset of 17.432 of student’s data from the Academic Information System in Christian University of Indonesia. Sample data in this study are comprised of relevant information from students enrolled in the Faculty of Social and Political Science from 2016-2018. This dataset was purposed for classifying higher education students that potentially dropout according to academic performance. As identified from the dataset, there was a total of 17 variables associated with student’s demographic data (Table 1). The first stage of data pre-processing is handling 2355 missing data by imputing relevant value and transform all values into numerical variables in order to improve the accuracy of prediction based on the algorithm’s requirement.
Table 1: The attributes of Datasets
| Type Variable | Variable | Description |
| Demographic | school.area |
location student’s school (urban =101, suburban =102) |
| gender |
student’s gender (male =11, female =12) |
|
| age | student’s age (numeric) | |
| work.status |
student’s occupation (work =1, no occupation = 2) |
|
| marital.status |
student’s marital status (single =110, married = 120) |
|
| parent.education |
student’s parent education (no education = 0, primary school = 1, secondary school = 2, high school = 3, diploma = 4, bachelor = 5, master = 6, doctoral = 7) |
|
| parent’s income | parent’s income | |
| Academic Performance | GPA |
student’s grade point average (0 – 4) |
| homework | homework grade (0-100) | |
| final.test | final test grade (0-100) | |
| mid.test | mid-test grade (0-100) | |
| student.status |
student status (no dropout=0, dropout=1) |
|
| attendance.percentage | attendance percentage (1-100) | |
| total.credit | total credit (1-145) |
A first glimpse at the data reveals that 13856 of the data indicated students were able to successfully finish their studies, while 607 data of dropout students have been observed as dropout students. There is a big difference ratio between dropout class and retained class.
In order to tackle this problem, we do partition data into 70% training dataset and 30% testing dataset and use Synthetic Minority over-sampling Technique (SMOTE) to synthetically resampled training dataset. This method can help to improve training datasets to be optimally used in classification performance [23]. Next stage, we use algorithm Learning Vector Quantization to do feature selection with 1700 balanced data on the training dataset and performed 10-fold cross-validation with 3 repetitions to reduce bias induced by sample selection. It combines clustering and classification processes based on feed forward neural network. Inputs are propagated through a variable number of hidden layers to the output nodes.
In terms of data processing, the feature selection is the necessary steps to do because machine learning can understand data and improve prediction performance if the prediction modeling used a set of properly features. In order to select features, we use the Learning Vector Quantization algorithm to prepare some vectors in the domain of observed data samples in order to be used to classify any of the hidden vectors that are unseen. As we figured out from Figure 2, it represents the attributes selection refers to the importance level of each attribute on the dependent variable. In the feature selection process, the training process is carried out and tested using 10-fold cross-validation. It aims to calculate and measure the importance feature values based on two variables distances which are identified near or close to the variable target.
The best accuracy of this selection process is 0.9757 using the value k = 6.
 Figure 1. Research Method
The results of feature selection carried out on training data, two features of 13 variable input, including work status and marital status eliminated from the dataset.
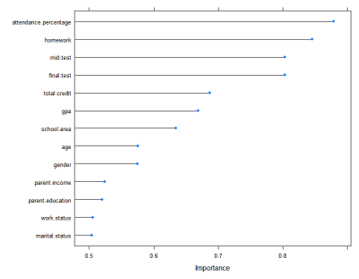 Figure 2: Feature Selection Based on Importance Score
As shown in Table. 2, the features are sorted according to importance score obtained using the Learning Vector Quantization (LVQ) technique and decide to select feature with a score greater than 50%.
Table 2. Variable Importance Value
| Variable | Importance value |
| attendance.percentage | 0.8793 |
| homework | 0.8454 |
| mid.test | 0.8033 |
| final.test | 0.8033 |
| total.credit | 0.6870 |
| gpa | 0.6691 |
| school.area | 0.6341 |
| age | 0.5752 |
| gender | 0.5747 |
| parent.income | 0.5242 |
| parent.education | 0.5195 |
| work.status | 0.5053 |
| marital.status | 0.5035 |
3.2. Confusion Matrix
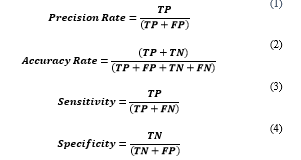
For evaluation, we use confusion matrix to measure classifier’s accuracy that is the ratio between correctly predicted results and the total number of samples. In this study, we will measure the precision rate, accuracy rate, sensitivity, and specificity.
Table 3: Confusion Matrix
| Observation Value | |||
| Predicted Object (Y) | Predicted non-Object (N) | ||
| Expectation Value | Actual Object (Y) | True Positive | False Positive |
| Actual non-Object (N) | False Negative | True Negative | |
True positive (TP) is the number of students classified as dropout students, false negative (FN) value is the number of non-dropout students classified as dropout students, true negative (TN) value is the number of non-dropout students classified as non-dropout students, false positive (FP) is the number of dropout students classified as non-dropout students. Standard formula to calculate the precision rate, accuracy rate, sensitivity, and specificity defined based on confusion matrix as shown in Eq. 1-4.
 4. Result and Discussion
In this study, we use R language and R software package (version 1.2.13) to analyze data with several machine learning methods. First of all, we do the data cleaning process such as handling missing values in the dataset and facilitate dataset with the appropriate attributes. In this case, 2,355 rows of missing values of ‘student’s attendance’ variable and 1221 rows of ‘final-test grade’ variable have values less than zero -which are not relevant to the other variables value- were eliminated from the dataset. Next, we tested normalization or data distribution in order to determine whether data distribution was normal or balanced and also will help to minimize prediction error results during the modeling process. Furthermore, impute value technique is applied to the filled missing value in parent’s income feature with its mean values in order to minimize bias in the dataset. Finally, we get 13856 data with 11 variables as variable input from the data cleaning process.
Based on distribution data, 66% of student’s data was dominated by women while men were only 34% of total data. Every student generally comes from an urban area (87%), which means most students come from urban areas while the percentage of students from suburban areas are relatively small. In addition, 95% of students are dominantly 18-23 years old while others are over 23 years old. In this case, work status is not determined as predictors because its correlation is relatively small about 250 students which are only 2% of all student’s data. The dataset also shown that almost 100% of students are single with the majority parent’s education were ‘high school’ and ‘undergraduate’ level with parents financial is predominantly low that is less than IDR 5000000. These data distribution, especially demographic features, describe that dataset has a fairly good variation to be used during student dropout prediction.
By using 9700 training data, we demonstrated also compared and discussed 3 different common classifiers performance, which is K-Nearest Neighbor (KNN), Decision Tree (DT), and Naıve Bayes (NB) as shown in Table 4 and Table 5.
Table 4: Comparison Prediction Results
|
Predictive Actual |
KNN | DT – CART | NB | |||
| Retention | Dropout | Retention | Dropout | Retention | Dropout | |
| Retention | 3951 | 52 | 3963 | 76 | 3966 | 65 |
| Dropout | 23 | 130 | 11 | 106 | 8 | 117 |
| Total | 3974 | 182 | 3974 | 182 | 3974 | 182 |
The first prediction modeling was carried out using the K-Nearest Neighbor method. The specified k-value was used with k = 5, k = 7, k = 9, and k = 11. Its best k-value was k=5 which predict with accuracy rate about 0.9820 and recall rate of prediction was 0.8497. Next prediction model, we use the Decision Tree CART method and obtain prediction accuracy about 0.9791 and recall rate of prediction of 0.9060.
Table 5: Evaluation of Prediction Results
| Evaluation Index | KNN | DT – CART | NB |
| Accuracy Rate | 0.9820 | 0.9791 | 0.9824 |
| Precision Rate of Retained Class | 0.9942 | 0.9972 | 0.9980 |
| Precision rate of Dropout Class | 0.7143 | 0.5824 | 0.6429 |
| Recall rate of Retained Class | 0.9870 | 0.9812 | 0.9839 |
| Recall rate of Dropout Class | 0.8497 | 0.9060 | 0.9360 |
| F-Measure | 0.7761 | 0.7090 | 0.7622 |
The last method was Naive Bayes which is not much different from Decision Tree, its prediction accuracy is 0.9824 with recall rate about 0.9360. To improve accuracy and predictive precision values, we implement Ensemble Stacking Classification Method to obtain better predictive accuracy. Two things are required in build prediction model using ensemble stacking method, that is weak-learner as a base-layer classifier and meta-model as a top-layer classifier that will combine K-Nearest Neighbour (KNN), Decision Tree (DT), and Naive Bayes (NB). In this paper, the algorithm iterates to find the best rules that predict student dropout using probability results of each classification methods as describes below:
|
Input : Dataset S = Base classifier (k-nearest neighbor, decision tree, naive bayes) Meta-level classifier (gradient boosting algorithm) |
|
Process : Step 1 : train dataset with base-level classifier for % train results of base classifier end; Step 2 : construct new dataset of predictions for
end; Step 3 : train dataset with meta-level classifier % train results of meta-classifier using new dataset S. |
| Output : |
The first step, we do training data with base classifier and evaluate them with 10-fold cross-validation. Next, the predictive probability is accommodated as the new input value (x) in either training or testing data so we can use it in the next modeling stage. Three new X variables will be used as predictors on modeling using Ensemble Stacking Classification Method by combining the three base-classifiers. In the last step, prediction modeling is held by using the Gradient Boosting algorithm as a meta-classifier that will classify each prediction probabilities as predictors and variable ‘student status’ as a target variable. The prediction using Ensemble Stacking Classification shown in Table 6.
Table 6: Confusion matrix for Ensemble Stacking Classification
|
Predictive Actual |
Ensemble Stacking – Gradient Boosting | Prediction | ||
| Retention | Dropout | Accuracy Rate | 0.9882 | |
| Retention | 3963 | 38 | Precision rate of Dropout Class | 0.7912 |
| Dropout | 11 | 144 | Recall rate of Dropout Class | 0.9290 |
| Total | 3974 | 182 | Error Rate | 0.0118 |
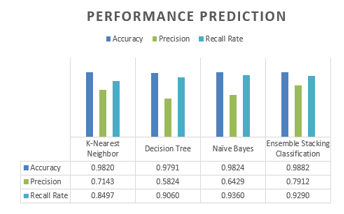 Figure 3: Comparison performance prediction between models
We get the highest accuracy rate with at 98.82%, followed by the second best method was Naïve Bayes at 98.24%. In last, the K-Nearest Neighbor method achieved an accuracy of about 98.20%, which was not much different from Naïve Bayes. As shown in Figure 3, the results of the precision predictions of the Ensemble Stacking method are not much different from the K-Nearest Neighbor even though the value was successfully increased precision percentage up to 79.12%.
Furthermore, the testing process is also found recall rates of prediction. Recall rate is a benchmark to measure modeling successfully predict rediscovering information. If we compared with its precision value, the recall rate of Ensemble Stacking method was high enough that is at 92.9%. However, the recall rate of Naïve Bayes as a single classifier is better although not much different, it gets about 93.60%.
5. Conclusion
This work aimed to describe possibilities to use data in order to help to deal with the dropout problem. Many algorithms have been involved and give a qualified insight of from simple dataset until the dataset with high complexities. In this study, the Ensemble Stacking Classification method with the Boosting Gradient algorithm as a meta-classifier can increase the accuracy of dropout predictions when it compared to a single classifier, such as K-Nearest Neighbor, Decision Tree, and Naïve Bayes. By combining those three algorithms, this method can achieve an accuracy rate of 98.82%, the precision of 79.12% and a recall rate of 92.90%. In addition, the number of false prediction called False Positive (FP) is greater than the number of false negatives (FN) prediction. It means, the performance of the Ensemble Stacking Classification method is good enough at prediction student dropouts. In this study, we also found that features that influence prediction student dropout include the percentage of student attendance, assignment scores, total credits, UTS scores, UAS scores, GPA, parental income, parent’s education, gender and age of students. However, there is an indication that academic performance is not the only reason that potentially influenced student’s dropout, but also the existence of external reasons such as study program selection and environmental influences.
There are still many shortcomings in this study, for further work we suggest to increase the number of variations correlative feature and large dataset so it will help to improve performance more better than this research, i.e. external assessment features. It also needs to do more research about feature selection method so each feature is more significant and very optimal to use in prediction modeling.
- Z. J. Kovačić, “Early Prediction of Student Success:Mining Students Enrollment Data,” pp. 647-665, 2010.
- S. M. Patil and D. P. Kumar, “Data Mining Model for Effective Data Analysis of Higher Education Students Using MapReduce,” International Journal of Emerging Research in Management &Technology, vol. 6, no. 4, pp. 177-183, 2017.
- K. B. Bhegade and S. V. Shinde, “Student Performance Prediction System with Educational Data Mining,” International Journal of Computer Applications, vol. 146, no. 5, pp. 32-35, 2016.
- A. M. Shahiri, W. Husain and N. A. Rashid, “A Review on Predicting Student’s Performance using Data Mining Techniques,” Procedia Computer Science, vol. 72, pp. 414-422, 2015.
- G. S. Abu-Oda and A. M. El-Halees, “Data Mining in Higher Education : University Student Dropout Case Study,” International Journal of Data Mining & Knowledge Management Process(IJDKP), vol. 5, no. 1, pp. 97-106, 2015.
- S. Sultana, S. Khan and M. A. Abbas, “Predicting Performance of Electrical Engineering Students using Cognitive and Non-Cognitive Features for Identification of Potential Dropouts,” International Journal of Electrical Engineering Education, vol. 54, no. 2, pp. 105-118, 2017.
- L. Bonaldo and L. N. Pereira, “Dropout: Demographic profile of Brazilian university students,” Procedia – Social and Behavioral Sciences, vol. 228, pp. 138-143, 2016.
- Kemenristekdikti, Statistik Pendidikan Tinggi Tahun 2017, Jakarta: Pusdatin Iptek Dikti, 2017.
- A. Utomo, A. Reimondos, I. Utomo, P. McDonald and T. H. Hull, “What happens after you drop out ? Transition to adulthood among early school-leavers in urban Indonesia,” Demographic Research, vol. 30, pp. 1189-1218, 2014.
- T. Fahrudin, J. L. Buliali and C. Fatichah, “Predictive modeling of the first year evaluation based on demographics data: Case study students of Telkom University, Indonesia,” International Conference on Data and Software Engineering (ICoDSE), pp. 1-6, 2016.
- A. K. Jain and C. K. Jha, “Dropout Classification through Discriminant Function Analysis: A Statistical Approach,” International Journal of Scientific Research in Computer Science, Engineering and Information Technology, vol. 2, no. 4, pp. 572-577, 2017.
- A. Katare and S. Dubey, “A Comparative Study of Classification Algorithms in EDM using 2 Level Classification for Predicting Student’s Performance,” International Journal of Computer Applications, vol. 165, no. 9, pp. 35-40, 2017.
- C. Márquez-Vera, A. Cano, C. Romero, A. Y. M. Noaman, H. M. Fardoun and S. Ventura, “Early Dropout Prediction using Data Mining: A Case Study with High School Students,” Expert Systems Journal, vol. 33, no. 1, pp. 107-124, 2016.
- A. Cano, A. Zafra and S. Ventura, “An interpretable classification rule mining algorithm,” Information Sciences, vol. 240, pp. 1-20, 2013.
- E. Osmanbegovic, M. Suljic and H. Agic, “Determining Dominant Factor for Students Performance Prediction by Using Data Mining Classification Algorithms,” Tranzicija, vol. 34, no. 34, pp. 147-158, 2014.
- M. Tan and P. Shao, “Prediction of Student Dropout in E-Learning Program Through the Use of Machine Learning Method,” iJET, vol. 10, no. 1, pp. 11-17, 2015.
- N. Iam-On and T. Boongoen, “Improved student dropout prediction in Thai University using ensemble of mixed-type data clusterings,” International Journal of Machine Learning and Cybernetics, vol. 8, no. 2, pp. 497-510, 2017.
- O. W. Adejo, “Predicting student academic performance using multi-model heterogeneous ensemble approach,” Journal of Applied Research in Higher Education, vol. 10, no. 1, pp. 61-75, 2018.
- D. T. Larose and C. D. Larose, Discovering Knowledge in Data : An Introduction to Data Mining, 2nd ed., Canada: John Wiley & Sons, Inc., 2014.
- V. Kotu and B. Deshpande, Predictive Analytics and Data Mining : Concepts and Practice with Data Mining, USA: Elsevier, 2015.
- F. Marbouti, H. A. Diefes-Dux and K. Madhavan, “Models for early prediction of at-risk students in a course using standards-based grading,” Computers & Education, vol. 103, pp. 1-15, 2016.
- Y. Pang, N. Judd, J. O’Brien and M. Ben-Avie, “Predicting Students Graduation Outcomes through Support Vector Machines,” IEEE Frontiers in Education Conference (FIE), pp. 1-8, 2017.
- A. Ramezankhani, O. Pournik and J. Shahrabi, “The Impact of Oversampling with SMOTE on the Performance of 3 Classifiers in Prediction of Type 2 Diabetes,” Ramezankhani, A., Pournik, O., Shahrabi, J., Azizi, F., Hadaegh, F., & Khalili, D. (2014). The Impact of Oversampling with SMOTE on the Performance of 3 Medical Decision Making, vol. 36, no. 1, p. 137–144, 2016.