Dysphoria Detection using EEG Signals

Adv. Sci. Technol. Eng. Syst. J. 4(4), 197–205 (2019);
 DOI: 10.25046/aj040424
Dysphoria is a state faced when one experienced disappointment. If it is not handled properly, dysphoria may trigger acute stress, anxiety and depression. Typically, the individual who experienced dysphoria are in-denial because dysphoria is always being associated with negative connotations such as incompetency to handle pressure, weak personality and lack of will power. To date, there is no accurate instrument to measure dysphoria except using questionnaire by psychologists, such as: Depression, Anxiety and Stress Scale (DASS) and Nepean Dysphoria Scale (NDS-24). Participants may suppress or exaggerate their answers resulting in misdiagnosis. In this work, a theoretical Dysphoria Model of Affect (DMoA) is developed for dysphoria detection. Based on the hypothesis that dysphoria is related to negative emotion, the input from brain signal is captured using electroencephalogram (EEG) device to detect negative emotions. The results from analyzing the EEG signals were compared with DASS and NDS questionnaires for correlation analysis. It is observed that the proposed DMoA approach can identify negative emotions ranging from 55% to 77% accuracy. In addition, the NDS questionnaire seems to provide better distinction for dysphoria as compared to DASS and is similar to the result yielded by DMoA in detecting dysphoria. Thus, DMoA approach can be used as an alternative for early dysphoria detection to assist early intervention in identifying the patients’ mental states. Subsequently, DMoA approach can be implemented as another possible solution for early detection of dysphoria thus providing an enhancement to the present NDS instruments providing psychologists and psychiatrists with a quantitative tool for better analysis of the patients’ state.
1. Introduction
Stress is a condition experienced when an individual face a pressure or strain from adverse or demanding circumstances [1]. The individual life satisfaction is undermined when difficulties and challenges happen; ranging from the daily annoyances of the consequences of overstretched, time-pressured lifestyle such as traffic jams, lateness and work incompetency to the unexpected events faced in workplace, family lives, interpersonal relationship or even interaction with environment, such as road accident, bankruptcy, demise of a loved ones, loss of a pet or even handling natural disasters like flood or drought.
Stress can cause positive reinforcement as it can be the source of motivation. For instance, healthy competition in workplace can boost morale of a worker to work harder and produced better results. However, if stress is not handled correctly, it can lead to other medical issues, such as; headaches, upset stomachs, anxiety, depression and other undesirable circumstances. [2]. Moreover, long term stress can contribute to other productivity issues, for example; high rate of absenteeism, high labour turnover, inefficient workforce and even high rate of accidents [3]. Hence, it is important to detect stress before it can be worse.
Generally, the number of individuals in every generation experienced stress level are increasing. This finding has been reported in a comprehensive study by American Psychological Association (APA) [4] with 23% and 37% are recorded for millennials and older adults respectively from 2014 to 2017. The study segregated participants into four groups based on age, as follows; Millennials (18–38 years), Gen X-ers (39–52 years), Baby Boomers (53–71 years) and Older Adult (72 years and above). The survey was conducted online within the United States with participation of 3361 of adults. Figure 1(a)-(d) illustrate the American stress level by generations from 2014 till 2017.
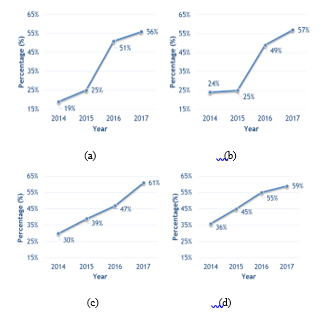 Figure 1: Graph of Stress Level Based on Generation. (a) Older Generation (b) Baby Boomers (c) Gen X-ers and (d) Millennials [4]
The survey results in Figure 1 show that higher number of younger generation experienced stress compared to Older Adult. Older Adults had the least stress levels as presented in Figure 1(a). Such trend is observed to be consistent from 2014 till 2017. This scenario may be linked to work stress as Older Adults typically have retired and are not formally working therefore their stress level is lower than younger generation who are still in employment. However, the highest change is observed in the year of 2015 to 2016 for Older Adults with 26% spike followed by 24% spike for Baby Boomers in the same duration as shown by Figure 1(b). This situation may be related to the United States Presidential Election that happened in 2016. The Baby Boomers and the Older Adults groups are highly affected as they are more in tune with the US political scenario as compared to the younger generations. Additionally, the survey revealed that a critical increment in the number of Americans who had encountered at least one symptom of stress in the previous month is observed from 71% in 2016 to 75% in 2017. Hence, the trend of stress experienced by individual is on the rise.
The finding by American Psychological Association [4] is consistent with the National Health and Morbidity Survey (NHMS) [5, 6] discovery that the trend of stress is rising, and it is reflected in the high leap of patients who suffer from mental illness as presented in Figure 2. In 2011, a total of 24,498 respondents were successfully interviewed and 6.3% reported to have mental health problem in Malaysia [5]. However, the NHMS V (2015-2018) survey [6] reported that 29.2% Malaysian adults aged 16 years and above in Malaysia experienced mental health problem. Such pattern shows a large increase over the last 4 years with almost four folds increment with factors such as younger Bumiputras female adult from low-income family is predicted to be at higher risk to experience mental health problem [5]. The report also mentioned that early recognition/detection and early treatment of depression must be enhanced.
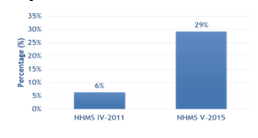 Figure 2: Mental Health Among Adult in Malaysia
Before an individual experienced stress, a state called dysphoria will be endured. Dysphoria can be defined as an emotional state with high degree of complexity and have a close relation to negative mood and in some cases can lead to frustration and dissatisfaction [7]. Dysphoria is usually connotated to anxiety, depression and stress, and can be experienced by any individuals at any time. Typically, dysphoria is viewed as everyday response once an individual face disappointment in his/her life. Figure 3 illustrates the simplified stages of mental cycle in handling disappointment [8]. Dysphoria is viewed as a starting point of either positive or negative adaptation states starting with normal condition to the circumstances when an individual faces a disappointment. When the individual cannot adapt to the dissatisfaction or disappointment, it can lead to dysphoria where the state of frustration is intense thus can lead to clinical depression or stress. On the other hand, the individual who is able to adjust and adapt to the disappointment may be able to carry out his life normally through adaptation. Since emotion indicates the mental state of an individual and is closely related to dysphoria emotion measurement methods is adopted [9]. Hence, the negative emotion that one experienced after disappointment can be empirically measured.
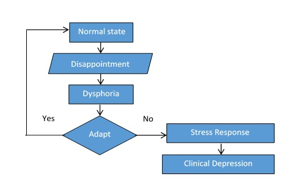 Figure 3: Mental cycle of handling disappointment
In this work, a Dysphoria Model of Affect approach is proposed to measure dysphoria from the brain signals captured using electroencephalogram (EEG) device. Such model can provide a datum for better comparative analysis with the standard psychological instruments to understand dysphoria such as DASS-21 and NDS-24 questionnaires. This is to eliminate the need to validate the patient’s answer by directly using neurophysiological input of the individual because patient have tendency to exaggerate or suppress the answers. Because dysphoria is very much related to negative emotion, emotion recognition methodology is adopted. For simplification, the working definition of dysphoria in this work is the state after disappointment of event that is prior to stress and it is always be associated with negative emotions [8].
This paper is organized in the following manner. Section literature review provides a summary of researchers concentrated efforts to recognize dysphoria and the fundamental concepts of dysphoria study are discussed. The methodology of the proposed approach of Dysphoria Model of Affect (DMoA) is presented in Section 3. The data collection, experimental result and discussion are given in Section 4. Subsequently, this paper concludes with conclusion and future work in Section 5. This paper is an extension of work originally presented in 2018 12th International Symposium on Medical Information and Communication Technology (ISMICT) [8].
2. Literature Review
2.1. Dysphoria and Psychological Instruments
Commonly, dysphoria is associated with depression, stress and anxiety [7,10,11,12]. Dysphoria is associated with depression because it shares the same features of depressive syndrome and dysphoric mood, such as sadness, despondence, despair, and others as suggested by [10]. Such notion is supported by Berner, Musalek & Walter [11] that the term dysphoria should be restricted to a condition of a morose, tense and irritated mood. It can also be recognized from stable and unstable mixed state. Moreover, anxiety may also refer to dysphoria because both have tension and the underlying hyperarousal in common. Dysphoria and anxiety can be experienced at the same time because dysphoria may happen due to long-standing stress. It is not uncommon for anxiety to arise on the background of dysphoric mood. In a certain personality disorder, dysphoria also can be incorporated such as affective instability, irritability, intense anger, and profound unhappiness [12]. These characteristics are shared or overlap with features of dysphoria. Furthermore, Starcevic et al. [7] stated that dysphoria is also associated with depression, interpersonal sensitivity, hostility and stress, reflecting broad but also complex and relatively non-specific relationship.
Dysphoria is assessed using several psychologists’ instruments such as the Nepean Dysphoria Scale (NDS) [13], the Depression, Anxiety, Stress Scales (DASS) [14], the Beck Depression Inventory II (BDI II) [15], Perceived Stress Scale (PSS) [16], and the Anxiety Sensitivity Index (ASI) [17]. Typically, the participants are forced to select one answer from the fixed choice response format [18]. The participants need to respond to a series of standard measurement for attitude questions about a pre-determined topic that allow the degree of opinion rather than a simple yes and no answer. Such data enables better quantitative data analysis. The questionnaires can be provided to participants of either online or off-line dissemination method depending on the geographical availability of the participants. In summary, the PSS questionnaire is focusing on measuring the level of stress [16], the BDI-II can measure the level of depression [15] and the level of anxiety of an individual can be measured using the ASI instrument[17]. Based on the dysphoria descriptions that are being discussed earlier, dysphoria is very related to depression, anxiety and stress. All these factors can be measured using DASS [14] and NDS [13] questionnaire. It is expected to observe strong positive correlations between scores on the NDS and scores on the DASS-21. Hence, for the purpose of this work, both questionnaires are used to investigate dysphoria. The summary of the questionnaire and its focus is presented in Table 1.
Table 1: Summary of Questionnaire and Its Focus Study.
| DASS | PSS | BDI-II | ASI | NDS | |
| Depression | √ | √ | √ | ||
| Anxiety | √ | √ | √ | ||
| Stress | √ | √ | √ |
The DASS-21 test is the psychological instrument to measure depression, anxiety and stress of an individual. It consists of 21 questionnaires and is able to measure the degree of depressions, anxiety and stress of the participant taking the test [14]. The participants are needed to specify indication of a symptom over the previous week based on a 4-point Likert scale. Each answer is recorded from 0 (did not apply to me at all over the last week) to 3 (‘applied to me very much’ or ‘most of the time over the past week’). Calculation on the degree of depression (D), anxiety (A) and stress (S) is indicated is provided where every item of the questionnaire is related to either D, A or S score. The cumulative score of the D, A and S are used to indicate the level of severity, namely; normal, mild, moderate, severe and extremely severe. A trained psychologist or psychiatrist is needed to interpret the results and thus providing a more meaningful diagnostic for the patient.
The Nepean Dysphoria Scale (NDS) is a set of questionnaires to measure the severity of dysphoria [13] and expects participants to give evaluation of the frequency on a scale from 0 to 3 ranging from ‘not at all’, ‘always’, ‘every day’ to ‘most of the time’. In this questionnaire, there are 4 factors that are being observed, namely; irritability, discontent, surrender and interpersonal resentment. Based on the summation of the score gathered from the itemized questions, the correlation matrix factor of NDS are calculated. The specified weightages are then used to get the maximum and average value of the scale. The value yielded are then compared to get the severity category of either normal, mild, moderate and severe.
2.2. Dysphoria and Negative Emotion
Dysphoria has recently been conceptualized as a complex emotional state that consists of discontent and/or unhappiness and a predominantly externalizing mode of coping with these feelings [7]. Many researchers relate dysphoria to negative emotions [10,11]. Dysphoria is also used as synonym for sadness or depression which describe a mixture of negative and unpleasant emotions [19].
A study by Caseras, Garner, Bradley and Mogg [20] examined the eye movement of the participants on negative images. The participants are grouped into dysphoric and nondysphoric group. In the experimental results, it was observed that dysphoric group have the tendency to look at the negative images longer than the control images as compared to the time taken by the nondysphoric group. This result is in line with another work by McMakin, Santiago and Shirk [21] that observed the experiential reactivity to emotion in dynamic moment. Experimental results revealed that individual with dysphoric tendency and those who have not are equally responsive to both negative and positive film clips regardless of their dysphoric level. However, dysphoric group shows a lower ability to maintain positive emotion when they are looking at the positive film clips. Hence, it can be said that dysphoria is always associates with negative emotions.
The negative emotions are located in the negative valence axis region of Affective Space Model (ASM) [22]. The ASM consists of three main emotion primitives; namely: valance, arousal and dominance. The emotion primitives are actually the descriptive generic attributes of an emotion. These attributes function as constituents that act as a fully complementary description of the emotion. The affective space model can be divided into quadrants where each quadrant represents positive or negative value of the emotion primitives. The horizontal axis represents the valance value that indicates whether the emotion is perceived as positive or negative whereas the vertical axis representing the arousal which indicates the level of activation from passive to active. In this work, the focus is given on valence since valence is the effect of the emotion to an individual of either positive effect or otherwise. Figure 4 shows the Schlosberg’s Model of Affect where dysphoria is labelled in pink rectangle in quadrant 2 and 3. Dysphoria happens at negative valance values regardless of its arousal of either active or passive.
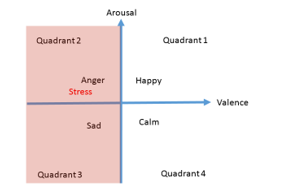 Figure 4: Model of Affect [22]
2.3. Dysphoria and Electroencephalogram (EEG)
Further reading shows that some researchers using EEG in dysphoria understanding. Siegle, Condray, Thase, Keshavan and Steinhauer [23] investigated the Gamma band in EEG signal in relating to emotional states for healthy, depressed and schizophrenia adults. The emotion condition assessment is using 3 methods; which are, never-depressed healthy controls, Diagnostic and Statistical Manual of Mental Disorders (DSM-IV) unipolar major depressive disorder and DSM-IV schizophrenia. During the assessment, the patients need to judge their own emotion of either positive, negative or neutral based on the words appearing on the screen of laptop. It is observed that depressed individual displayed both sustained and increased gamma-band EEG signals activity throughout the task while adults with schizophrenia displayed decreased gamma-band EEG signals activity. It is also observed that schizophrenia subjects displayed more affinity responses to negative word compared to neutral words and not significantly faster to positive than neutral words. Based on this study, it can be summarized that there are different responses towards negative words depending on either the patients suffer from schizophrenia or otherwise. Such responses can be monitored using the EEG signals produced by the depressed and schizophrenia groups.
From previous studies [7,8] it is noted that dysphoria is very much affiliated to negative emotions, thus it is proposed to use the electroencephalogram (EEG) in measuring the negative emotion of the individual and relate it the dysphoria. Lin et. al [24] applied machine learning algorithms to categorize EEG signals on emotional states during music listening. The main purpose of the research is to search emotion-specific features of the EEG signals and test the efficacy of different classifiers. The Valance-Arousal model is used as comparator of emotion. 26 subjects were instructed to keep their eyes closed and remain seated while listening to the sixteen excerpts from Oscar’s film soundtracks and the EEG signals were recorded. Features are extracted using the Differential Asymmetry of 12 Electrode (DASM12), Rational Asymmetry of 12 Electrode (RASM12), Power Spectrum Density of 24 electrode (PSD24) and Power Spectrum Density of 30 electrode (PSD30) while Multi-Layer Perceptron (MLP) and Support Vector Machine (SVM) are used as classifier. As a result, SVM obtained an improvement classification performance from 81.52% ± 3.71% to 82.29% ± 3.06% compared to MLP classifier. The best result recorded were using DASMI12 using SVM as classifier. This study also concluded that the sensitivity metric for characterizing brain dynamic in response to emotional state (joy, angry, sadness and pleasure) are depending on the spectral power asymmetry across multiple frequency bands using DASM12.
Moreover, Sourina and Liu extended the work to recognize emotion from Fractal Dimension (FD) based algorithm using EEG signals [25]. The FD values are calculated from the EEG signal recorded from the corresponding brain lobes and mapped on the 2D emotion model. The International Affective Digitized Sounds (IADS) and music pieces labelled by other subjects with emotions using a questioner are used as stimuli to generate emotion to the subjects during the assessment. As a result, the FD were able to detect emotion with only using 3 electrodes and the data can be mapped into 2D Arousal–Valance model. The accuracy of 72% to 100% are recorded for arousal and valance level.
Based on the study of other researchers, we combine the understanding yielded from EEG emotion recognition and insights gathered from the DASS and NDS questionnaire to understand dysphoria. Figure 5 summarises the correlation between EEG, questionnaire and dysphoria.
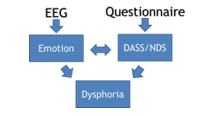 Figure 5: Overview of Correlations between DASS-21/NDS-24, Emotion and Dysphoria
3. Methodology
A theoretical framework of Dysphoria Model of Affect is presented in Figure 6. It consists of five phases, namely; data collection, pre-processing, feature extraction, classification and correlation analysis. Detailed description of each phase is presented in the next sub-sections.
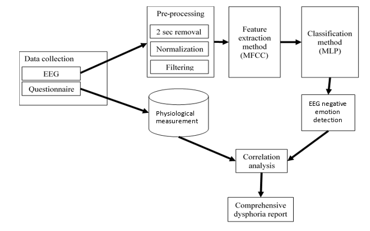 Figure 6: Theoretical Framework of Dysphoria Model of Affect (DMoA)
3.1. Data collection
In this preliminary work only four participants data were collected based on two type of inputs from the psychological instruments (DASS-21) and from the brainwave patterns using the captured EEG signals. The participants are healthy male with no medical record of experiencing acute depression, anxiety and stress with age mean of 27.5 years and variance of ±2.19 years. The participants also indicated that they are under the influence of medicine, drug or alcohol and voluntarily signed the consent form to adhere the IIUM ethic committee procedure.
Prior to taking the brainwave signal using the EEG device, all participants need to fill up two questionnaires namely; the personal information and also the DASS-21 questionnaires. This is to ensure that all four participants do not have any history of acute depression, stress or anxiety. Participants were first briefed about the experiments and were required to sign a consent form as needed by the IIUM ethics committee. To ensure consistency and to relate the study of psychological instruments to the brainwave patterns each individual was required to do the DASS-21 and the NDS-24 questionnaires prior to taking the individual brainwave pattern using the EEG device.
The DASS and NDS questionnaires results are gathered from each of all 4 subjects. The participants are asked to answer the questionnaire truthfully and to take their time to select the most appropriate answer for the questions. The participants can ask the meaning of the word in the questionnaire if they are unsure. This is to minimize misunderstanding that can lead to wrongly selected answer. The DASS questionnaire consists of 21 questions and the NDS questionnaire consists of 24 questions. The participants must answer all questions by selecting their choice in the questionnaire sheet. Once the participants finish answering the task, the questionnaire sheets are collected. Further analysis will be conducted based on the answers given by the participants.
In order to investigate the brainwave patterns signals recorded from the EEG device, the resting state of the participants need to be captured as a measurement basis. It consists of one minute of eyes close and eyes open. Then, it is followed with the reference emotion test based on the International Affective Pictures Systems (IAPS) [26] to analyse the responses of the different parts of the brain to four basic emotions of happiness, sadness, calmness and fear in one minute each respectively. In addition, sadness and fear video stimuli were presented to examine the negative emotion responses of each participant [8]. A final resting state data were collected based on a one minute each of eyes-open and eyes close after the video stimuli. The overall time taken for data collection in this work is 10 minutes without considering the pre-EEG experiment and post-EEG experiment tasks. Also note that all the EEG signals were captured and stored as numeric values to ensure compatibility of data using CSV file format. Table 2 shows the protocol that has been set for the data collection that consists of several condition which is resting state, emotional test and video stimuli.
In the EEG data collection, the raw 19 channels EEG signals are captured using EEG device from BrainMarker. The device allows 19 channels EEG to be captured. However, in this work, only 6 channels are considered; namely, F3, F4, F7, F8, FP1 and FP2 to measure the negative emotion. These six channels are selected because signals from frontal brain are relevant to emotion processing according researchers [27, 28, 29] hence contains a lot of emotion information.
3.2. Pre-processing
Artifact and noise cancellation consist of three steps, namely; removing the first 2 seconds of the EEG signals, normalization and filtering. The pre-processing phase is important to ensure the analyzed data are in the region of interest and not biased or distorted by the effect of artifact and noise. Otherwise the data is regarded as inaccurate and misleading. The first 2 second of the 1-minute data of each protocol typically consists of 500 instances depending on the size of selected window size. The removal of this data is because it may not contain any useful information as the participant just starts to focus their attention to discriminate the emotion based on the presented stimuli. Then, the time vs frequency domain signals are then mapped into 19 channels to be extracted (19 channels x 14,500 instances). For the purpose of this study, only 6 channels data are considered to focus on the data of the brain frontal region.
The data from the 6 channels are normalized to [0,1] and filtered using the elliptical filter. The elliptical filters are employed to ensure to get the cut off frequency/clean signals before going through feature extraction process. The EEG signals that are higher than 50Hz are also eliminated on the grounds that such data are usually artefacts gathered from various hand, eye and muscle movements.
3.3. Feature Extraction
Once the noise and artefacts are removed, relevant features are extracted for classification purposes. In this work, Mel Frequency Cepstral Coefficient (MFCC) feature extraction method is employed. In MFCC, window size and framing are two main components to observed. Windowing is a technique to cut the large signal into a manageable size for processing and analysis. Windowing is done for minimizing the disruptions at the starting and at the end of the frame, the frame and window function is being multiplied. If the window size selected is too large, the difference maybe too minimal for analysis whereas if the selected window size is too small, the information may not be enough for analysis. Frame is the process of dividing the signal in window into small frames to have reliable information. In the framing process, the raw EEG signals are blocked into small frames of N samples, with next frames separated by M samples (M<N) with this the adjacent frames are overlapped by N-M samples. This procedure of segregating up the signals into frames will proceed until the whole raw EEG signal is separated into small frames. Segregation of frame will make the computation more effective in term of time and processing. In this work, window type used is Hamming window with number of coefficients of 12 resulting to 12 features are extracted for each channel making it 72 features in total.
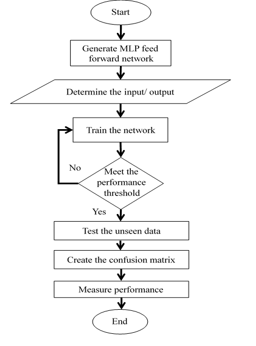 Figure 7: Flow Chart for Emotion Classification
3.4. Classification
Data are arranged according to the experimental set up needs after the relevant features are extracted. In this work, k-fold validation technique is adopted. The data are randomly partitioned into 5 groups where each approximately have an equal size. One group is used for testing while the other four groups are used for prior training. The process is iterated until all fold are used for testing.
In this work, Multi-Layer Perceptron classifier is adopted based on prior work findings [8,29]. The steps of using the MLP are simplified in the flowchart in Figure 7. Input are feed to the 72-neurons input layer before they are passed to the 10-neurons hidden layer. Then, the summation process is conducted in the output layer. The weights of the learning function of each node are iteratively improved until the performance threshold is met.
4. Result and Discussion
There are two types of experiment conducted in this work, namely; emotion recognition and emotion identification. For emotion recognition task, specific emotion is checked whether it is available or not. It is a 2-class classification task. Subsequently, the emotion identification task segregates the emotion individually and compare the intended emotion to the data pool.
4.1. Emotion Detection
The emotion detection experiment is conducted to discern the existence of specific emotion in a pool of instances. The data are arranged for two-class classification task, for instance; happy versus not happy, fear versus not fear, sad versus not sad and calm versus not calm. The emotion data consists of 67 instances and the data that opposed of the specific emotion are the combination of 1/3 of each other emotions. The total number of instances for the experiment is 134 instances. Features extracted are 72 instances gathered from 12 MFCC coefficients from the six EEG channels of F3, F4, F7, F8, FP1 and FP2. The average of the ten iterations of the experiments are presented in Figure 8(a)-(d). As a comparison, the results gathered from WEKA are also presented. Results from WEKA are used as the base result because the WEKA results are consistent. From the experimental results, it is observed that the result obtained from MLP from Matlab (denoted as MLP) gives higher accuracy as compared to WEKA with increment of 10% to 16% accuracy. The best performance was recorded by MLP for Happy vs Not Happy experiment from Subject4 with performance of 95.5%. The worst performance was recorded by Calm vs Not Calm for Subject3 with performance of 58.2%.
4.1. Emotion Identification
The emotion identification experiment is conducted to observe the ability of the classifier to predict the specific emotion given a pool of different emotion data. The data are arranged in such a way that all emotion has a similar number of instances (67 instances each) gathered from the frontal EEG signals of F3, F4, F7, F8, FP1 and FP2 for all participant. Table 3 shows the detailed MLP experimental result accuracy for emotion identification. Each experiment is repeated 10 times because the MLP performance in Matlab may have difference of ±10%.
From the result in Table 3, it is distinguished that the highest emotion identified is happy by Subject4 which achieved 97.01% accuracy. On the contrary, the lowest emotion identified is fear by Subject3 which yielded 11.94% accuracy. The result then is summarized as in Table 4. Subject4 managed to record the highest average performance for emotion identification whereas the worst performance is yielded by Subject2 with accuracy of 64.51%. It is also observed that MLP managed to achieve accuracy ranging from 64.51% to 76.72% as compared to WEKA with accuracy ranging from 55.97% to 63.81% that show slight superiority of MLP as compared to WEKA.
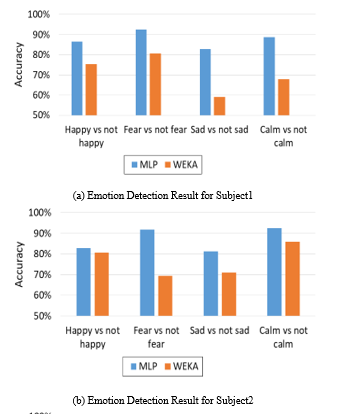
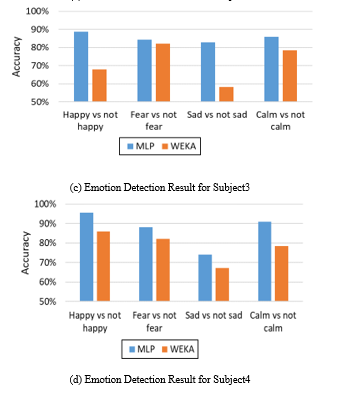 Figure 8: Emotion Detection Result using WEKA and MLP Classification
4.2. Emotion Identification for Video Stimuli
Further analyses are conducted to see the difference in performance of using different media of stimuli, namely; static images and videos. For video stimuli, two videos of sad and fear videos are selected. Figure 9 and Figure 10 show the emotion identification experimental results for fear and sad videos respectively.
Figure 9 shows the bar chart of the experimental result yielded when using fear video. Based on the result, fear is consistently detected for Subject2, Subject3 and Subject4 with accuracy ranging from 33.1% to 37.1%. Subject1 recorded Calm as the highest emotion with difference of 3.5% lower than Fear. However, for the emotion experimental result Figure 10 shows the bar chart result for sad video using emotion identification network. Based on the bar chart, the highest emotion detected is fear in Subject4. Only Subject2 shows the highest sad emotion detected. This result shows inconsistency during video stimuli. This may due to the surrounding when eye open, the information enters through the eye in form of light. This information will react to the brain for visual perception.
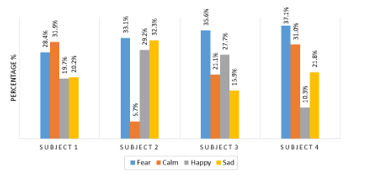 Figure 9: Emotion Identification Result using Fear Video
Extension of the comparison between the effect of emotion elicitation using dynamic emotional contents (video) and static images emotional contents (IAPS) are conducted. Figure 11(a)-(d) show the comparative accuracy of emotion recognition experiments between static images and videos for each subject.
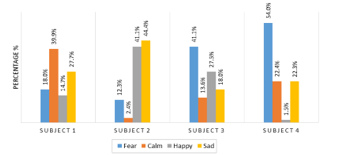 Figure 10: Emotion Identification Result using Sad Video
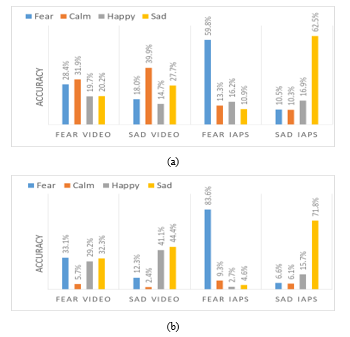
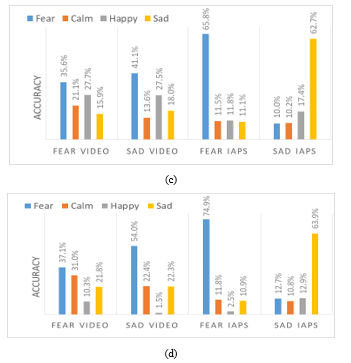 Figure 11: Result Comparison for Emotion Identification Result using Static Images and Videos for (a) Subject1 (b) Subject2 (c) Subject3 and (d) Subject4.
From the experimental results in Figure 11, the emotion identification result using static emotional contents outperformed the dynamic emotional content in all experiments. The highest accuracy achieved is fear IAPS with 83.6% for Subject2. Meanwhile the lowest accuracy is sad video for Subject4 with 1.5%. This is because the brain needs to process more information when video stimuli is exhibited instead of static images displayed in IAPS stimuli. Hence, lower performance is recorded.
4.3. Questionnaire result: DASS-21 & NDS-24
Table 5 and 6 shows the summary result of the DASS-21 and NDS-24 results respectively for all subjects. According to the depression, anxiety and stress score scale, all participants are in a normal condition. None any of them shows any negative result. However, in Table 6, Subject1 and Subject2 results indicated that they are in mild state as compared to Subject4 that recorded moderate and severe for Subject3 respectively. This result gives better insight as compared to the DASS-21 results that only indicate the participants are normal. Hence, the NDS is able to give more information about the participants’ state as compared to the DASS-21 questionnaire and the DASS-21 questionnaire cannot be directly used to determine whether the subject is having dysphoria or otherwise.
4.4. Correlation between DASS-21, NDS-24 & EEG emotion identification
From the emotion identification experiments as in Table 7, fear is highly detected during the eye close which is in line with NDS-24 result that is severe for Subject3. There seems to be correlation between EEG emotion identification and NDS-24. However, it is not highly observable on Subject 1, 2 and 4 because NDS-24 result for each subject is only mild and moderate.
Table 7: Eye Close and Eye Open Before Experiment Training with Emotion Identification MLP Architecture
| Emotion | Before stimuli | After stimuli | |||
| Eye close | Eye open | Eye close | Eye open | ||
| Subject 1 | fear | 37.5% | 43.0% | 22.4% | 43.0% |
| calm | 35.1% | 25.1% | 34.6% | 25.1% | |
| happy | 15.7% | 24.8% | 17.8% | 24.8% | |
| sad | 11.8% | 7.2% | 25.2% | 7.2% | |
| Subject 2 | fear | 41.5% | 17.9% | 1.2% | 17.9% |
| calm | 10.9% | 11.0% | 5.4% | 11.0% | |
| happy | 31.4% | 33.9% | 52.0% | 33.9% | |
| sad | 16.3% | 37.2% | 41.5% | 37.2% | |
| Subject 3 | fear | 70.9% | 12.2% | 75.7% | 12.2% |
| calm | 20.0% | 16.4% | 9.7% | 16.4% | |
| happy | 4.0% | 45.7% | 5.4% | 45.7% | |
| sad | 5.1% | 25.7% | 9.3% | 25.7% | |
| Subject 4 | fear | 26.4% | 49.4% | 1.0% | 49.4% |
| calm | 19.6% | 18.1% | 16.9% | 18.1% | |
| happy | 46.3% | 27.9% | 76.9% | 27.9% | |
| sad | 7.8% | 4.6% | 5.2% | 4.6% | |
5. Conclusion
The Dysphoria Model of Affect (DmoA) uses the neurophysiological data from the EEG devices and by extracting the emotional information from the brainwave patterns different emotions can be detected during the initial state of eyes closed. Such information are very useful in analyzing the mental state of an individual. In this preliminary study, the implementation of DmoA seems to be able to differentiate different classes of emotion fairly well thus resulting in a better tool for early detection of dysphoria as depicted by the NDS-24 results for Subject3. It is also observed that the DASS-21 questionnaire result could not differentiate dysphoria for all the subjects in this work. There are other psychological instruments that can be studied for detail analysis of dyphoria but would be expensive and require experts to interpret score. The proposed DMoA approach provides a new avenue for psychologist and psychiatrist to venture using EEG devices as tools for analyzing dysphoria, depression, anxiety and stress and can also be used in understanding personality traits or behaviour [29].
Acknowledgment
The authors would like to thank MARA University of Technology, Malaysia (UiTM) and Ministry of Education Malaysia (KPM) for providing financial support through the Fundamental Research Grant Scheme FRGS (600 – RMI / FRGS 5/3 (106/2014)) to conduct the work published in this paper.
- Kranner, I., Minibayeva, F. V., Beckett, R. P. & Seal, C. E. (2010). What is Stress? Concepts, definitions, and applications in seed science. New Phytologist. 188: 655–673.
- Edwards, J. (2015). Fundamental facts about mental health 2015, Mental Health Foundation, United Kingdom
- Mallow M. S. (2016). Occupational Stress in Malaysia: Causes, Effects and Possible Solutions, In Proceedings of 3rd International Conference on Education, Social Sciences and Humanities (SOCIOINT 2016), 82-88, Istanbul, Turkey.
- Poll H., American Psychological Association (APA) (2017). Stress in America: The state of our nation. Stress in America Survey.
- Institute of Public Health (IPH), National Health and Morbidity Survey (2011). NHMS 2011, Vol. II: Non-communicable diseases, Ministry of Health Malaysia, ISBN: 978-967-3887-68-2.
- Institute of Public Health (IPH), National Health and Morbidity Survey (2015). NHMS 2015, Vol II: Non communicable diseases, risk factors and other health problems, Ministry of Health Malaysia, ISBN: 978-983-2387-23-7.
- Starcevic, V., Berle, D., Viswasam, K., Hannan, A., Milicevic, D., Brakoulias, V., Dale, E. (2015). Specificity of the Relationships between Dysphoria and Related Constructs in an Outpatient Sample, Psychiatr Q, Vol 86: 459–469
- Kamaruddin, N., Nasir, M. H. M. and Wahab, A. (2018). EEG Affective Modelling for Dysphoria Understanding. In 2018 12th International Symposium on Medical Information and Communication Technology (ISMICT), 1-6.
- Kamaruddin, N., Wahab, A. & Quek, C. (2012). Cultural Dependency Analysis for Understanding Speech Emotion, Expert System with Application (ESWA), 39(5): 5115-5133.
- Snaith, R. P., & Taylor, C. M. (1985). Irritability: definition, assessment and associated factors, The British Journal of Psychiatry, 147(2), 127-136
- Berner. P., Musalek. M., Walter H. (1987) Psychopathological Concepts of Dysphoria. Psychopathology, 20:93–100
- Starcevic, V. (2007). Dysphoric about dysphoria: towards a greater conceptual clarity of the term, Australasian Psychiatry, Vol 15(1): 9 -12.
- Berle, D. & Starcevic V. (2012). Preliminary validation of the Nepean Dysphoria Scale, Australasian Psychiatry, 20(4) 322–326.
- Lovibond, P.F. & Lovibond, S.H. (1995). The structure of negative emotional states: Comparison of the Depression Anxiety Stress Scales (DASS) with the Beck Depression and Anxiety Inventories. Behaviour Research and Therapy, 33, 335-343.
- Beck, A. T., Steer, R. A. & Brown, G. K. (1996). Beck Depression Inventory manual 2nd ed San Antonio: Psychological Corporation.
- Cohen D., Kamarck T., & Mermelstein R. (1983). A global measure of perceived stress, Journal of Health and Social Behavior, 24: 386-396.
- Reiss, S., Peterson, R. A., Gursky, D. M. (1986). Anxiety sensitivity, anxiety frequency and the prediction of fearfulness. Behav Res Ther, 24: 1–8.
- Likert, R. (1932). A technique for the measurement of attitudes, Archives of Psychology, 140: 1–55.
- D’Agostino, A., Manganelli, E., Aportone, A., Monti, M. R., Starcevic V. (2016). Development, cross-cultural adaptation process and preliminary validation of the Italian version of the Nepean Dysphoria Scale, Journal of Psychopathology, 22: 149-156
- Caseras, X., Garner, M., Bradley, B. P., & Mogg, K. (2007). Biases in visual orienting to negative and positive scenes in dysphoria: An eye movement study. Journal of Abnormal Psychology, 116(3), 491.
- McMakin, D. L., Santiago, C. D., & Shirk, S. R. (2009). The time course of positive and negative emotion in dysphoria. The Journal of Positive Psychology, 4(2), 182-192.
- Schlosberg, H. (1954). Three Dimensions of Emotion. Psychological Review, 61(2), 81-88.
- Siegle G. J., Condray R., Thase M. E., Keshavan M. & Steinhauer S. R. (2010), Sustained gamma-band EEG following negative words in depression and schizophrenia, International Journal of Psychophysiology, 75 : 107–118.
- Lin, Y. P., Wang, C. H., Jung, T. P., Wu, T. L., Jeng, S. K., Duann, J. R. & Chen, J. H. (2010), EEG-based emotion recognition in music listening, IEEE transactions on biomedical engineering, Vol. 57(7).
- Sourina, O. & Liu, Y. (2014). A fractal-based algorithm of emotion recognition from EEG using arousal-valence model, IEEE international conference on systems, man, and cybernetics.
- Lang, P. J., Bradley, M. M. & Cuthbert, B. N. (1999). International Affective Picture System (IAPS): Technical Manual and Affective Ratings, University of Florida, Center for Research in Psychophysiology, Gainesville
- Cacioppo, J. T. (2004). Feelings and Emotions: Roles for Electrophysiological Markers, Biological Psychology, Vol. 67(1): 235-243.
- Asakawa, T., Hayashi, T. & Mizuno-Matsumoto, Y. (2014). Coherence Analysis of EEG under Emotional Stimuli Related to Mental States. Electronics and Communications in Japan, Vol. 97(8): 14-23.
- Wahab, A., Kamaruddin, N., Palaniappan, L. K., Li, M., & Khosrowabadi, R. (2010). EEG signals for emotion recognition. Journal of Computational Methods in Sciences and Engineering, 10(s1), 1-11.