
Smart Meter Data Analysis for Electricity Theft Detection using Neural Networks
Volume 4, Issue 4, Page No 161-168, 2019
Author’s Name: Priyamvada Chandel1,a) , Tripta Thakur2
View Affiliations
1Central Power Research Institute, Bhopal, India
2Maulana Azad National Institute of Technology, Bhopal, India
a)Author to whom correspondence should be addressed. E-mail: priyamvada@cpri.in
Adv. Sci. Technol. Eng. Syst. J. 4(4), 161-168 (2019); ![]() DOI: 10.25046/aj040420
DOI: 10.25046/aj040420
Keywords: Electricity Theft Detection, Convolutional Neural Network (CNN), Recurrent Neural Network (RNN), Bidirectional Long Short Term Memory (BiLSTM)

Export Citations
The major problem in electric utility is Electrical Theft, which is harmful to electric power suppliers and causes economic loss. Detecting and controlling electrical theft is a challenging task that involves several aspects like economic, social, regional, managerial, political, infrastructural, literacy rate, etc. Numerous methods were proposed formerly for detecting electricity theft. However, the previous works considered only the one dimensional (1-D) energy consumption data which apprehended the periodicity and were found inefficient in storing and retrieving the memory that resulted in a lower accuracy rate of detection. Hence, this research study intends Convolutional Neural Network combined with Bidirectional Long Short Term Memory based Recurrent Neural Network (CNN-RNN-BiLSTM) for overcoming the aforementioned problems in the detection of electricity theft. The CNN captures the global variables of 1-D data and identifies the non-periodicity and periodicity of 2-D electricity consumption records. RNN-BiLSTM extends the memory storage capacity of the neural network with bidirectional flow of information, thereby allowing learning order dependencies. The proposed method results of the predicted values of the electricity theft show better accuracy rate with reduced time during the training phase and reduced number of epochs. The proposed model helps to discriminate the customers for preventing fraudulent activities in the usage of electric power. The validation of the proposed method is carried out by comparing the method with the existing Support Vector Machine (SVM) and multi-class SVM models. The comparative results prove that the proposed CNN-RNN-BiLSTM model of electricity theft detection works efficiently.
Received: 16 June 2019, Accepted: 11 July 2019, Published Online: 21 July 2019
1. Introduction
Electricity has become a basic need in our life. Losses often occur during the transmission, generation, and distribution of electricity. The losses in the electricity supply to consumers, refer to the quantity of electricity introduced into the distribution and transmission grids that are unpaid by the users. The losses of electricity can be classified into technical losses (TLs) and Non-Technical losses (NTLs) [1]. Advanced Metering Infrastructure (AMI) they enable energy companies to obtain active energy, phase current and voltage, apparent energy, and Reactive lead from smart meter deployed at home [2]. Smart meters (SM) collect the active energy from the real-time, and reveal the user habits and behavior at home to forecast the financial loss. For example, if the daily energy is low, then the user is not at home. To disclose the theft detection is addressed in this work. Smart meters allow functions to perceive Non-Technical Loss (NTL), which was very difficult in previous days. Now SM even out functions that often measures the energy consumption (EC), and gives the better perceptive of customer consumption behavior [3].
Non-Technical losses occur due to loads and conditions when the Technical losses calculation become unsuccessful to consider or due to the triggering of the external factors. Non- Technical losses are tedious to evaluate since these losses are not frequently considered by the system operatives and therefore have no verified data existed [4]. One of the fundamental NTLs is the theft of electricity. This theft involves bypassing of the electricity meter, hacking the meter, or tampering the meter reading [5]. Electricity theft results in a great revenue fall of power company because of the surging electricity, the dense load of electrical systems, and it brings threats to public safety.
In many developing countries, at many distribution feeders, electricity theft is openly visible. In the past, indiscriminate machine learning methods have been employed for detecting electricity theft. However, convenient variables are created from meter readings, and the performance will be optimal [6]. The existing methods have some concerns that need to be addressed further. For Artificial Intelligence (AI) based methods, due to the difficulty in building a labeled dataset of electricity thefts, the application of classification methods is limited. Since the clustering algorithms are unverified, tampered load profiles with normal figures cannot be identified, ensuing in low accuracy of prediction. For the state-based methods, the measurement data and system information acquisition are much more difficult to obtain [7]. For deep learning approaches, since the scalability of the framework is arbitrary, the network can end up being unstable. Furthermore, the weights fed to the layers of the network have the underfitting of the model that tends to increase the number of epochs for training the model. Epoch is defined as the number of iterations related to the samples of the dataset. For training a network with a large dataset and a reduced number of epochs, memory storage becomes an important concern for the classification model of the network.
2. Literature Review
This section includes a survey of electricity theft detection methods proposed by researchers formerly. The studies can be categorized into hardware-based and non-hardware based solutions to the detection of electricity theft. Non-hardware based solutions include AI and machine learning techniques.
Nizar et al. applied the Extreme Learning Machine (ELM) for electricity theft detection [8]. The ELM-based technique extracts forms of customer behavior using their previous consumption data in kWh and perceives abnormal deeds. The performance of the classifier was compared with OS-ELM and SVM for validation. However, the classification rate of testing phase was found low for this approach.
In [9], the authors recommended a multi-class SVM which was trained to identify a sample of load profiles whether it is malicious or normal. This paper addressed and solved the imbalanced training by generating a synthetic dataset. The algorithm also uses silhouette plots to identify the different distributions in the dataset. One limitation of the machine learning approach is that it is vulnerable to contamination attacks.
In [10], the authors proposed an optimum-path forest (OPF) based unsupervised NTL detection methodology and compared with other popular clustering methods including k-means and GMM. OPF has attained the most accurate results while considering both the applications on two datasets composed of industrial and commercial profiles of irregular and regular consumers. However, clustering techniques are not cost-effective.
In [11], the researcher suggested for distribution lanes from current and real power measurements using linear regression technique; subsequently, NTL of all lane is measured in accordant with the estimated resistance value to find the electricity theft. Limitation of this method is that correlating more than two independent factors with dependent factor becomes complicated in the linear regression model.
In [12], the authors proposed for distribution load transformer is employed in detecting meter tampering using state estimation-based technique. The variation in the measured values and the estimated values is assessed to make suspicious details of consumers with metering issues. Customer meter data in conjunction with intelligent devices measurements in smart distribution grid are used for DSE and NTL detection without additional meter investment at points of delivery.
In [13], the researchers presented a probabilistic methodology NTL assessment in the distribution system. The sensitivity of technical loss when related to the load variation is derived, and the probabilistic distributions of total loss and technical loss are evaluated. This approach is suitable only for countries that have scarce resources and is not suitable for smart grid applications.
In [14], the authors recommended a deep-learning-based real-time technique for the finding of electricity thefts was projected. This paper utilizes real-time data and its state vector estimator (SVE), and computes the occurrence vector and state vector and the topology of the power system, and a detection scheme based on broad belief network assist the SVE identifies the false data injection (FDI). However, possible FDI attacks are not imposed on the network.
In [15], the researchers proposed Principal Component Analysis (PCA) based Theft Detection system to identify energy theft in AMI. This approach was then compared with SVM classifier to validate the supremacy of PCATD performance. But the results obtained from PCA are found to be inconsistent under change of constraints.
The study conducted in [16] detect the anomalous behavior in customer-defined patterns using an SVM classifier. However, the study relied on monthly measurements of the demand, and the detection window is approximately taken for two years. Additionally, the algorithm was found to show low performance while detecting any theft cases that are not viewed as unexpected variations.
Beyond the concept of machine-learning algorithms, techniques based on game-theory have been applied in [17], identified the fraud was executed between the utility company and fraud-committing consumers. The primary problem with these approaches is the struggle in the formulation of practical and realistic utility functions for the players involved.
In [18], the authors proposed a model that exploits the time-series nature of the customers’ electricity consumption to implement a Gated Recurrent Unit (GRU)-RNN. As an improvement to RNN, random search analysis in the learning stage has been adopted. In [19], the authors suggested a deep neural network (DNN)-based customer-specific detector, that implements a sequential grid search analysis in its learning stage for tuning hyperparameters. Wide-ranging investigations are performed based on openly accessible originally energy consumption database of 5000 customers. These approaches suffer from inefficient memory for storage and retrieval.
In [20], the author proposed DNN with transfer entropy measure-based anomaly detection for both sensor measurements and innovative sequences, that can be assessed in a data-driven fashion without relying on a model of the underlying dynamic system. The results of the simulation indicated that the method takes a longer time for computation.
In [21], the authors recommended a novel data analysis method for detecting false data injection attack mitigation (FDIA) based on a data-centric model using the margin setting algorithm. The performance of the suggested methodology is presented employing the six-bus power network in a measurement system of the wide-area environment through simulation. However, it handles only a limited data for the period of the identification process.
In [22], the authors proposed to identify cyber-attacks in Cyber-Physical systems using a novel unsupervised approach, combining LSTM-RNN for behavioral-based intrusion detection. This model not only identifies the attacked sensor, but also detects the irregularities in the CPS. The limitation of this method was that the ability to validate the false positives was found less.
In [23], the authors proposed ANN-based intrusion detection. The MLP is trained to employ packet traces of internet, and then it is evaluated based on its capability to resist DoS/DDoS attacks. The study spotlight on the normal and threat patterns classification on an IoT Network. But the mean absolute error obtained for MLP was found to be high.
3. Proposed Methodology
In this section, the Electricity Theft Detection and Implementation using CNN-RNN-BiLSTM model are discussed. The advancement of the methodology proposed such work consists of the following fundamental stages:
- To construct a network for ensuring enhanced storage of memory along with cache memory and for the retrieval of the system.
- To build a balanced system for reducing the training time and epochs.
- To detect electricity theft in the Indian distribution system.
Electricity Theft Detection
Electricity Theft Detection study is categorized into two types: Data-driven solution and Hardware-based solution. The hardware-based solution met with failure due to severe weather conditions and difficulty in maintaining the devices. The data-driven solution has attained more attention
nowadays. The data-driven is planted on data fusion from sensors and AMI. The methodology uses SM data for convolution.
Data attributes
The following are the important attributes of electricity consumption behavior from 41 meters dated 1/1/2017 to 16/2/2018 with the frequency of every 15 minutes that the users consume energy daily. The attributes namely; R, Y, B phase current and voltage, active energy, apparent energy, reactive lag, reactive lead, PF, and label.
CNN
A CNN structure transforms the input work into an output work using a stack of the discrete layer. CNN comprises of an input layer, multiple hidden layers, and output layer; whereas the hidden layer embraced of pooling layer and convolutional layer [24]. The receptive field is the zone of the input matrix that influences a precise unit of the network. The convolutional layer which comprises of the less receptive field and it can extend up to full depth of
input, and it is composed of kernels or filters. Each filter is convolved using height and width of input at onward pass, and it produces the 2D activation map of the filter. The pooling layer reduces the parameters, network computation, and controls the overfitting. The pooling function employed in the proposed method is maximum pooling.
The pooling layer accepts the volume of size , and produces a volume of size .’
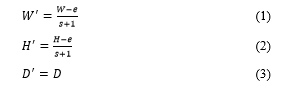 Where is the spatial extent and is the stride. The pooling layer operates independently on every depth of the input slice and resizes it in the spatial dimension. Due to these advantages, the CNN network is used for extracting the convolution features efficiently.
RNN
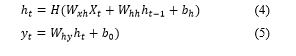
In RNN the memory formed through recurrent connection. In feedforward networks, inputs are connected, and it is also independent. It exhibits vital behavior for sequential classification in a time sequence. Consider an input classification X = (X1, …, XT), a standard RNN evaluates the hidden vector classification h = (h1, …, hT) and output vector classification Y= (Y1, …, YT ) by repeating the below equations from t = 1 to T [25]:
 where,
– weight matrices (e.g., is the input-hidden weight matrix),
– denote bias vectors (e.g., is the hidden bias vector) and
– hidden layer function. H is usually a sigmoid function.
Bidirectional LSTM (BiLSTM)
Long Short Term Memory (LSTM) Recurrent Neural Networks (RNN) have been solved the problem of vanishing gradients in RNNs. The LSTM structure composed of memory blocks and block consists of three multiplicative units such as input, forget and output gates and one or more self-associated memory cells. The multiplicative units afford incessant analogs of reading, write, and rearrange functions for cells. An LSTM is similar to RNN, but the main difference is the memory blocks are used in the hidden layer instead of nonlinear units. To avoid the vanish-gradient issue and to access and store data for a long time of period, the multiplicative gates used in LSTM. Consider that the input gate rests closed (0) the cell will not be overridden by the fresh inputs, and can be set accessible for the next sequence, by opening the output gate.
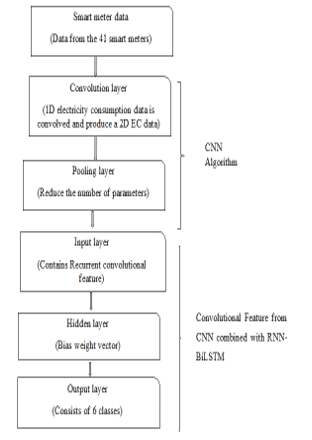 Figure.1: Methodology of CNN-RNN BiLSTM
Traditionally RNN has the problem for vanishing and exploding the gradients. The issue is due to the weight proportional to the gradient of error. During backpropagation, gradients multiply with small values leads to earning smaller values. LSTM does not suffer from any gradients, and it also controls the cell state retains in memory and passes the output. An activation function is a function that defines the output of each node. A sigmoid activation function is used in the design. A sigmoid activation function is an ‘S’ shaped curve function that ranges between 0 and 1.
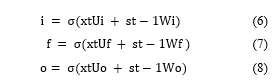 where,
is the input data sequence, the i-input gate is the gate that allows the input data to enter the network, the f-forget gate is responsible in deciding whether to keep the data or delete the data which is no longer useful, and o-output gate produces the output to be sent to the hidden state. The formula for each gate is formulated using the weight matrix (W), time sequence (U) and a sigmoidal activation function to push the values between a certain interval.
CNN-RNN-BiLSTM
This paper proposes a CNN-RNN-BiLSTM method for the detection of electricity theft. A hybrid wide and deep CNN and RNN is proposed with memory extension rendered by BiLSTM network. The Wide CNN component can capture the convolution features of 1-D electricity consumption data. And the Deep CNN module can recognize the non-periodicity and periodicity of the electricity consumption records.
BiLSTM based RNN offers enhanced memory storage with bidirectional information flow, and make the retrieval and the memory storage and recovery are possible for long term dependencies. The retrieved layer occurs with six classes.
The architecture of the proposed system
Fig 1 shows the flow diagram of the proposed CNN-RNN-BiLSTM prediction model. Data from 41 smart meters are collected and given to the Convolution layer. The convolutional layer convolves the 1-D electricity data and produces 2-D electricity consumption data. And the pooling layer reduces the number of parameters. This working flow of Convolution and Pooling layer is depicted in Fig 2. L is the number of attributes, M is the number of feature values from the convolution layer and pooling layer. Attributes considered in work are phase voltages, phase currents, active energy, apparent energy, reactive lag, reactive lead, and power factor.
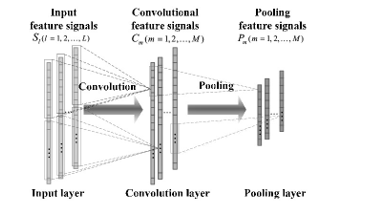 Figure. 2 Convolution and Pooling layer
The length of the input vector is n, and that of the kernel is m. The convolution of input vector and kernel function is defined as:
![]() These convolved values passed through max pool layer. The maximum value obtained from pooling layer is chosen as the convolution feature. The convolution features are loaded onto the input layer of RNN. The general structure of RNN is given in Fig 3.
These convolved values passed through max pool layer. The maximum value obtained from pooling layer is chosen as the convolution feature. The convolution features are loaded onto the input layer of RNN. The general structure of RNN is given in Fig 3.
RNN consists of 3 layers, namely, Input layer, Hidden layer, and Output layer. Input cells get convolution features and pass to the hidden or recurrent layer. It consists of neurons x1, x2, x3, etc., which gets the input data sequences. The hidden layer contains the hidden units h1, h2, etc., which hold the activation functions that define the output of the neurons in the recurrent layer. The neurons in the output layer y1, y2, etc., will send the predicted values of electricity theft as the output. Each cell of RNN in the proposed prediction model is a BiLSTM memory cell, whose structure is displayed in Fig 4.
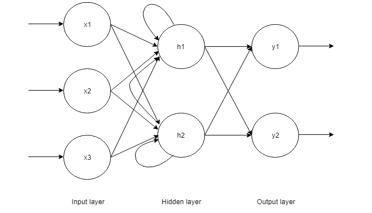 Figure 3. Structure of RNN
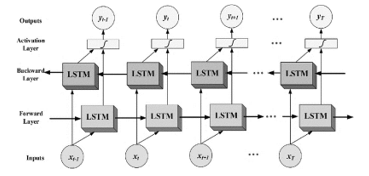 Figure 4. Structure of BiLSTM
The information flow in a BiLSTM is bidirectional, unlike the LSTM. BiLSTM cells acquire bidirectional long term dependencies among time steps or sequential data. These previous long term dependencies are useful for predicting the next state.
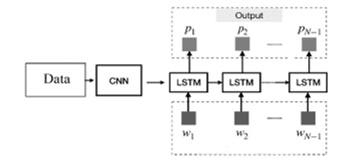 Figure. 5 CNN-RNN-BiLSTM
Fig. 5 shows the architecture of the proposed CNN-RNN-BiLSTM prediction model. Input data is sent to CNN for convolution. Convolution features extracted using CNN are sent to RNN-BiLSTM. The outputs of the model are the detected values of electricity theft.
The voltage and current threshold values for different tamper types are given in Table 1.
Table 1. Occurrence threshold values for different Tamper types
| S. NO | TAMPER TYPE | OCCURRENCE THRESHOLDS |
| 1 | Link Miss phase-wise | Vx < 60 % Vref and Ix > 5 % Imax |
| 2 | CT Bypass | Iavg> 2% IBasic and Ix >2.5% IBasic |
| 3 | CT Open phase-wise | Vx > 60% Vref and Ix< 0.5% Imax |
| 4 | Current Unbalance | Vavg > 60% Vref and Iavg > 1: |
| 5 | Voltage Unbalance | Vavg > 66 % Vref |
| 6 | Current Reversal phase-wise | Vavg < 60% Vref and Net PF > -0.5: |
Six classes are achieved based on Vref=240V, Ibasic=10A, Imax=40.0A, Iavg=Average of three-phase currents and the tampers are link miss-phase wire, CT bypass, CT open phase-wise, current unbalance, voltage unbalance and current reversal phase wire.
4. Result and Discussion
Evaluation of the proposed energy theft detection using abnormal conditions scheme is done using MATrix LABoratory (MATLAB) The energy usage data comes from Smart Meter Data.
Table 2. Results obtained
| Class Labels | Six classes of fault types |
| No. of Observations | 6000 |
| Control classes | [5×1] double |
| Correct Rate | 0.9712 |
| Error Rate | 0.0288 |
| Classified Rate | 1 |
| Specificity | 0.9929 |
| Sensitivity | 0.9990 |
| Positive Predictive Value | 0.9640 |
| Negative Predictive Value | 0.9998 |
| Positive Likelihood | 139.7162 |
| Negative Likelihood | 0.0010 |
| Prevalence | 0.1608 |
4.1. Experimental Data
Dataset taken for this study is the real-time data communicated by 41 numbers of three phases four-wire smart meters having a unique number, and the data is sent to the Data Collection Unit (DCU) of Chhattisgarh State Electricity Board Raipur. Totally 231637 data for every 15 minutes’ interval of time from 1/1/2017 to 16/2/2018 is considered.
4.2. Testing
Then the network is tested using the 6000 data. Each label consists of 1000 data. The tested results are obtained from MatlabR2018a are given in Table 2.
The Fig.6 shows the confusion matrix accuracy of 97.1%.
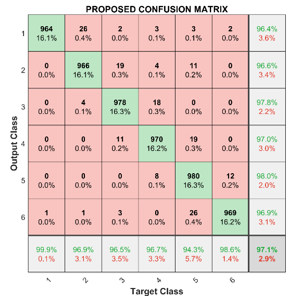 Figure 6. Proposed confusion matrix
4.3. Parameter Study
The Fig.7 shows the accuracy and loss of RNN-BiLSTM.
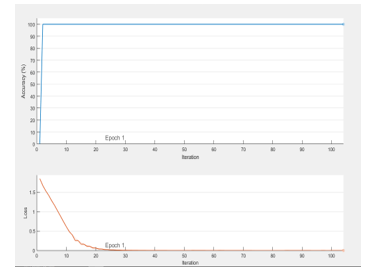 Figure 7. Accuracy and loss of RNN-BiLSTM
First Smart meter(SM) data are taken as label and balanced. Using the Convolutional Neural Network (CNN), the convolution feature of dataset is extracted. In CNN, we used two layers called Convolution and pooling layer to extract the convolution feature. Here, CNN works well for identifying simple patterns within the smart meter data, which will be employed to form higher complex patterns within higher layers. A one dimensional CNN is very efficient to derive the location of feature from shorter (fixed-length) sections of the entire data set and where the location of the feature within the section is not of high significance. The extracted feature from the convolutional feature is used in the RNN-BiLSTM network to predict the class of fault. In RNN-BiLSTM networks, information can be accessed both in forward and reverse direction. These forward and reverse feature in RNN-BiLSTM have to access the past as well as the future information. This has been effectively employed in many practical applications like language translation, future prediction, image captioning, etc., Using the Bidirectional LSTM we feed the learning algorithm with smart meter data once from the beginning to end and once from end to the beginning. There are debates here, but it usually learns faster than one-directional approach, although it depends on the task
Here the loss (error) reduces from 2 to 0, and the accuracy shows increase the value from 0 to 100. Hence it shows our proposed CNN-RNN-BiLSTM shows the efficient accuracy of 100% for the original Training Dataset.
The proposed system is compared with the existing technique and proved the accuracy of 97.1%. Table 3 given below represents the compared result of the proposed with the existing methods, and Fig. 8 represents the accuracy score of the proposed method [27]:
Table.3 Validation of proposed system
| Algorithm | Arguments | Accuracy Score |
| Combined CNN model | 100 epochs | 0.9267 |
| Single CNN model | 100 epochs | 0.9218 |
| Simple DNN model | 100 epochs | 0.9145 |
| Linear SVC | kernel: linear function | 0.9178 |
| Random Forest | Max depth: 7 | 0.9164 |
| Logistic Regression | penalty: L2 | 0.9141 |
| Proposed Model | Convolution BiLSTM | 0.9712 |
The sensitivity, specificity, and accuracy for the proposed CNN-RNN BiLSTM are calculated using the confusion matrix which comprises of False Positive (FP), True Positive (TP), False Negative (FN), and True Negative (TN). Accuracy, sensitivity, and specificity are calculated using the following formulae.
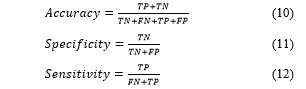
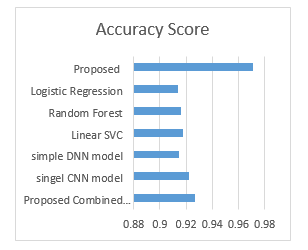 Figure 8. Accuracy score of CNN-RNN BiLSTM
The calculated values are found to be high for the proposed classifier. The specificity, sensitivity, and accuracy obtained for the proposed method are 99.29%, 99.9%, and 97.12% respectively. Fig 9 shows the performance assessment of the proposed framework:
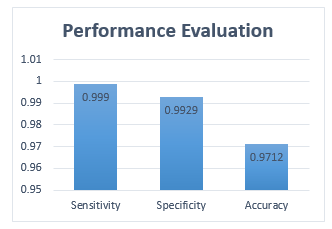 Figure 9. Performance evaluation of CNN-RNN BiLSTM
The performance of the proposed CNN-RNN-BiLSTM is compared with existing methodologies in the literature. Table 4. provides the comparative analysis of the performance parameters of the proposed model with two other models, namely, Support Vector Machine (SVM) and Multi-class SVM.
Table. 4 Performance comparison table
| Method | Accuracy (%) |
| SVM [16] | 60 |
| Multi-class SVM [9] | 94 |
| Proposed | 97.1 |
From the table, it is inferred that the proposed CNN-RNN-BiLSTM theft prediction model has better performance compared to the existing models.
5. Conclusion
In this paper, the detection scheme of theft using the abnormal changes in electric values measures in the smart meter is proposed. The proposed electricity theft detection model is based on the combination of CNN and RNN-BiLSTM network, which detects whether the metering data has an abnormal behavior or not. The model predicts the abnormalities in consumer’s power consumption behaviors and classifies the behavior based on six classes. The proposed neural network model achieved an accuracy of 100% in training phase and 97.1% in testing phase. The use of technique proposed in this paper will help power utilities to predict theft in lesser time and higher accuracy. Hence in the future, this theoretical approach to the detection of electricity is to be tested for real time practical application. And the use of hybrid spike neural network for electricity theft detection model is presumed to improve the performance of detection effectively.
Conflict of Interest
The authors declare no conflict of interest.
- R. Jiang, R. Lu, Y. Wang, J. Luo, C. Shen, X. S. Shen, Energy-theft detection issues for advanced metering infrastructure in smart grid. Tsinghua Science and Technology, 19(2), 105-120, 2004. DOI: 10.1109/TST.2014.6787363
- Y. Sun, L. Lampe, V. W. S. Wong, “Smart meter privacy: Exploiting the potential of household energy storage units,” IEEE Internet of Things Journal, vol. PP, no. 99, pp. 1–1, 2017. DOI: 10.1109/JIOT.2017.2771370
- J. Nezhad, T. K. Wijaya, M. Vasirani, K. Aberer, “SmartD: Smart Meter Data Analytics Dashboard,” Proceedings of the 5th international conference on Future energy systems. ACM, pp. 213–214, 2014. DOI: 10.1145/2602044.2602046
- J. P. Navani, N. K. Sharma, S. Sapra, Technical and non-technical losses in the power system and its economic consequence in the Indian economy. International Journal of Electronics and Computer Science Engineering, 1(2), 757-761, 2012.
- S. McLaughlin, B. Holbert, A. Fawaz, R. Berthier, S. Zonouz, A multi-sensor energy theft detection framework for advanced metering infrastructures. IEEE Journal on Selected Areas in Communications, 31(7), 1319-1330, 2013. DOI: 10.1109/JSAC.2013.130714
- R. Razavi, A. Gharipour, M. Fleury, I.J. Akpan, A practical feature-engineering framework for electricity theft detection in smart grids. Applied Energy, 238, 481-494, 2019. DOI: 10.1016/j.apenergy.2019.01.076
- K. Zheng, Q. Chen, Y. Wang, C. Kang, Q. Xia, A Novel Combined Data-Driven Approach for Electricity Theft Detection. IEEE Transactions on Industrial Informatics, 15(3), 1809-1819, 2019. DOI: 10.1109/TII.2018.2873814
- A.H. Nizar, Z.Y. Dong, Y. Wang, Power utility nontechnical loss analysis with extreme learning machine method. IEEE Transactions on Power Systems, 23(3), 946-955, 2008. DOI: 10.1109/TPWRS.2008.926431
- P. Jokar, N. Arianpoo, V.C. Leung, Electricity theft detection in AMI using customers’ consumption patterns. IEEE Transactions on Smart Grid, 7(1), 216-226, 2016. DOI: 10.1109/TSG.2015.2425222
- L.A.P. Júnior, C.C.O. Ramos, D. Rodrigues, D.R. Pereira, A.N. de Souza, K.AP. da Costa, J.P. Papa, Unsupervised non-technical losses identification through the optimum-path forest. Electric Power Systems Research, 140, 413-423, 2016. DOI: 10.1016/j.epsr.2016.05.036
- D.N. Nikovski, Z. Wang, U.S. Patent No. 9,945,889. Washington, DC: U.S. Patent and Trademark Office, 2018.
- S.C. Huang, Y. L. Lo, C.N. Lu, Non-technical loss detection using state estimation and analysis of variance. IEEE Transactions on Power Systems, 28(3), 2959-2966, 2013. DOI: 10.1109/TPWRS.2012.2224891
- E.A.A. Neto, J. Coelho, Probabilistic methodology for Technical and Non-Technical Losses estimation in the distribution system. Electric Power Systems Research, 97, 93-99, 2013. DOI: 10.1016/j.epsr.2012.12.008
- Y. He, G.J. Mendis, J. Wei, Real-time detection of false data injection attacks in smart grid: A deep learning-based intelligent mechanism. IEEE Transactions on Smart Grid, 8(5), 2505-2516, 2017.DOI: 10.1109/TSG.2017.2703842
- S.K. Singh, R. Bose, A. Joshi, Energy theft detection in advanced metering infrastructure. In 2018 IEEE 4th World Forum on the Internet of Things (WF-IoT) (pp. 529-534), 2018. DOI: 10.1109/WF-IoT.2018.8355148
- J. Nagi, K.S. Yap, S.K. Tiong, S. K. Ahmed, M. Mohamad, Nontechnical Loss Detection for Metered Customers in Power Utility Using Support Vector Machines. IEEE transactions on Power Delivery, 25(2), 1162-1171, 2010. DOI: 10.1109/TPWRD.2009.2030890
- S. Amin, G.A. Schwartz, A. A., Cardenas, S.S. Sastry, Game-theoretic models of electricity theft detection in smart utility networks: Providing new capabilities with advanced metering infrastructure. IEEE Control Systems Magazine, 35(1), 66-81, 2015. DOI: 10.1109/MCS.2014.2364711
- M. Nabil, M. Ismail, M. Mahmoud, M. Shahin, K. Qaraqe, E. Serpedin, Deep Recurrent Electricity Theft Detection in AMI Networks with Random Tuning of Hyper-parameters. In 2018 24th International Conference on Pattern Recognition (ICPR) (pp. 740-745), 2018. DOI: https://arxiv.org/abs/1809.01774
- M. Ismail, M. Shahin, M.F. Shaaban, E. Serpedin, K. Qaraqe, Efficient detection of electricity theft cyber-attacks in AMI networks. In 2018 IEEE Wireless Communications and Networking Conference (WCNC) (pp. 1-6), 2018. IEEE. DOI: 10.1109/WCNC.2018.8377010
- D. Shi, Z. Guo, K.H. Johansson, L. Shi. Causality countermeasures for anomaly detection in cyber-physical systems. IEEE Transactions on Automatic Control, 63(2), 386-401, 2018. DOI: 10.1109/TAC.2017.2714646
- Y. Wang, M.M. Amin, J. Fu, H.B. Moussa. A novel data analytical approach for false data injection cyber-physical attack mitigation in smart grids. IEEE Access, 5, 26022-26033, 2017. DOI: 10.1109/ACCESS.2017.2769099
- J. Goh, S. Adepu, M. Tan, Z.S. Lee. Anomaly detection in cyber-physical systems using recurrent neural networks. In 2017 IEEE 18th International Symposium on High Assurance Systems Engineering (HASE) (pp. 140-145), 2017. IEEE. DOI: 10.1109/HASE.2017.36
- E. Hodo, X. Bellekens, A. Hamilton, P.L. Dubouilh, E. Iorkyase, C. Tachtatzis, R. Atkinson, R. (2016, May). Threat analysis of IoT networks using artificial neural network intrusion detection system. In 2016 International Symposium on Networks, Computers and Communications (ISNCC) (pp. 1-6). IEEE.DOI: 10.1109/ISNCC.2016.7746067
- R. R. Varior, M. Haloi, and G. Wang, “Gated siamese convolutional neural network architecture for human re-identification,” in European Conference on Computer Vision, pp. 791–808, 2016. DOI: https://arxiv.org/abs/1607.08378
- A.A. Sharfuddin, M.N. Tihami, M.S. Islam. A Deep Recurrent Neural Network with BiLSTM model for Sentiment Classification. In 2018 International Conference on Bangla Speech and Language Processing (ICBSLP) (pp. 1-4), 2018. IEEE.
- C. Genes, I. Esnaola, S. M. Perlaza, L. F. Ochoa, and D. Coca, “Recovering missing data via matrix completion in electricity distribution systems,” in Signal Processing Advances in Wireless Communications (SPAWC), 2016 IEEE 17th International Workshop on, 2016. DOI: 10.1109/SPAWC.2016.7536744
- D. Yao, M. Wen, X. Liang, Z. Fu, K. Zhang, B. Yang. Energy Theft Detection with Energy Privacy Preservation in the Smart Grid. IEEE Internet of Things Journal, 2019. DOI: 10.1109/JIOT.2019.2903312