
Application of Feature Extraction for Breast Cancer using One Order Statistic, GLCM, GLRLM, and GLDM
Volume 4, Issue 4, Page No 115-120, 2019
Author’s Name: Dian Candra Rini Novitasari1,a), Ahmad Lubab1, Asri Sawiji2, Ahmad Hanif Asyhar1
View Affiliations
1UIN Sunan Ampel Surabaya, Mathematics Department, Indonesia
2UIN Sunan Ampel Surabaya, Marine Science Department, Indonesia
a)Author to whom correspondence should be addressed. E-mail: Diancrini@uinsby.ac.id
Adv. Sci. Technol. Eng. Syst. J. 4(4), 115-120 (2019); ![]() DOI: 10.25046/aj040413
DOI: 10.25046/aj040413
Keywords: Breast Cancer, Feature Extraction, GLCM, GLRLM, GLDM

Export Citations
The increasing number of breast cancer in recent years has attracted numerous researchers’ attention. Several techniques of Computer Aided Diagnosis System have been proposed as alternative solutions to diagnose breast cancer. The flaw of simply using the naked eye to see the differences between normal and with cancer mammogram images makes the texture analysis play an important role in classifying breast cancer. In this study, the results of the classification were compared using various methods of texture analysis in extracting a feature of the mammogram image. Some texture analysis methods, including first order, which consist of GLCM, GLRLM, and GLDM, have successfully extracted features based on their characteristics. The statistical features of these methods are used as input for the ECOC SVM classification, which three kernel comparisons; linear, RBF, and polynomial, build the classification. The results show that the best kernel is polynomial kernels with statistical features built by GLRLM with 93.9757% accuracy value.
Received: 20 May 2019, Accepted: 24 June 2019, Published Online: 13 July 2019
1. Introduction
Breast cancer is one of the most common cancers for women around the world. Early diagnosis and treatment are very important in reducing the mortality rate. The advances of screening and treatment toward cancer have a contribution to increasing the survival rates since 1989. There are around 3.1 million breast cancer sufferers in the United States (U.S.). The possibility of women dying because of breast cancer is about 1 in 37, or 2.7 percent [1]. Some factors associated with breast cancer are obesity, the age of the first giving birth, breastfeeding history, and age of menarche [2]. The symptoms identification and routine screening can give early detection toward cancer to prevent the occurrence of acute breast cancer. A mammogram is one of the X-ray imaging test technique to screen and diagnose the initial cancer sufferers. The Mammogram produces an image that helps to detect lumps or abnormalities. The mammographic image sometimes shows abnormal areas that are not cancer, which may cause unnecessary stress and intervention. Ultrasound scanning can help to distinguish a solid mass or a fluid-filled cyst. In addition, research as an effort to prevent breast cancer has been conducted by using BIRADS 2,3 and four which stages of cancer that can be prevented and the fourth stage is called “No lesions” where veins and networks are detected by high pass Gaussian filters. The diagnosis accuracy for breast cancer patients is very critical because it can affect the patient’s mentality. Similarly, Yuhana [3] has found that the analysis of K-Nearest Neighbor algorithm method showed to screen breast cancer has an accurate prediction from 39 cases.
Considers computer-aided diagnosis is a medically necessary adjunct to mammography. Computer Aided Diagnosis System (CADS) plays an important role in the medical field, specifically in performing medical image processing [4]. CADS has several benefits, such as an alternative diagnosis that can save costs, time, reduce the possibility of diagnostic errors, and help medical workers to diagnose disease objectively [5]. In CADS, medical images are classified using various stages; those are preprocessing, feature extraction, and classification [5–8]. Afterward, the medical image should be improved by using the various method. As a result, the medical image quality can meet the required standard. In short, the medical image is a raw source where further treatment should be processed to meet the contrast, size, and uniformity of image lighting [4,6].
Medical images that have adequate quality are overviewed by using texture analysis to obtain the characteristic texture parameters of the image [4]. Texture analysis of medical images represents a feature extraction form that facilitates the correct classification of images based on their characteristics. However, texture analysis with different methods will produce different groups classification as well, even it uses the same medical image. Therefore, feature extraction is needed to match data and analysis. There are four feature extraction methods based on the statistical order. They are: first statistic (first-order extraction) [1], second statistics (Gray Level Co-occurrence Matrix) [5,6], run-length high order statistics ( Gray Level Run Length Matrix) [9–11] and, other order statistics (Gray level Difference Method) [12]. Thus, the purpose of this study is to determine the appropriate feature extraction method in a disease diagnosis system. As a result, the best feature extraction method will contain the characteristics of the image texture and classify the medical image correctly into the group.
In recent years, there has been an increasing interest in the development of CADS techniques, and an increase in breast cancer cases have attracted the attention of many researchers. Saban Ozturk and Bayram Akdemir implemented feature extraction methods of GLCM, LBP, LBGLCM, GLRLM, and SFTA in the classification of histopathological images [10–13]. Various feature extraction methods are used as training and testing in classifying histopathological images to obtain the most applicable method and suit the characteristics of existing data [10]. Similarly, Aswini K Mohanty et al. have classified benign mass and malignant mass using a combination of GLCM and GLRLM methods on mammogram images. The results showed a combination of the two methods with a fairly good accuracy value, 94.9% [10]. Moreover, Naga Padmaja and Shudir implemented GLCM, GLRLM, and hybrid metaheuristic – GLRLM method in classifying breast cancer. The results, after conducting various types of testing methods, showed that Hybrid GLRLM provided better accuracy than other methods [11]. For this reason, this research implements feature extraction methods using statistical order to assist the diagnosis process of breast cancer cases. Afterward, The result of the statistical order will be used as an input in the classification stage.
In addition, various studies have also used various methods in the classification of mammogram images, for example, the Backpropagation method [14,15], Support Vector Machine [5,16,17], Fuzzy Neural Network [18], and Adaptive Neuro-Fuzzy Inference System (ANFIS) [18–23], etc. Some of these methods are subcategories of artificial neural network methods that have been widely implemented for various types of diseases by previous researchers [20]. However, in this study, the researcher used the SVM method to classify mammogram images. The SVM method provides a high degree of accuracy in classifying both linear and nonlinear case. A research finding by [24], also points towards how the SVM maximizes the hyperplane boundary as a benchmark for classifying. In addition, SVM can handle well nonlinear separate data case through the SVM kernel [24]. Moreover, SVM provides excellent classification results, especially in complex cases, with moderately short training times. Computer-aided diagnosis system
2. Literature Review
2.1. Support Vector Machine
The multiclass SVM method has three approaches; one-against-all (OAA), one-against-one (OAO), and error computing output code (ECOC) approach [24]. This study used the ECOC approach since the way how these approach works are to add redundant data into messages which are sent in the form of a codeword. Thus, the message recipient can detect errors in the messages and recover the original message if there are several small errors [13,14]. Furthermore, the ECOC SVM approach is very suitable for several noise data that has become a common problem of breast cancer classification Kernel SVM
- Kernel SVM
The method applied in SVM to solve nonlinear cases is kernel [5]. The kernel maps data to a higher dimensional space using the mapping function , by multiplying the mapping function , each multiplication will be calculated by using where ‘will be mapped to space with higher dimensions as follows:
![]() SVM has some basic kernels; linear, Gaussian (RBF), quadratic, and polynomial kernels [5,24,25]. Each kernel is used in the training and testing stages to get the best classification results based on the distribution of the data. This study will a comparison of three kernels compared three kernels; linear, Gaussian (RBF), and polynomial.
SVM has some basic kernels; linear, Gaussian (RBF), quadratic, and polynomial kernels [5,24,25]. Each kernel is used in the training and testing stages to get the best classification results based on the distribution of the data. This study will a comparison of three kernels compared three kernels; linear, Gaussian (RBF), and polynomial.
- Texture Analysis
Texture analysis used in the mammogram image is in the form of statistical matrix order distribution based on pixel intensity. It consists of several orders; first-order statistics, second-order statistics (GLCM), high-order run-length statistics (GLRLM), and GLDM
The first-order statistic is a first-order extraction method based on the histogram image characteristics which represents an opportunity for the appearance of the gray degree value of pixels in an image based on its surrounding pixels. There are several parameters in first-order statistics, those are mean, standard deviation (variance), smoothness, a third moment, uniformity, skewness, kurtosis, and Entropy [4].
The second-order statistic is an extraction method that counts the relationship between two pixels (surrounding pixels) in the image. For analysis needs, second-order texture analysis requires the help of matrix co-occurrence for gray images, usually called GLCM [9,10]. Second-order texture analysis is better at representing image textures in measured parameters, such as contrast, correlation, homogeneity, entropy, and energy [14,18].
From these various statistical orders, GLRLM has a higher statistical feature than the others [5,6,14]. GLRLM is a high-order statistical feature that applies a run-length matrix. The run length shows the number of pixels (distance) covered from Pixel of Interest (PoI) to pixels with the same intensity value (in the horizontal and vertical direction) [26].
- GLDM [12]
First-order statistics, GLCM, GLRLM, and GLDM, have several statistical features. In this study, the statistical features used are mean, standard deviation, contrast, correlation, energy, homogeneity, SRE, LRE, GLN, RLN, RP, LGRE, and HGRE [6]. The definitions of these features are as follows:
- Mean
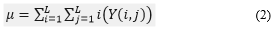
mean is the size of the dispersion of an image that can be calculated by equation (2) [4]:
 Standard Deviation
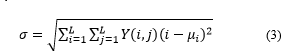
Standard deviation is a variety of histograms of an image that can be calculated by equation (3) [4]:
 Contrast
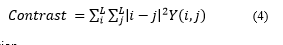
Contrast is the size of diversity or gray intensity variation of an image [27]. Equation (4) is the equation of contrast.
 Correlation
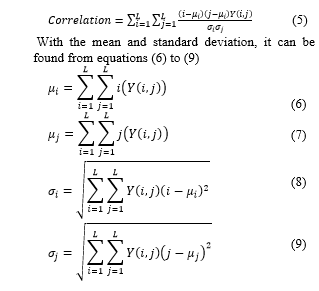
Correlation is a measure of the linear shape of gray image degree. Equation (5) is an equation of correlation [9].
- Energy
Energy shows the measure of the concentration of pixel pairs in the intensity of the congruent matrix at several coordinates [27]. Equation (10) is the equation of energy
 Homogeneity
Homogeneity shows an image with a degree of gray similarity [4]. Equation (11) is the equation of homogeneity
 , and
, and
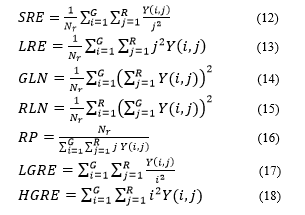
Equation (12) to (19) is a statistical feature equation for GLRLM [5,6,19].
 Explanation:
= line
= column
= Probability of the congruent matrix that appears on the mammogram image
= number of all elements in the run length matrix
2.4. Breast Cancer
Cancer is a body cell that experiences mutations (changes) and grows in a way that is uncontrolled by dividing itself faster than normal cells. Cancer cells do not die after they are old enough, rather, they grow increasingly and are invasive that press the normal cells in the body and even die [12]. Early diagnosis is important to find out the breasts are either normal or abnormal. One of the initial tests is mammography. Mammography test is cancer examination tests, especially breast cancer, which can see cancer mass and the abnormalities symptom in the breast to decide the early treatment. Test results from mammography produced two diagnoses of tumors, namely benign tumors and malignant tumors (cancer) [20]. Therefore, mammographic images are classified into three classifications; normal, benign tumors and malignant tumors. Figure 1 is a picture of three classes of mammographic images. In addition to the mammogram image with three classes classification, it is important to detect the abnormalities, in the breast through the presence of mass or micro-classification [9,11]. Figure 1 is mammographic imagery for normal, benign and malignant breast tumor. Figure 2 mass and micro-classification.
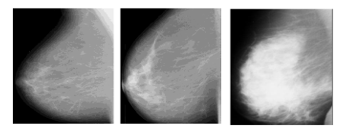 Figure 1: Mammographic imagery for normal breast (left), benign breast tumor (middle), malignant breast tumor (right)
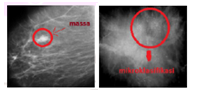 Figure 2: Mass (left), Micro classification (right)
3. Research Method
Research on Application of Feature Extraction for Breast Cancer using One Order Statistical, GLCM, GLRLM, and GLDM is a type of descriptive quantitative research which can be included as applied research considering its functional aspects. The results of the diagnosis of the comparison of four feature extraction methods aim to find an appropriate method for alternative breast cancer diagnoses. The data used in this study is a mammogram image obtained from mammographic images analysis society (MIAS) [28]. Then, the focus of this study is to compare several feature extraction methods that best match the data to obtain closely perfect values of the classification results. The existing mammogram data are uniformly sized through ROI and processed using Contrast-limited adaptive histogram equalization (CLAHE) to improve image quality. The next step is to get statistical features as input for SVM classification by comparing four feature extraction methods. Furthermore, the ECOC SVM classifies mammogram data into three classes; normal, benign, or malignant. Figure 3 is a flowchart from the classification of mammogram images.
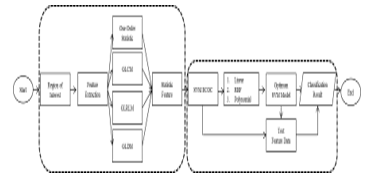 Figure 3: Flowchart
The steps of breast cancer diagnosis include preparing datasets, pre-processing, feature extraction, and classification.
- Breast image data is a mammogram (gray scale) image from several data samples. There are 191 data for training and 83 data for testing which are stored in one file with .jpg format.
- The next stage is pre-processing all data by manually cutting the image (ROI) to reduce the size of the image that can speed up the next process.
- The images that have the same size are repaired using CLAHE to improve the image quality. As a result, the contrast of the mammogram image will be in the same feature to ease the next process.
- The next step is to extract features in the image that has been improved using four feature extraction methods. The method includes first order statistics, GLCM, GLRLM, and GLDM.
- The four texture analysis methods showed several statistical features in the form of mean, standard deviation, energy, contrast, correlation, homogeneity, SRE, LRE, GLN, RLN, RP, LGRE, and HGRE.
- The overall statistical features from texture analysis were used as input for ECOC’s SVM classification.
- After building the ECOC SVM model, then the model was tested to obtain the results of classification, accuracy, sensitivity, and specificity of each classification.
- Eventually, the conclusion was made based on the accuracy obtained from the Order-1-SVM ECOC, ECOC GLCM-SVM, ECOC GLRLM-SVM, and ECOC GLDM-SVM classification,
The best method will classify data into three classes of cancer; normal, benign or malignant.
4. Result
This study uses gray scale images (mammogram) from mammographic images analysis society (MIAS) [28]. In this study, the number of data is 191 as training and 83 as testing, which then is stored in one file with .jpg format. In total, the data used in both training and testing were 113 normal breast data, 115 benign breast data, and 46 malignant breast data. The image processing in this study was conducted through three stages; first, image quality improvement, feature extraction stage, and a classification stage. The stage of image quality improvement used ROI, CLAHE, and gray scale. In ROI, mammogram image was cropped manually to focus on the target feature and make image size the same, 480 x 480 pixels. The following Figure 4 is the result of preprocessing mammogram images.
The next step was a comparison of order-1 texture analysis, GLCM, GLRLM, and GLDM on mammogram images to find statistical features of the mean, standard deviation, energy, contrast, correlation, homogeneity, SRE, LRE, GLN, RLN, RP, LGRE, and HGRE. Extraction of these features was calculated using 2.2 Equation to 2.18 Equation, which was used as an input feature matrix for the ECOC SVM classification. The orientation of order-1, GLCM, GLRLM, and GLDM orientation uses the orientation direction and with distance pixel. Afterward, ECOC SVM model was built from the compiling results of encoding to form a binary SVM model. The model was in form of cancer breast types combination; {normal} with {benign, malignant}, then {normal, benign} with {malignant} and {normal, malignant} with {benign}. Then, the Hamming distance for each distribution of data was calculated to match the closest class. There were three kernel tests used in ECOC SVM; linear, RBF, and polynomial kernels. After obtaining the optimal ECOC SVM model, measurements were made using the confusion matrix as a measure of the work of the classification system made. The confusion matrix compared the accuracy values of each feature extraction result. The results of the four confusion matrix feature extraction methods are presented in Table 1.
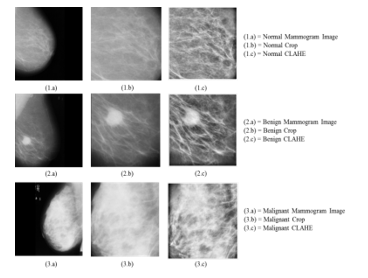 Figure 4. Pre Processing Mammogram image
Table 1. Results from Classification of Mammogram Images
First Order |
GLCM |
GLRLM |
GLDM |
||
Accuracy |
Linear |
92.77108 |
78.31325 |
93.9757 |
62.6506 |
RBF |
91.56627 |
86.74699 |
78.31325 |
65.06024 |
|
Polynomial |
90.36145 |
83.13253 |
93.9757 |
65.06024 |
|
Precision |
Linear |
91.74 |
78.45 |
92.03 |
72.14 |
RBF |
90.86 |
83.86 |
77.58 |
68.96 |
|
Polynomial |
90.02 |
79.89 |
91.82 |
66.19 |
|
Sensitivity |
Linear |
93.85 |
62.74 |
94.70 |
48.28 |
RBF |
92.74 |
80.67 |
77.23 |
50.51 |
|
Polynomial |
91.62 |
82.43 |
94.96 |
50.77 |
|
Table 1 shows that the best kernel to build ECOC SVM model for breast cancer classification is the polynomial kernel because the polynomial kernel with GLRLM and GLDM input in texture analysis has overtaken the linear and RBF kernels. In addition, compared with the first-order method, the polynomial kernel has a slight difference accuracy, 2.40963. However, the best feature extraction method was built by GLRLM texture analysis with accuracy value 93.9757% in the SVM ECOC linear kernel, 78.31325% in the ECB SVM RBF kernel and 93.9757% in the polynomial SVM ECOC Conflict of Interest kernel. In addition, this is due to the polynomial kernel in the GLRLM method having a precision of 91.82% and a sensitivity of 94.96%. This means that normal data is classified as normal, data on cancer classified as cancer, tumor data classified by tumor using the GLRLM method with a polynomial kernel.
5. Conclusion
In this study, the diagnosis results of four comparisons method in feature extraction influence the following steps of taking the appropriate method for breast cancer alternative diagnoses. Based on the training and testing, the result shows that the best kernel to build ECM SVM model for breast cancer classification is the polynomial kernel and the best feature extraction method is built by GLRLM texture analysis with an accuracy value 93.9757% in the SVM ECOC linear kernel as well as in SVM ECOC polynomial kernel.
Acknowledgment
Our gratitude goes to the Indonesian Ministry of Religious Affairs for giving a research grant in 2018.
- C. Nordqvist, “What You Need to Know About Breast Cancer,” 2018. [Online]. Available: https://www.medicalnewstoday.com/articles/37136.php.
- N. S. Mulyani, “Kanker Payudara dan PMS pada Kehamilan,” Jakarta Nuha Med., vol. 8, no. 2, pp. 1–3, 2013.
- A. Yuhana, Implementasi Metode K-Nearest Neighbor dan Artificial Neural Network untuk Memperkirakan Ketepatan Hasil Diagnosis Pasien Kanker Payudara. 2018.
- U. Ahmad, “Pengolahan Citra Digital dan Teknik Pemrogramannya,” Yogyakarta Graha Ilmu, 2005.
- M. S. Kavitha et al., “Texture Analysis of Mandibular Cortical Bone on Digital Dental Panoramic Radiographs for The Diagnosis of Osteoporosis in Korean Women,” Oral Surg. Oral Med. Oral Pathol. Oral Radiol., vol. 119, no. 3, pp. 346–356, 2015.
- R. C. Gonzalez and R. E. Woods, “Digital Image Processing.” Prentice hall Upper Saddle River, NJ, 2002.
- R. Manavalan and K. Thangavel, “Evaluation of Textural Feature Extraction from GRLM for Prostate Cancer Trus medical Images,” Int. J. Adv. Eng. Technol., vol. 2, no. 1, p. 401, 2012.
- W. N. H. W. Kairuddin and W. M. H. W. Mahmud, “Texture Feature Analysis for Different Resolution Level of Kidney Ultrasound Images,” in IOP Conference Series: Materials Science and Engineering, 2017, vol. 226, no. 1, p. 12136.
- A. K. Mohanty, S. Beberta, and S. K. Lenka, “Classifying Benign and Malignant Mass using GLCM and GLRLM Based Texture Features from Mammogram,” Int. J. Eng. Res. Appl., vol. 1, no. 3, pp. 687–693, 2011.
- S. Öztürk and B. Akdemir, “Application of Feature extraction and Classification Methods for Histopathological Image using GLCM, LBP, LBGLCM, GLRLM and SFTA,” Proc. Comput. Sci, vol. 132, pp. 40–46, 2018.
- N. Padmaja, T. Sudhir and D. E. S. Reddy, “A Hybrid Content Based Image Retrieval for Classification of Mammograms,” in International Journal of Engineering Research & Technology (IJERT), 2014, pp. 1122–1125.
- R. Llobet, R. Paredes, and J. C. Pérez-Cortés, “Comparison of Feature Extraction Methods for Breast Cancer Detection,” in Iberian Conference on Pattern Recognition and Image Analysis, 2005, pp. 495–502.
- T. K. Hazra and S. Dutta, “A New Approach to Identify the Fracture Zone and Detection of Bone Diseases of X-Ray Image,” Int. J. Sci. Res., vol. 5, no. 9, 2016.
- I. M. D. U. Putra, G. K. Gandhiadi, and L. P. I. Harini, “Implementasi Backpropagation Neural Network Dalam Prakiraan Cuaca di Daerah Bali Selatan,” E-Jurnal Mat., vol. 5, no. 4, pp. 126–132, 2016.
- D. C. Rini, “Klasifikasi Sinyal EEG Menggunakan Metode Fuzzy C-Means Clustering (FCM) Dan Adaptive Neighborhood Modified Backpropagation (ANMBP),” J. Mat. MANTIK”, vol. 1, no. 1, pp. 31–36, 2015.
- V. M. Zobin, “Development of the 10 – 11 July 2015 two-stage sequence of multiple emplacements of pyroclastic density currents at Volcán de Colima , México: Insight from associated seismic signals,” J. Volcanol. Geotherm. Res., vol. 351, no. July 2015, pp. 29–40, 2018.
- A. Z. Foeady, D. C. R. Novitasari, A. H. Asyhar, and M. Firmansjah, “Automated Diagnosis System of Diabetic Retinopathy Using GLCM Method and SVM Classifier,” in 2018 5th International Conference on Electrical Engineering, Computer Science and Informatics (EECSI), 2018, pp. 154–160.
- M. Feylizadeh, A. Hendalianpour, and M. Bagherpour, “A Fuzzy Neural Network to Estimate at Completion Costs of Construction Projects,” Int. J. Ind. Eng. Comput., vol. 3, no. 3, pp. 477–484, 2012.
- H. Sahraie, A. Ghaffari, and M. Amidpour, “Adaptive Neuro-Fuzzy Inference System (ANFIS) Approach to Evaluate The Debutanizer Top Product,” Int. J. Eng, vol. 6, no. 02, p. 8269, 2014.
- D. A. Adyanti, A. H. Asyhar, D. C. R. Novitasari, A. Lubab, and M. Hafiyusholeh, “Forecasts Marine Weather on Java Sea Using Hybrid Methods: TS-ANFIS,” in International Conference on Electrical Engineering, Computer Science and Informatics (EECSI), 2017, vol. 4.
- D. C. Rini, A. Z. Arifin, A. Fanani, G. B. D. Prasanda, and W. N. P. Sunaryo, “Penerapan Fuzzy Inference System Dalam Pengoptimalan Suhu Ruangan Pada Double Air Conditioner (Ac) Secara Otomatis,” MathVisioN, vol. 1, no. 1, pp. 11–16, 2019.
- D. C. Rini, A. H. Asyhar, M. Hafiyusholeh, G. Purnamasari, and Y. Monita, “Analisis Sinyal Ekg Aritmia untuk Deteksi Risiko Jantung Koroner Menggunakan Adaptive Neuro Fuzzy Inference (Anfis),” MathVisioN, vol. 1, no. 1, pp. 7–10, 2019.
- S. Suwanto, M. H. Bisri, D. C. R. Novitasari, and A. H. Asyhar, “Classification of EEG Signals using Fast Fourier Transform (FFT) and Adaptive Neuro Fuzzy Inference System (ANFIS),” J. Mat. MANTIK”, vol. 5, no. 1, pp. 35–44, 2019.
- F. F. Ting, Y. J. Tan, and K. S. Sim, “Convolutional neural network improvement for breast cancer classification,” Expert Syst. Appl., vol. 120, pp. 103–115, 2019.
- R. Diani, “Analisis Pengaruh Kernel Support Vector Machine (SVM) pada Klasifikasi Data Microarray untuk Deteksi Kanker,” Indones. J. Comput., vol. 2, no. 1, p. 109, 2017.
- S. Azhari, Y. Diputra, E. Juliastuti, and A. Z. Arifin, “Analisis Citra Radiografi Panoramik pada Tulang Mandibula untuk Deteksi Dini Osteoporosis dengan Metode Gray Level Cooccurence Matrix (GLCM),” MKB J, vol. 46, p. 207, 2014.
- D. C. R. Novitasari, “Klasifikasi Alzheimer dan Non Alzheimer Menggunakan Fuzzy C-Mean, Gray Level Co-Occurence Matrix dan Support Vector Machine,” J. Mat. MANTIK”, vol. 4, no. 2, pp. 83–89, 2018.
- J. Suckling et al., “Mammographic Image Analysis Society (MIAS) Database v1. 21,” 2015.