An Extension of Throughput Drop Estimation Model for Three-Link Concurrent Communications under Partially Overlapping Channels and Channel Bonding in IEEE 802.11n WLAN
 , Md. Manowarul Islam1 1, Md. Selim Al Mamun 2, Wen-Chung Kao 3, Minoru Kuribayashi 1
Adv. Sci. Technol. Eng. Syst. J. 4(4), 94–105 (2019);
 DOI: 10.25046/aj040411
The IEEE 802.11n wireless local-area network (WLAN) has been extensively deployed around the world due to the flexibility, lower cost, and the high-speed data transmission capability at 2.4 GHz ISM band. However, in the WLAN deployment, one key challenge is to optimize the channel assignment of access-points (APs) under the small number of partially overlapping channels (POCs) to reduce radio interference, particularly for the channel bonding. In POCs, the frequency spectrums of adjacent channels are partially overlapped with one another, which will result to low throughput for concurrently communicating links using them. The accurate throughput estimation of a link is critical in the optimal WLAN deployment. Previously, we studied the throughput drop estimation model using the receiving signal strength (RSS) from the interfered link for two concurrently communicating links under POCs. In this paper, based on measurement results, we have extended this model for three concurrently communicating links. The accuracy of this model extension is verified by comparing the estimated results with the measured ones.
1. Introduction
Nowadays, the IEEE 802.11 wireless local-area network
(WLAN) has been used across various sectors around the world, due to the unlicensed frequency bands in wireless medium and availability of low-cost devices [1]–[3]. It is suggested that WLAN has become a crucial business and the common asset [4]. For the access to the Internet using WLAN, a host is connected to an access point (AP) wirelessly, where the AP is connected to the Internet with wires. Therefore, a host can move randomly in the network area with the current association. As the data transmission speed increases due to technological advancements, WLAN has proved popular even for static settings of personal computers in offices and homes [5].
The IEEE 802.11 WLAN can function in two unlicensed frequency bands [6, 7]. One is the 2.4 GHz Industrial, Scientific, and Medical (ISM) band, and the other is the 5 GHz Unlicensed National Information Infrastructure (U-NII) band.
For either band, the IEEE 802.11 standards define the small number of channels for use. Each channel has 22 MHz width, conventionally called a 20 MHz channel. The frequency gap between two adjacent channels is merely 5MHz. Thus, the spectrums of adjacent channels are partially overlapped with one another, called the partially overlapping channels (POCs). Figure 1 shows the 2.4 GHz spectrum with 40 MHz channels to illustrate the POCs in IEEE 802.11n.
1ch 2ch 3ch 4ch 5ch 6ch 7ch 8ch 9ch10ch11ch12ch13ch
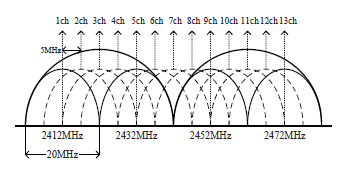 Figure 1: 40MHz channels at 2.4 GHz band.
While the IEEE 802.11 WLANs referred to in this paper use the unlicensed frequency bands, the Industrial, Scientific, and Medical (ISM) 2.4 GHz band and the Unlicensed National Information Infrastructure (U-NII) 5 GHz band, the 802.11y is licensed to use [8]. The unlicensed IEEE 802.11ad, which represents modifications of IEEE 802.11 physical layer (PHY) and medium access control layer (MAC) [9], provides the very high speed, which is equivalent to the fiber optic. However, its short range limitation coupled with the expensive hardware makes the global adoption of IEEE 802.11ad to be low [10].
Similarly, the IEEE 802.11af is advantageous due to its long-range transmission and low power consumption. However, it requires expensive band-specific hardware, which is not readily available in the global market where it is primarily used in US and Canada. In addition, since it utilizes the frequencies for unused TV channels, they may not be available everywhere [11].
The proposed model in this paper targets WLANs on the IEEE 802.11n unlicensed frequency band. Since this protocol has been widely adopted, the related devices are much easily and cheaply available, compared to those of emerging standards of the IEEE 802.11ad and IEEE 802.11af.
At the 2.4 GHz band, 13, 20MHz POCs are possible, which indicates that the number of orthogonal channels (OCs) is four at most. Since orthogonal channels do not overlap with one another, APs assigned OCs are not interfered for the medium access, if any pair of nearby APs do not operate on the same OC.
Currently, the IEEE 802.11n is most used in WLAN due to the high-speed data transmission capability at the 2.4 GHz band using the channel bonding that combines two neighboring 20 MHz channels together to form one 40 MHz channel as shown in Figure 1, [12]–[14]. Then, the number of OCs is reduced to at most two, and the channel assignment using OCs to the APs without interference cannot be avoided. [15] has shown that channel bonding improves performance, although it may increase frequency competition with adjacent LANs.
To overcome this limitation of the OC assignment in
WLAN, it has been reported that the POCs will be beneficial to enhance the performance by fully utilizing the available spectrum [16, 17]. Then, the throughput estimation model under POCs is essential to identify the proper POC assignment to the APs while evaluating the performance accurately. Specifically, in a dense WLAN, the model must consider the throughput drop caused by the interference that each AP suffers from the neighboring APs on the adjacent POCs.
Previously, we have studied the throughput estimation model for a single communicating link, which consists of the log-distance path loss model and the sigmoid function [18]. Then, we move to estimate the throughput drop caused by the interference for two concurrently communicating links under POCs [19]. It is examined according to the receiving signal strength (RSS) from the interfering link and the channel distance (chD) between the two links.
The proper use of POCs should be considered for the full utilization of the limited frequencies, since there are limited orthogonal channels available in the IEEE 802.11n protocol with the channel bonding. Besides, the estimated throughput should be directly used as the metric for selecting POCs by estimating the network performance, since the interference does not exhibit the exact performance of the network, which has been observed in this paper.
Our model considers the channel bonding and POCs, to directly estimate the throughput from the channel distance and the RSS of the interfering AP. From the estimated throughput, the POC assignment can be optimized under the channel bonding.
Besides, in our previous studies [20, 21], we considered the indoor network environment inside a building for the target field, since WLANs are usually deployed there. A lot of environmental factors, such as wall attenuations and multipath effects, can affect the throughput performance. To accurately estimate the throughput, we have developed the throughput estimation model that consider the environmental factors.
In this research work, we extend the throughput drop estimation model for three concurrently communicating links under POCs. Firstly, we conduct extensive measurements of receiving signal strength (RSS) and throughputs under three links. Then, we extend the model based on the measurement results.
To confirm the effectiveness of our proposal, we compare the estimated throughputs by the model with the measured ones, and through simulations. It has been demonstrated that the proposal can estimate the throughput for three interfered links under POCs with the considerably high degree of accuracy.
The rest of this paper is organized as follows: Section 2 describes related works. Section 3 discusses the implementations of the auto-channel selection in vendor AP devices and the significance of the throughput estimation model. Section 4 reviews our previous studies. Section 5 presents experiments with three concurrently communicating links under POCs. Section 6 proposes the model extension for them. Section 7 evaluates the proposal with experiments and simulations. Section 8 introduces the application to the channel assignment. Section 9 concludes this paper with future directions.
2. Related Works
In this section, we discuss specific works related to our proposal. A significant amount of research works have addressed the problem of interferences in WLAN to improve the throughput performance by applying partially overlapping channels.
In [22], Mishra et al. revealed that the orthogonal channel assignment to APs in WLAN is inefficient in a network field, if a substantial number of access points are deployed there. In such a case, the number of APs in the network field is higher compared to that of orthogonal channels, hence any AP could exist in the interference ranges of other APs as indicated in [23].
In [24], Mishra et al. also noted that partially overlapping channels have previously been avoided due to their interferences. However, through their model and measurements, it is demonstrated that the careful use of some POCs does not only improve the spectrum utilization but also the throughput performance.
In [25], Feng et al. proposed POCs as a means of reducing interference from the traditional use of OCs. Through testbed experiments, they reported that POCs offers better flexibility in wireless frequency allocation, and can increase overall network performance. Similarly, in [26], Zhang et al. proposed the use of POCs for interference management which outperforms the OCs.
In [27], Zhao et al. observed that with increased frequency reuse which has been reported in POCs, the network capacity can be scaled up through activating more APs in the network field as the expected distance from the users to their connected APs becomes smaller. However, it is reported that since POCs are partially overlapped with each other, one AP may suffer interference from multiple other APs. They conclude by proposing a need to have a maximum and a minimum bound for the number of APs based on the size of the network field and the number of POCs available.
In [28], Mukherjee et al. explored the AP selection, channel assignment, and the host association. They reported that the three aspects are critical in maximizing the throughput in WLAN, where the appropriate combination of both non-overlapping channels and POCs can further improve the overall throughput of the network.
In [29], Tewari et al. emphasized that multiple overlapping transmissions cause low network performance due to high interference from the limited non-overlapping channels. They have proposed a combined power control and POC assignment, where the former reduces the AP’s transmission and the interference range while the latter improves spatial reuse.
In [30], Zhao et al. demonstrated that the effect of interference on the network performance depends on the channel separation and the degree of frequency overlap among the interfered APs. In particular, it is noted that two interferes cause higher performance deterioration than a single interfere, but less than twice the interference caused by a single interfere or the summation of interference from the two interferes.
Furthermore, in [31], Su et al. measured the interference among the APs when POCs are used from the perspective of the physical characteristics of the communication. They reported a clear distinction between in-range and hidden terminal interferences with POCs, where the latter has worse throughput performance due to high packet loss.
In [28], POC interference is evaluated by considering the interference factor defined in [32]. Where more than one APs interferes, [27] [28] and [29] considers summation of interfering signal powers at the target node. However, since the MAC protocol lowers the data transmission rate of the target AP depending on the level of interference with individual interfere, calculating the summation may fail to identify a real value of interference.
At present, there is no research work that has proposed the throughput drop estimation model for multiple interfering APs under POCs that considers the channel distance and the interfering RSS.
3. Auto-channel Selection Implementations and Model Significance
In this section, we survey implementations of the autochannel selection in vendor AP devices, and discuss the significance of the throughput estimation model under it.
The auto-channel selection is the dynamic adjustment mechanism of the assigned channel to the AP, in order to avoid radio interferences from other WiFi devices. Each AP vendor has its own implementation approach.
In [33], Cisco describes their implementation of the autochannel selection, where the AP operating in the 2.4 GHz band with 11 POCs can be set only to one of the three orthogonal channels of 1, 6, and 11 under the non-bonded channels with the (20 MHz) width. It means that up to three APs can be assigned the channels. The assignment for other POCs must be done manually.
However, when the channel bonding with the (40 MHz) width is applied, which is commonly used in IEEE 802.11n WLANs to improve the throughput performance, the AP can have only one choice of channel 3, since all the other channels are partially overlapping with it. It means that the auto-channel selection cannot work for the channel bonding.
On the other hand, our proposal can assign any POC to the AP with the channel bonding by considering the throughput drop from the other up to two interfered links.
Besides, from our experimental observations, the orthogonal channels can interfere with each other when the APs are closely located together, which would further affect the auto-channel selection in the Cisco Meraki APs.
Furthermore, Cisco’s approach scans for a possible channel change after every 15 minutes, in addition to the three necessary situations: 1) a new AP joins the network, 2) the network administrator manually runs the auto-channel), and 3) the currently assigned channel fails to work. This would lead to the performance overhead, since the services of an AP must be stopped when channel change is applied. To avoid the frequent service stops, our approach changes channels of APs when an AP joins or leaves the network.
In [34], Fujitsu reports the auto-channel selection such that the total interference is minimized, where the details of the implementation are not given. However, the interference index is not a good metric to evaluate the throughput performance, because the interference and the throughput performance are not proportional as our paper reported. Instead, the throughput drop of each link from the other interfered links should be evaluated to more accurately estimate the network performance under a lot of interfered links.
In [35], Buffalo implements the auto-channel selection that tries to find the non-interfered channel for a new AP. By scanning all the channels, it selects a non-interfered channel if it exists. However, they also reported that the channel selection performs poorly, if no non-interfered channels exist. In real network environments, as demonstrated in our paper, several APs coexist together where any channel is interfered by an existing AP. On the other hand, our proposal is applicable in such real cases.
Similarly, in [36], Vodafone limits the auto-channel selection only to the non-interfered channels or the least interfered channel. In [37], Google WiFi works on the similar principle by selecting an orthogonal channel.
It should be pointed out that the proposed throughput estimation model can be incorporated into an auto-channel selection mechanism to improve the resulting performance of WLAN. Our model considers the channel bonding, POCs, and the direct throughput estimation. Therefore, we believe that this model can improve the auto-channel selection. In future works, we will compare the performance by our model with existing auto-channel selections.
4. Review of Throughput Estimation Model
In this section, we review our previous works.
4.1. Motivation of Empirical Model
In [5], Reis et al. indicates that most of physical protocol explorations with respect to interference may adopt simple abstract models with multiple assumptions, including that the signal propagation obeys a simple function of the distance, the radio coverage area forms a circle, and the interference range is twice of the transmission range. Unfortunately, experimental data using a real WLAN have shown that all of these models appear to be largely inaccurate [38, 39].
In contrast to a physical model, an empirical model is based on observations on actual network environments. Thus, the empirical model for interference in WLAN is expected to be more descriptive and accurate compared to a physical model. Therefore, we have developed the empirical throughput drop estimation model for multiple-link concurrent communications based on experimental results.
4.2. Definitions of Three Distances
The channel distance, the physical distance, and the link distance are defined to illustrate the throughput estimation model under partially overlapping channels.
4.2.1. Channel Distance
The channel distance (chD) of the two links is defined as the least channel difference between the channels of these links. For instance, if the two links are activated with the same channel, then chD is 0, and they will be entirely overlapped. When one link is assigned channel 3 and another link is channel 5, chD is 2, in this case, these channels are overlapped by 50% for 20MHz, and by 75% for 40MHz. The largest chD is 12 for 20MHz and 8 for 40MHz, in which any frequency overlapping does not exist theoretically.
4.2.2. Physical Distance
The physical distance (phD) is defined as the Euclidean distance between the two links. As it represents the separation distance among the interfering links, the farther the two links are placed, that is, the higher the physical distance is, the interference will become lesser. By increasing the physical distance between the links, the signal interference between them fades due to the path loss and the absorption by obstacles on the path.
4.2.3. Link Distance
The Euclidean distance between the sender and the receiver of the link is defined as the link distance. The longer link distance generally reduces RSS at the receiver and degrades the throughput.
4.3. Throughput Estimation Model
Generally, the throughput of a link will be affected by a variety of factors like the modulation and coding scheme (MCS), the transmission power, the transmission distance, and the channel interference [13, 40], which have made it hard for the theoretical calculation of the throughput. In [18], we proposed the throughput estimation model for the single link communication based on empirical results. This model first estimates the receiving signal strength (RSS) at the host using the log-distance path loss model [41]. Next, it estimates the throughput from the RSS using the sigmoid function.
4.3.1 Received Signal Strength Estimation
Firstly, the Euclidean distance d (m) between each link (AP/host pair) is calculated by:
![]() Here, APx, APy and Hx, Hy denotes the x and y coordinates for the AP and the host respectively.
Here, APx, APy and Hx, Hy denotes the x and y coordinates for the AP and the host respectively.
Then, RSS at the host from the AP is estimated by:
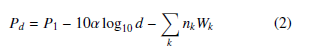 Here, Pd denotes RSS (dBm) at the host, P1 does RSS at the
1m distance from the AP where no obstacle exists, α does the path loss exponent, d (m) does the Euclidean distance calculated between the AP and the host, nk does the number of type k obstacles found on the path between the AP and the host, and Wk represents the signal attenuation factor (dB) for type k obstacle.
4.3.2 Throughput Estimation
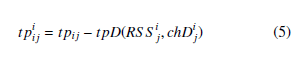
From Pd, the throughput is estimated by;
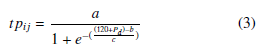 where tpij denotes the estimated throughput (Mbps) and, a, b, and c are constant coefficients.
4.4. Throughput Drop Estimation Model for Two-Link Concurrent Communications
In [19], we proposed the throughput drop estimation model to consider the frequency interference between concurrently communicating adjacent two links using interfering channels. The throughput drop of the target link can be estimated by the receiving signal strength at the receiver, called the interfering RSS, (RSS i), from the interfered link, and the channel distance chD between the two links:
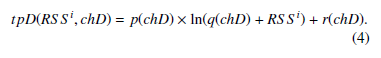 where tpD(RSS i,chD) represents the estimated throughput drop (Mbps), and p(chD), q(chD), and r(chD) represent constants determined by the channel distance (chD).
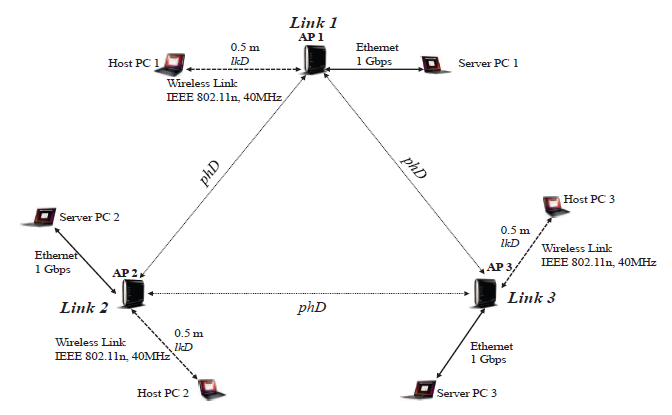 Figure 2: Measurement setup.
The values of the three constants p, q, and r in the model were obtained from the throughput drop measurement results for every channel distance. Table 1 shows them.
Table 1: Constants for each channel distance.
| channel distance | p | q | r |
| 0 | 27 | 88.17 | -20 |
| 1 | 27 | 87.36 | -20 |
| 2 | 27 | 89.00 | -22 |
| 3 | 25 | 94.50 | -22 |
| 4 | 33 | 92.00 | -56 |
| 5 | 34 | 92.00 | -57 |
| 6 | 45 | 91.00 | -98 |
| 7 | 45 | 88.00 | -100 |
| 8 | 40 | 75.50 | -80 |
Then, the throughput estimation model under POCs for two interfered links is modified by:
 where tpiij represents the throughput of the target link from node i to node j under the interference from the interfered link, tpij does the throughput of this link estimated by the original model, RSS ij does RSS from the interfered link at node j, and chDij does the channel distance between the two links.
5. Experiments in Three-Link Concurrent Communications
In this section, we present the experiment results to examine the extension of the throughput drop estimation model for three concurrently communicating links.
5.1. Experiment Setup
Table 2 indicates the necessary devices and software used in the experiments. It is noticed that if different devices are used, the parameter values of the model will vary accordingly.
Table 2: Measurement devices and software.
| Access Point (all links) | |
| maker/ type | NEC WG2600HP |
| protocol | IEEE 802.11n |
| operating band | 2.4 GHz |
| frequency width | 40 MHz |
| host PC (all links) | |
| maker/ type | Toshiba dynabook R731/B |
| operating system | Ubuntu 14.04 LTS |
| processor | Intel Core i5-2520M 2.54 Ghz |
| network adapter | Intel HM65 Express chipset |
| server PC (link1) | |
| maker/ type | Toshiba dynabook R731/B |
| processor | Intel Core i5-2520M 2.54 Ghz |
| operating system | Ubuntu 14.04 LTS |
| network adapter | Intel HM65 Express chipset |
| server PC (link2, link3) | |
| maker/ type | Fujitsu lifebook S761/C |
| processor | Intel Core i5-2520M 2.5GHz |
| operating system | Ubuntu 14.04 LTS |
| network adapter | Mobile Intel QM67 Express |
Figure 2 shows the topology of three links (link1, link2 and link3) in experiments. The server PC connects to the AP through the Gigabit Ethernet, and the host PC is connected to the AP by the 11n wireless link. The host is 0.5m from its connected AP, and each AP is 5m from the other AP. The maximum transmission power is selected for any AP with the equal antenna gain [16]. The minimax AP setup optimization approach in [18] is applied to maximize the throughput for each link. The iperf 2.05 [42] is used to generate the TCP traffic between the server and the host.
5.2. Experiment Fields
The experiments were carried out in indoor fields on the 2nd floor of Graduate School of Natural Science and Technology Building and the 3rd floor of Engineering Building #2 in Okayama University. Each field consists of several rooms, walls, and floors, which can affect the throughput through the multi-path effect. RSS i and the throughputs are measured while increasing the physical distance, phD, between the two APs and their channel distance, chD. By using Homedale [43], the frequencies of the links under measurements and the external interfering links are recorded. Figure 3 shows the site while Figure 4 reveals the frequency utilization for measurements, where several channels are highly utilized by non-target APs.
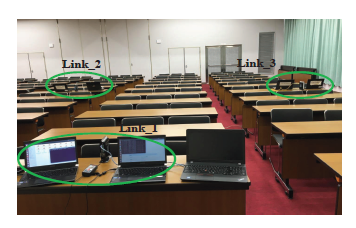 Figure 3: Experiment in Graduate School Building.
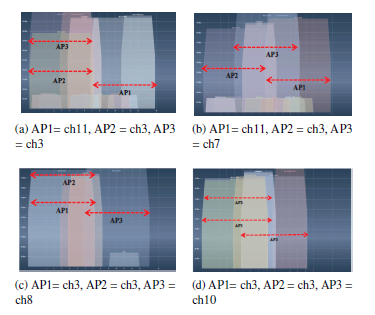 Figure 4: Frequency utilization in experiments.
5.3. Experimental Results
For AP1 (and AP2 for three links), the bonded channel 3 is always assigned. For AP2 (AP3 for three links), the assigned channel is changed from 3 to 11 one by one, so that the channel distance chD increases from 0 to 8. The throughput was measured at the same time for all the links. The experiments were conducted on weekends and at night on weekdays to reduce the interference from other Wi-Fi devices.
Figures 5 and 6 show measured individual and average throughput under concurrently communicating two links and three links, respectively. The individual throughput fluctuates, because the contention among the links is not well resolved by the current carrier sense mechanism [44], which may cause the unfair channel occupation among them. Thus, in this paper, we use the average throughput among them for the single link throughput.
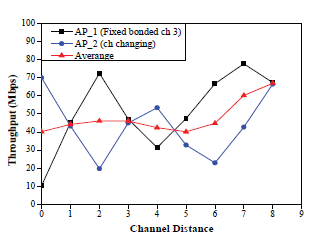 Figure 5: Throughput results for two links.
Figure 6 demonstrates that when the three APs are assigned the same channel, one AP takes the entire medium, which makes the others have the lower throughput. As chD increases, the throughput of AP3 will enhance gradually, due to the reduced channel interference.
In this experimental setup, the measured maximum throughput of one link is about 140Mbps under no interference. Then, it drops significantly to about 40Mbps under two links, when the channel distance is smaller than seven. Furthermore, it drops to about 20Mbps under three links.
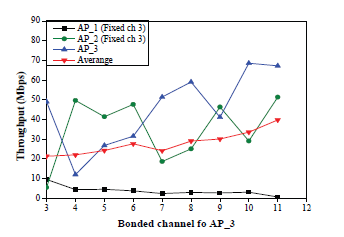 Figure 6: Throughput results for three links.
5.4. Observations from Experiment Results
According to the evaluation, it is observed that for the target link, the interference from the first interfering link causes the larger throughput drop (from 140Mbps to 40Mbps), and the interference from the second causes the smaller drop (from 40Mbps to 20Mbps). That is to say, when the target link is interfered by the first link, the rate adaptation mechanism lowers the transmission rate by adopting the robust MCS. Then, the second interfering link further lowers the rate by adopting the more robust MCS [30][31]. Here, the rate can be lowered exponentially in MCS.
6. Model Extension for Three-Link Concurrent Communications
In this section, we present the extension of the throughput drop estimation model for three concurrently communicating links based on experimental results.
6.1. Idea of Throughput Drop Estimation under Three Links
As observed before, the throughput drop from multiple interfering links can be estimated one by one through calculating each drop using the model in Section 4.4 in descending order of the interference. That is, the drop from the link with the largest interference is first estimated, assuming the original maximum throughput. Then, the drop from the link with the second largest interference will be estimated, assuming the maximum throughput has been reduced by the first drop.
6.2. Throughput Drop Estimation Procedure
The throughput of the target link linkij under three-link concurrent communications is evaluated by the following procedure:
- Estimate the throughput of each of the three concurrently communicating links using the original model in Section 4.3.
- Estimate the throughput drop tpD from each of the two interfering links using Eq. (4) in Section 4.4.
- Sort them in the descending order: let tpD1st and tpD2nd.
- For the largest interfering link, adjust tpD1st by the maximum speed of the AP of the target link, because different APs have different throughput performances:
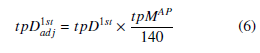 where tpD1adjst represents the adjusted throughput drop by the largest interfering link, and tpMAP does the maximum throughput for the AP of the target link.
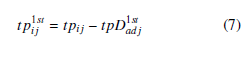
Then, the throughput tp1ijst of the target link after considering the drop by the first link interference is estimated by:
 For the second largest interfering link, adjust the tpD2nd by;
 Then, the throughput tp2ijnd of the target link after considering the drop by the second link interference can be estimated by;
![]() In [31], Su et al. observed that the throughput drop by the accumulated interference from two interfering links is greater than that from a single interferer, but less than the sum of the drops from the individual interference. The second interfering link will cause a smaller drop than the first one. This observation also supports our throughput drop estimation model for concurrently communicating three links.
In [31], Su et al. observed that the throughput drop by the accumulated interference from two interfering links is greater than that from a single interferer, but less than the sum of the drops from the individual interference. The second interfering link will cause a smaller drop than the first one. This observation also supports our throughput drop estimation model for concurrently communicating three links.
7. Evaluations of Model Extension
In this section, we evaluate the throughput drop estimation model for three concurrently communicating links under POCs and the channel bonding through experiments and simulations.
7.1. Experiment Results in One Room
First, the devices and one-room field in Sections 5.1 and 5.2 are used in experiments.
7.1.1. Channel Assignments
In experiments, the bonded channel 3 is always assigned to
AP1. Then, the either channel of 3, 7, and 11 is assigned to AP2. To AP3, the assigned channel is moved from 3 to 11 one by one so that the channel distance is changed. The throughputs are measured at the same time for all the links.
7.1.2. Throughput Results
Figures 7, 8, and 9 show the measured average throughput among the three APs when the channel 3, 7, and 11 is assigned AP2, respectively.
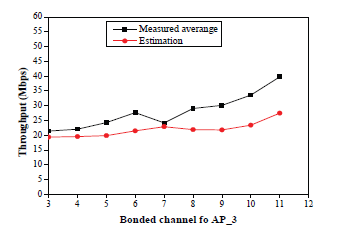 Figure 7: Throughput results in one room for AP1:ch3, AP2:ch3.
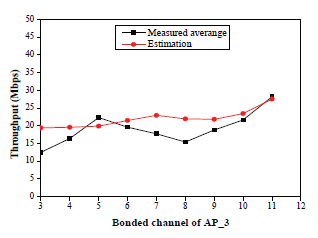 Figure 8: Throughput results in one room for AP1:ch3, AP2:ch7.
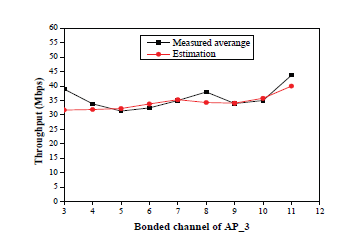 Figure 9: Throughput results in one room for AP1:ch3, AP2:ch11.
When the three results are compared, Figure 8 indicates the lowest throughput among them, because AP2 is interfered with both AP1 and AP3. Figure 9 presents the highest throughput in general, because AP1 and AP2 are not interfered. On the other hand, Figure 7 shows that as the channel distance increases, the throughput will raise as the reduction of the interference between (AP1 and AP2) with AP3.
Then, the estimated throughput is calculated by the proposed throughput drop estimation model, and is compared with the measured throughput. Figures 7- 9 demonstrate that these throughput are similar in any case. Thus, the accuracy of the proposed model for three concurrently communicating links is confirmed.
7.2. Experiment Results in Three Rooms
Next, the experiments are conducted using three rooms on the 3rd floor of Engineering Building #2 to examine the accuracy of the model.
7.2.1. Experiment Field
The physical distance between the APs is changed by locating each AP in a different room from the previous experiments, as revealed in Figure 10. By locating each AP in a separate room, the overall interference between them is reduced. The link distance between the AP and its associated host is set 0.5m or 4m. The channel assignments in Section 7.1.1 are adopted.
3rd Floor, Engineering Building No.2, Okayama University.
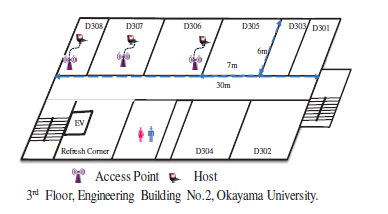 Figure 10: Three room topology.
7.2.2. Throughput Results with 0.5m Link Distance
Figures 11 – 13 show the measured and the estimated throughput results when the link distance is 0.5m. These throughput turns out to be similar at any channel distance, which confirms the accuracy of the proposed model. At the same time, they are higher than the ones in Figures 7- 9, since they are less interfered here.
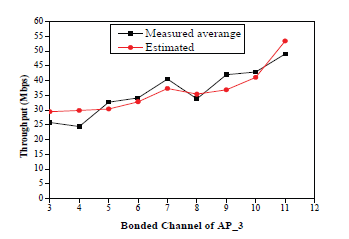 Figure 11: Throughput results in three rooms with 0.5m link distance for AP1:ch3, AP2:ch3.
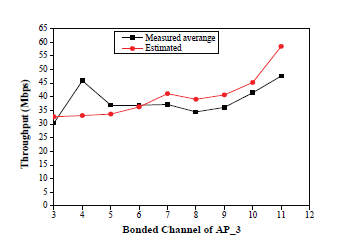 Figure 12: Throughput results in three rooms with 0.5m link distance for AP1:ch3, AP2:ch7.
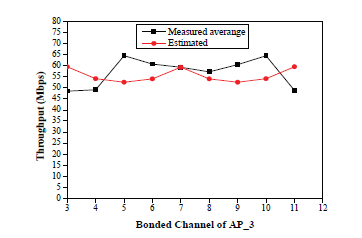 Figure 13: Throughput results in three rooms with 0.5m link distance for AP1:ch3, AP2:ch11.
7.2.3. Throughput Results with 4m Link Distance
Figures 14- 16 show the measured and the estimated results when the link distance is 4m. In Figures 15 and 16, they are similar at any channel distance. Thus, the accuracy of the model is verified in the larger link distance as well. However, in Figure 14, the measured throughput is lower than the estimated one at each channel distance. This is because the interference from non-target APs in the field is stronger around the channel 3, as shown in Figure 4. It is a must to conduct experiments in environments with less interference, which will be included in future works.
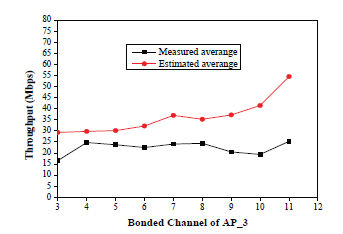 Figure 14: Throughput results in three rooms with 4m link distance for AP1:ch3, AP2:ch3.
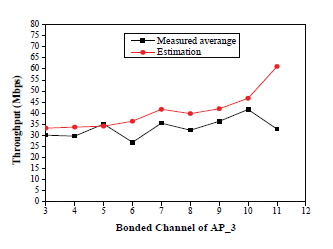 Figure 15: Throughput results in three rooms with 4m link distance for AP1:ch3, AP2:ch7.
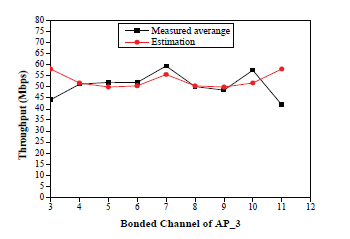 Figure 16: Throughput results in three rooms with 4m link distance for AP1:ch3, AP2:ch11.
8. Application to Channel Assignment
In this section, we discuss the application of the proposed throughput drop estimation model to the POC assignment to the APs.
8.1. Modification of Channel Assignment Phase
The channel assignment phase of the active AP configuration algorithm in [45] is modified to assign POC using the proposed model. Specifically, the formulations for this phase are revised from the previous one in [45] as follows:
8.1.1 Modification of Input
The number of partially overlapping channels is adopted in place of the number of orthogonal channels for C.
8.1.2 Modification of Output
The partially overlapping channel assigned to every active
AP is adopted rather than the orthogonal channel assigned to every active AP.
8.1.3 Modification of Objective
The total interfered communication time E3 is modified to consider partially overlapping channels by:
 where ITii denotes the interfered communication time under partially overlapping channels for APi.
Under POCs, the link speed drop by the interfered links needs to be examined in the throughput estimation model. Therefore, ITii can be simply given by:
 where AHi denotes the set of hosts associated with APi.
Our current throughput estimation model for partially overlapping channels only examines the interference between three links. In this paper, we assume that the target link is interfered by the two strongest interfering links, while the other interfering links may have negligible effects. This can be supported by the results in Section 5.4, where the highest interfering link causes the large drop and the second link causes the far small drop.
8.2. Evaluations by Simulations
First, we evaluate the performance of the POC assignment via simulations.
8.2.1 Simulation Platform
The WIMNET simulator [46] is adopted for simulations. Table 3 sums up the parameters for simulations [45].
Table 3: Simulation Parameters in WIMNET Simulator.
| parameter | value |
| packet size | 2360 bytes |
| max. transmission rate | 150 Mbit/s |
| propagation model | log-distance path loss model |
| rate adaptation model | sigmoid function |
| carrier sense threshold | −85 dBm |
| transmission power | 19 dBm |
| collision threshold | 10 |
| RTS/CTS | yes |
8.2.2 Results for Random Topology
To evaluate the performance in various network environments for WLAN, first, the random topology is considered. As shown in Figure 17, in this topology we consider a network field of size 800m×200m, where two rooms are located, each of length 400m. Eight APs and 25 hosts are allocated randomly.
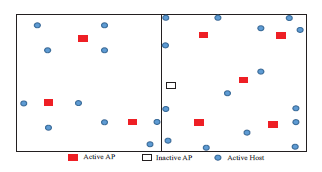 Figure 17: Random topology for channel assignment.
Then, the minimum host throughput and the overall throughput are compared between the POC assignment and the conventional OC assignment through simulations. Two channels (3, 11) are used for the OC assignment all the time. On the other hand, three channels (3, 7, 11), six channels (3, 5, 7, 8, 9, 11), and nine channels (3, 4, 5, 6, 7, 8, 9, 10, 11) are used for the POC assignment. Table 4 shows the results.
Table 4: Throughput results for random topology.
| channel assignment | OC | POC | ||
| # of channels | 2 | 3 | 6 | 9 |
| min. host throu. (Mbps) | 7.12 | 9.16 | 8.42 | 8.63 |
| overall throu. (Mbps) | 174.56 | 196.74 | 197.04 | 198.46 |
8.2.3 Results for Regular Topology
Next, the regular topology in the third floor of Engineering Building #2 at Okayama University is considered. The room size is either 7m × 6m or 3.5m × 6m. Eight APs and 55 hosts are regularly allocated, as signified in Figure 18.
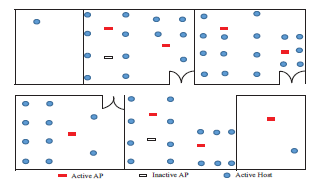 Figure 18: Regular topology.
The same two, three, six, and nine channels as for random topology are considered. Table 5 shows the minimum host throughput and the overall throughput for them.
It is noted that in both topologies, as the number of POCs is increased, the overall throughput will enhance by reducing the interference while maintaining the minimum host throughput.
Table 5: Throughput results for regular topology.
| channel assignment | OC | POC | ||
| # of channels | 2 | 3 | 6 | 9 |
| min. host throu. (Mbps) | 2.68 | 3.11 | 3.06 | 3.15 |
| overall throu. (Mbps) | 147.76 | 170.88 | 168.76 | 173.49 |
8.2.4 Results for Regular Topology with Large APs
Finally, in Figure 19 we evaluate the model by simulations in a new instance by increasing the number of APs from 8 to 10 in the regular topology. The number of hosts remains as 55.
The evaluation in a real environment using the testbed is more important to confirm the effectiveness of the model. Thus, it will be in our future studies.
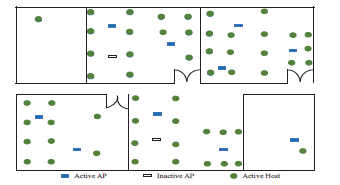 Figure 19: Regular topology for 10 APs.
Table 6 shows the results. As the number of APs increases, the total performance also increases, because more hosts can be located nearer to the APs, which increase the throughputs of them.
Table 6: Throughput results for regular topology on 10 APs.
| channel assignment | OC | POC | ||
| # of channels | 2 | 3 | 6 | 9 |
| min. host throu. (Mbps) | 3.97 | 4.66 | 4.49 | 4.55 |
| overall throu. (Mbps) | 218.24 | 250.72 | 247.29 | 251.24 |
8.3. Evaluations by Experiments
Lastly, the throughput of the POC assignment is evaluated through experiments using the two-rooms topology in Figure 20. Two channels 3 and 11 are used for the OC assignment, and three channels 3, 7, and 11 are for the POC.
Table 7 shows the simulation and measurement results.
This table indicates the following: 1) the POC assignment improves the overall throughput, and 2) the estimated throughput is well coincident with the measured one. The accuracy of the throughput estimation model and the effectiveness of the POC assignment are confirmed.
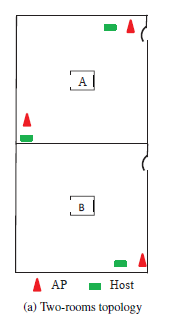 Figure 20: Two-rooms topology.
Table 7: Throughput results for Two-room topology.
| channel assignment | OC | POC |
| # of channels | 2 | 3 |
| measurement (Mbps) | 146.36 | 158.2 |
| simulation (Mbps) | 143.5 | 157.31 |
9. Conclusion
In this paper, we presented the throughput drop estimation model extension for concurrently communicating three IEEE 802.11n links under partially overlapping channels (POCs) and the channel bonding. Also, we proposed the model application to the POC assignment to the access-points in WLAN. Through extensive experiments and simulations, we confirmed the accuracy of the model and the effectiveness of the POC assignment. In future, we will upgrade this model for four or more interfering links. Then, we will evaluate it in a variety of network scenarios, such as for dense WiFi environments.
Acknowledgments
This work is partially supported by JSPS KAKENHI (16K00127).
- M. Balazinska, and P. Castro, “Characterizing mobility and network usage in a corporate wireless local-area network,” in Proc. Int. Conf. Mob. Syst., pp, 303 – 316, 2003.
- M. Elkhodr, S. Shahrestani, and H. Cheung, “Emerging wireless technologies in the Internet of things: A comparative study,” Int. J. Wirel. Mob. Netw. (IJWMN) vol. 8, no. 5, pp 67-82, Oct. 2016.
- A. B. Makhlouf and M. Hamdi, “Design and experimentation of rate adaptation for IEEE 802.11n WLANs,” IEEE Trans. Wirel. Comm., vol. 12, no. 2, pp. 908916, Aug. 2011.
- S. Murthy, A. Goswami, and A. Sen, “Interference-aware multicasting in wireless mesh networks,” in Proc. Networking, pp. 299-310, 2007.
- C. Reis, R. Mahajan, M. Rodrig, D. Wetherall, and J. Zahorjan, “Measurement-based models of delivery and interference in static wireless networks,” in Proc. Conf. Appl., Tech., Arch. Proto. Comput. Comm., pp. 51-62, 2006.
- Supplement to IEEE standard for information technology telecommunications and information exchange between systems – local and metropolitan area networks – specific requirements. Part 11: wireless LAN medium access control (MAC) and physical layer (PHY) specifications: high-speed physical layer in the 5 GHz band, IEEE STD 802.11a-1999, 1999.
- IEEE Std 802.11-2012, IEEE standard for information technologytelecommunications and information exchange between systems – local and metropolitan area network – specific requirements – Part 11: wireless LAN medium access control (MAC) and physical layer (PHY) specifications, IEEE STD 802.11-2007, pp. 1184, 2007.
- IEEE Standards Association, https://standards.ieee.org/ standard/802_11y-2008.html, Accessed 28 May, 2019.
- IEEE Standards Association, https://standards.ieee.org/ standard/802_11ad-2012.html, Accessed 29 May, 2019.
- T. Nitsche, C. Cordeiro, A. B. Flores, E. W. Knightly, E. Perahia, and J. C. Widmer, “IEEE 802.11ad: Directional 60 GHz Communication for Multi-Gigabit-per-Second Wi-Fi,” IEEE Comm. Magazine, vol. 52, no. 12, pp 132-141, Dec. 2014.
- S. Banerji, “Upcoming Standards in Wireless Local Area Networks,” Wirel. Mob. Tech., vol. 1, no. 1, pp 6-11, 2013.
- “IEEE 802.11n – standard for wireless LAN medium access control (MAC) and physical layer (PHY): enhancements for high throughput,” IEEE, Oct. 2009.
- T. D. Chiueh, P. Y. Tsai, and I. W. Lai, “Baseband receiver design for wireless MIMO-OFDM communications,” 2nd ed., Wiley-IEEE Press, 2012.
- L. Deeky, E. Garcia-Villegas, E. Belding, S. J. Lee, and K. Almeroth, “Intelligent channel bonding in 802.11n WLANs,” IEEE Trans. Mob. Comput., vol. 13, no. 6, pp. 1242-1255, 2014.
- B. Boris, C. Alessandro, Z. Alessandro, B. Jaume, “On the interactions between multiple overlapping WLANs using channel bonding,” IEEE Trans. Vehi. Tech., vol. 65, no. 2, Feb. 2015.
- S. Bokhari and V. Zaruba, “i-POCA: interference-aware partially overlapping channel assignment in 802.11-based meshes,” in Proc. IEEE WoWMoM, 2013.
- K. Zhou1, X. Jia, Y. Chang, and X. Tang, “Partially overlapping channel assignment for WLANs using SINR interference model,” IInt. J. Comm. Syst, vol. 27, no. 11, pp. 3082-3095, March 2014.
- K. S. Lwin, N. Funabiki, C. Taniguchi, K. K. Zaw, M. S. A. Mamun, M. Kuribayashi, and W.-C. Kao, “A minimax approach for access point setup optimization in IEEE 802.11n wireless networks,” Int. J. Netw. Comput., vol. 7, no. 2, pp. 187-207, July 2017.
- I. M. Kwenga, N. Funabiki, M. Kuribayashi, R.W. Sudibyo, andW.-C. Kao “A throughput estimation model under two-link concurrent communications with partially overlapping channels and its application to channel assignment in IEEE 802.11n WLAN”, Int. J. Space-Base. Situ. Comput., vol. 8, no. 3, pp. 123-137, 2018.
- M. E. Islam, N. Funabiki, and T. Nakanishi, “An access-point aggregation approach for energy-saving wireless local area networks”, IEICE Trans. Commun., vol. E96-B, no.12, pp. 2986-2997, Dec. 2013.
- M. E. Islam, N. Funabiki, and T. Nakanishi, “Extensions of accesspoint aggregation algorithm for large-scale wireless local area networks”, Int. J. Netw. Comput., vol.5, no.1, pp. 200-222, Jan. 2015.
- A. Mishra, E. Rozner, S. Banerjee, and W. Arbaugh, “Exploiting partially overlapping channels in wireless networks: turning a peril into an advantage,” in Proc. ACM Conf. Inter. Meas., pp. 311-316, 2005.
- M. Elwekeil, M. Alghoniemy, M. El-Khamy, H. Furukawa, and O. Muta, “Optimal channel assignment for IEEE 802.11 multi-cell WLANs,” in Proc. Signal Proc. Conf., pp. 694-698, 2012.
- A. Mishra, V. Shrivastava, S. Banerjee, and W. Arbaugh, “Partially overlapped channels not considered harmful”, in Proc. Joint Int. Conf. Meas. Model. Comp. Sys., pp. 63-74, 2006.
- Z. Feng and Y. Yang, “How much improvement can we get from partially overlapped channels?” in Proc. IEEE WCNC, pp. 2957-2962, April 2008.
- Z. Zhang, L. Song, Z. Han, and W. Saad, “Coalitional games with overlapping coalitions for interference management in small cell networks”, IEEE Trans. Wireless Comm., vol. 13, no. 5, pp. 2659-2669, May, 2014.
- W. Zhao, H. Nishiyama, Z. Fadlullah, N. Kato, and K. Hamaguchi, “DAPA: capacity optimization in wireless networks through a combined design of density of access points and partially overlapped channel allocation”, IEEE Trans. Vehi. Tech., vol. 65, no. 5, pp. 3715- 3722, May 2016.
- S. Mukherjee and S. C. Ghosh, “Throughput improvement using partially overlapping channels in WLAN with heterogeneous clients”, Wired/Wireless Inter. Comm., pp. 335-347, 2016.
- B. P. Tewari, and S. C. Ghosh, “Combined power control and partially overlapping channel assignment for interference mitigation in dense WLAN”, in Proc. IEEE Int. Conf. Adv. Info. Netw. Appli., pp.646-653, March 2017.
- G. Zhao, Q. Wang, C. Xu, and S. Yu, “Analyzing and modelling the interference impact on energy e_ciency of WLANs”, in Proc. IEEE Int. Conf. Comm., May 2018.
- Y. Su, Y. Wang, Y. Zhang, Y. Liu, and J. Yuan, “Partially overlapped channel interference measurement implementation and analysis”, in Proc. IEEE Conf. Comp. Comm. Work., pp. 760-765, April 2016.
- H. A. Mohammad, H. Xiaoyan, A. Farhana, “Multiple radio channel assignment utilizing partially overlapped channels”, in Proc. IEEE GLOBECOM conf., pp. 4737-4743, 2009.
- Cisco Meraki, https://documentation.meraki.com/MR/ Radio_Settings/Auto_Channel, Accessed 30 May, 2019.
- Fujitsu corporation https://www.fujitsu.com/global/about/ resources/news/press-releases2015/0909-01.html, Accessed 30 May 2019.
- Bu_alo corporation, http://buffalo.jp/download/manual/html/air1200/router/whrg300n/chapter118.html, Accessed 30 May 2019.
- Vodafone corporation, http://www.vodafone.co.uk/ cs/groups/public/documents/contentdocuments/ vfcon090503.pdf, Accessed 30 May 2019.
- Google WiFi, https://support.google.com/wifi/thread/ 412017?hl=en Accessed 30 May 2019.
- C. Newport, D. Kotz, Y. Yuan, R. S. Gray, J. Liu, and C. Elliott, “Experimental evaluation of wireless simulation assumption,” J. Simu., vol. 83, no. 9, pp. 643-661, Sept. 2007.
- J. Padhye, S. Agarwal, V. N. Padmanabhan, L. Qiu, A. Rao, and B. Zill, “Estimation of link-interference in static multi-hop wireless networks,” in Proc. ACM IMC, pp. 28, Oct. 2005.
- M. S. A. Mamun, N. Funabiki, M. E. Islam, M. Kuribayashi and I-W. Lai, “An active access-point configuration algorithm for elastic wireless local-area network system using heterogeneous devices,” Int. J. Netw. Comput., vol. 6, no. 2, pp. 395-419, 2016.
- D. B. Faria, “Modeling signal attenuation in IEEE 802.11 wireless LANs,” Tech. Report, TRKP06-0118, Stanford Univ., July 2005.
- iPerf – TCP, UDP and SCTP network bandwidth measurement tool, https://iperf.fr/, Accessed 29 Dec. 2017.
- Homedale: Wi-Fi / WLAN Monitor (2017, Dec.), http://www. the-sz.com/products/homedale/.
- L. B. Jiang and S. C. Liew, Improving throughput and fairness by reducing exposed and hidden nodes in 802.11 networks, IEEE Trans. Mob. Comput., vol. 7, no. 1, pp. 34-49, Jan. 2008.
- M. S. A. Mamun, N. Funabiki, K. S. Lwin, M. E. Islam, and W.-C. Kao, “A channel assignment extension of active access-point configuration algorithm for elastic WLAN system and its implementation using Raspberry Pi,” Int. J. Netw. Comput., vol. 7, no. 2, pp. 248-270,July 2017.
- N. Funabiki, ed., “Wireless mesh networks,” InTech-Open AccessPub., Jan. 2011. http://www.intechopen.com/books/ wireless-mesh-networks, Accessed 20 Jan., 2017.