
Career Recommendation System for Scientific Students Based on
Ontologies
Volume 4, Issue 4, Page No 29-41, 2019
Author’s Name: Alimam Mohammed Abdellaha), Alimam Mohammed Karim, Seghuiouer Hamid
View Affiliations
Abdelmalek Essaˆadi University, Avenue Khenifra, T´etouan 93000, Morocco
a)Author to whom correspondence should be addressed. E-mail: ma.alimam@gmail.com
Adv. Sci. Technol. Eng. Syst. J. 4(4), 29-41 (2019); ![]() DOI: 10.25046/aj040404
DOI: 10.25046/aj040404
Keywords: Guidance, Grades, Ontologies, Science Process Skills, Education

Export Citations
Students are usually unaware of their own skills. They choose to follow the trend, rather than the proper pathway. Which negatively a_ects the professional sector, and the development of the country. Orienting students, and guiding them would o_er considerable benefits. Building the appropriate student’s profiles is the golden key for an accurate orientation. To do so, relying on the simple use of the grade point average (GPA) will not be su_cient, and mislead the guidance. Instead, studying their personality and skills has to be done, in order to provide them with their reel orientation. The presented solution aims to orient students to the most suitable career, based on a mathematical model, valid for all education systems, and takes into account the trades trends and students capabilities.
Received: 18 March 2019, Accepted: 05 July 2019, Published Online: 11 July 2019
1. Introduction
This paper is an extension of work originally presented in conference Computing Conference, London, UK 2017 [1].
Education has an important function in the economic development. Its anticipation and success are among the factors that explain the essential differences in standards of living between different countries. Recently Romer, Lucas, Mankiw have shown that education is the engine of economic growth [2]: In [3], the author shows that education is the basic need of every individual. Nowadays, anyone is concerned about selecting the right institution, that suits better his choices and interests. In making these decisions, individuals must consult a large number of physical records and institutional perspectives. To make the right decision becomes a hard mission for them [3].
Although career choice is fundamental to the future of the individual, the assignment is done in an unqualified, unreliable way. On the other hand, the use of new technologies has become a necessity nowadays in all areas. The benefits they can bring are unmistakable. This has led scientists and researchers to find the most optimal way to use, implement, and benefit as best as possible. According to [4] several economic and socio-educational problems can be solved by introducing genuine career guidance in the education system.
By providing guidance to students, their academic and professional success is greatly enhanced by helping them discover their interests, values, and skills [5].
Without the latest user information, user profiling would be more difficult. In fact, data is available across multiple platforms, where users interact with different web content: social activities, online learning platforms, and more. Proper use of this data will significantly help to build a profile of these users in any system. [6], [7]. In this context, building profiles based on ontology for career recommendation is proposed in this paper.
This paper consists of five sections: First, it starts with a description of the Moroccan education system (MES). After that, it introduces the classification of students based on a combination of grades and skills. Then, it focuses on the prerequisites needed to integrate the desired field or pathway. It continues by describing our solution for career recommendation. Finally, it’ll conduct an experiment on different students, and evaluate the effectiveness of the proposed solution as shown in figure 1 and 2.
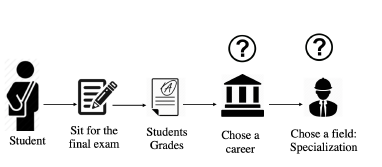 Figure 1: Problematic of career guidance
2. State of the Art
2.1. General Context
In [8], the author defined ’Career guidance and orientation’ as: a procedure that helps the individual to make himself known and understand with himself, and the world of work, with the specific purpose of making professional, instructive life choices.
Services that intend to set any person at any phase of his life, in order to make educational, training or occupational choices or manage his career’ is another definition made by [9].
Though, in the MES, students select a pathway, without consideration of their personal skills and capabilities. The main cause is the strong dependence between the assignment and the cumulative grade point average (GPA): The higher your GPA, the more likely you are to integrate your desired filed, even if you do not have the required skills. Which penalizes the education system, as well as the students, causing them to miss their careers. In [10], the author emphasizes that, reflection and personalization can be directly related to student profiles to resolve this issue.
The objective of this work is to offer a guidance system to scientific students, at any stage. In [11], a model for guiding the 9th Grade students in an e-learning context was presented. Still, this solution couldn’t work on the higher level studies: the 9th Grade students study roughly the same materials as in the first year of high school. But it’s not the general situation: students will study subjects totally different from what they have in their current year. Which prevents us from comparing these subjects.
In [12], Amines proposed a solution for affecting the 9th’s grades, of the MES (Described in detail in Chap 2.2) student to their adapted pathway.
However, this model couldn’t be applied in a higher scale. It wouldn’t work on the students of preparatory classes for the integration of engineering school (PCGE), because it wouldn’t be possible to compare their actual subjects with the ones that that’ll encounter in the engineering schools.
Then, in [1], the author came up with a solution by developing an automated system that realizes the affectation of the PCGE students t to their adapted engineering specializations, by converting the extracted to the same type.
After that, in [13], a general model for career recommendation was established, enabling the guidance of scientific students, at any stage on their life.
In this paper, students profiles will be built by the aid of ontologies, allowing more performance and accuracy for the proposed solution, of career recommendation.
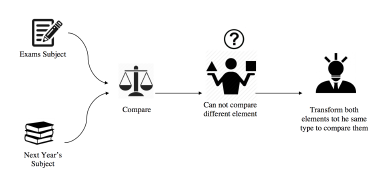 Figure 2: Problematic of guidance process
2.2. The Moroccan Education System: A general description
In the MES, there is:
- Elementary education, or primary school: 6 years
- Middle school (MS): 3 years. All the students study the same subjects untill the 9th grade.
- High school:3 years. At this point, the student will have to choose a field from the 15th offered by the MES. 5 from the are scientific. In the 2nd year, the student sits for a primary exam. In the 3rd and final year, he will have to sit for the final exam as shown in figure 3.
In the MES, the grades are scaled from 0 as a minimum, to 20 as a maximum.
2.3. Process of Career Guidance
From figure 4, it can be shown that the MES consists of 4th principals stages.
In the 1st and 2nd one, guidance is not required: there are only common studies.
In the 3rd stage (high school), the student will have to select one from the 15th fields offered by the MES: Career recommendation is mandatory at this stage. To do so, the solution proposed in [1] will be used, based on RAISEC . This model is based on comparing the students’ grades of their actual year, with those of the next year, calculated according to subjects’ coefficient of each field.
In the 4th stage, using the same solution for higher education is not possible, due to the great difference between the subjects of the university and those of the high school.
As a solution, the skills model can be used: the subjects will be converted into a standard type, of the same range. Thus, comparing these subjects one with another can be easily done, without any confusion.
In this paper, the science process skill (SPS) model is chosen, because it suits the most the goal of this work: SPS is developed on the basis of scientific research and is in association with cognitive and investigative skills [14], and this work aims to study scientific students.
2.4. Student Profile
According to [3] [15], Profiling can be defined as the ’process of Extracting, Integrating and Identifying the keywordbased information, in order to produce a structured Profile, and visualize the knowledge outside of these results. It’s a major concept for retrieving the user pertinent information and solving difficult problems of a recommender system, such as items classification according to an individual’s interest. [3].
The process of profiling a web user, consist of the act of getting values of different properties, that forms the user’s model [16]. It can be either behavior based or knowledge based (already known/factual) [16].
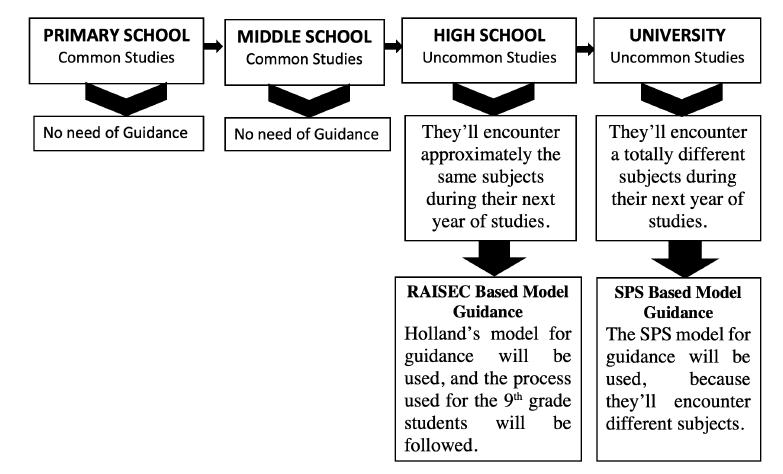 Figure 3: Description of the Process of Career Guidance
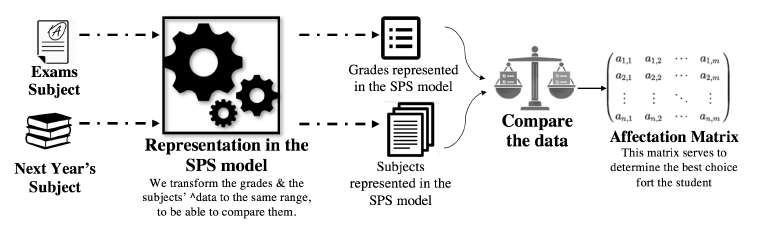 Figure 4: Guidance Process Model
Social profiling [17] techniques will be used also for user profiling: This process can be simplified by implicit usage of user’s data, while their registration via Facebook [17]. We do use this last to extract variable user’s attributes from the user’s Facebook accounts [15].
2.5. Student Ontology
Collect the student’s modeling data is time-consuming process, that demands the development of complex data structures to represent student’s personal information, knowledge and behavior in the learning domain [18].
Recently, student modeling researchers have begun to adopt technologies, applications, and standards from the Semantic Web to solve the problems mentioned above [18]. Chen & Mizoguchi were the first to introduce using ontologies for modeling learners[19]. Kay also asserts about using this technology, for reusable and scrutable student models[20].
2.6. Ontology Use
After collecting the student’s data, converting it into a format compatible with knowledge representation and reasoning systems to operate as the input for the adaptive systems should be processed. Faced with these requirements, student modeling data is stored in general in proprietary and hardto-access formats, which won’t motivate reusing it, or its distribution.[18].
Choosing RDF and RDFS as a solution for developing the student ontology would be a good approach. However, it would be better to use Web Ontology Language, in order to beneficiate from its wide functionalities, actualities, tools support, and being an official W3C recommendation [18].
This work presents a different method of student model representation. It demonstrates a way of its achievement using the semantic web technologies.
TO build an efficient student model based on web ontologies: OIL, DAML+OIL, RDF/RDFS, OWL, languages is not evident .
The ontology language chosen is OWL DL [21], for being an official W3C recommendation in addition to its functions, tool support, and more especially the Protege 3.0 development tool. In addition, (OWL) have the benefits of formal semantics, easy reuse, easy portability, and automatic serialization into a format compatible with popular logical inference engines [18].
2.7. Guidance Skill Model
The concept lies on supposing that a subject consists of a set of skills, assigned with different weights, enabling the comparison of the student’s grades of the actual year, with next year subjects, even if they belong to dissimilar ranges, without any confusion. This work is based on the SPS, for the reason that it corresponds well to the needs if this research, and suits its goal: SPS was developed on the basis of scientific research, and this research targets scientific students. With this approach, the grades can be described as a set of SPS weighted vectors, and detect the student’s reel skills.
An SPS test was developed for measuring the students’ skills, with the same approach that the author did in [22]: The Test of Science Process Skill (TSPS) consisted of multiple choice items. According to [23], SPS can be classified into two categories:
- BSPS: Basic science process skills.
- ISPS: Integrated science process skills.
This work is limited to 10 skills, considered pertinent by the developing team members. These skills are enough to describe any subject. For that matter, the subjects will be described as a set of skills, with different weight. The weight will vary from 0 as a minimum, to 10 as a maximum.
The skills selected are:
- 1st skill: Observing, as (s1),
- 2nd skill: questioning (s2),
- 3rd skill: hypothesizing (s3),
- 4th skill: predicting (s4),
- 5th skill: measuring (s5),
- 6th skill: using numbers (s6),
- 7th skill: experimenting (s7),
- 8th skill: interpreting (s8), 9. 9th skill: communicating (s9),
- 10th skill: memorizing (s10).
To compare two different subjects, you can compare only their skills weights.
3. System Architecture and Design
3.1. General Architecture
We’ll use the general architecture developed by Amine [12], for career guidance. (fig Process Architecture). It consists of four main modules:
- Assignment module: which relies on algorithm, assigning each student to an appropriate category, according to the RAISEC / SPS test results, as well as his or her academic background.
- Ontology module: Store all the student’s data. This module demonstrates the way in which the content of information is structured.
- Recommendation module: Exploit the assignment results, and usage history, to give directions to the Adaptation module
- Adaptation module: Adjust the contents, for student individual needs.
Initially, a student profile will be created by filling a form. By entering the student’s ’national code’ (NC), the system will connect to the student personal information and academic background. If an educational system is not yet structured, the student will have to directly supply this static information. After being registered, the elementary school students answer to a questioner based on Holland’s model, and the university ones answer to SPS based test. This will determine his personal and professional tendencies and his reel capabilities. After that, these answers will be exploited, with the help of his educational background, to determine his profile. RCS usage is necessary to do it. The profile will be modeled by ontologies. We can also determine his interaction preferences, content preferences and motivations (dynamic information),by means of the browsing history, and its interaction or behavior. The results will be stored in the system, so that they can be available at any time for the adaptation module as shown in figure 5.
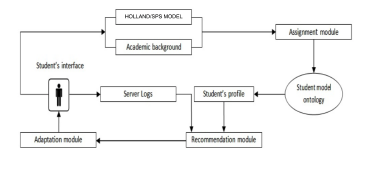 Figure 5: General Architecture
Ontology-based on the semantic web can be used to model and structure the educational domain, to be shared by a student’s group. It is an explicit specification of conceptualization or a model [24].
In this paper, ontologies will be used to identify pedagogical concepts and semantic links, for representing the existing. So, students can get educational resources, and interest dynamically, and adapt it to their interests.
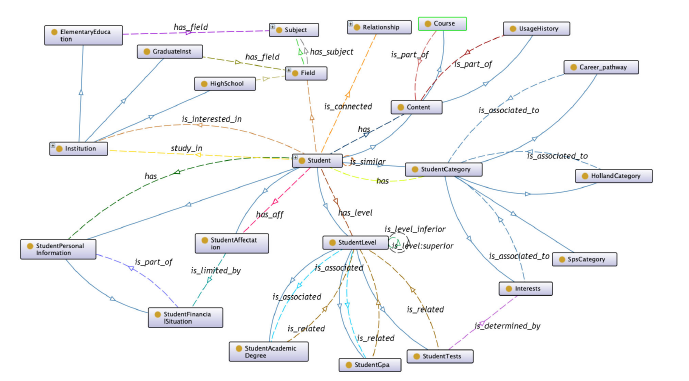 Figure 6, represents a part of the ontology diagram, composed of 4 main higher levels:
- Student’s Level: Student’s background, his actual level and results based on the proposed solution.
- Student’s Profile: Student’s classification based on RAISEC/SPS model, and his actual career pathway assignment.
- Student’s Personal Information: presents static/permanent students’ information.
- Content: Information related to the pedagogical content of the students’ interface.
The purpose of this career recommendation ontology is to take advantage of student orientation in order to personalize their web content and define similarities of profiles.
The figure 7 shows a partial part of the ontology’s object properties.
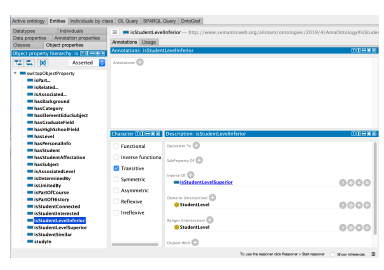 Figure 7: Part of the ontology object properties
3.2 Notations
This work, uses the same nomenclatures used in [1]:
n : Total students number.
Stdi : student’s number i. m : Total number of skills.
S k: skill number k. p : Actual year Total subjects number. Subj: subject number j.
q : Total School’s field subjects number. t : Total School’s field number. gij : The grade of the student’ i on the subject j.
3.3. Representation of a Subject on the Skill Mode
Using SPS is essential for learning with understanding [25]. For that matter, this paper propose a model for representing a subject on the Skill Mode. Comparing 2 subjects of different types, implies that they can be represented in the same format. For that reason, the author in [1] proposed the theory of Skill mode:
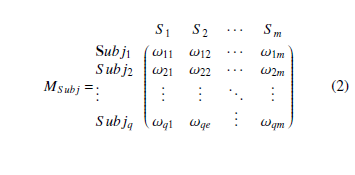
Given a subject j, j can be described as a vector Subj composed of a set of skills, with different weight ωjk:
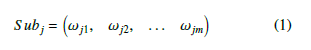 Where m is the total skills’ number
For instance, the Mathematics can be described as follow:
Math2 8 9 8 2 6 2 9 3 4
meaning that the Observing Skill S 1 has a weight of 2, the Questioning Skill S 2 has 8, …, and the Memorizing Skill S 10 has 4 as a weight. These weights can be assigned according to the institution requirements, and the tutors’ vision. Which means that they can vary from a school to another one.
After building all the subjects vectors of total number q, the matrix of the skill mode composed of these subjects is defined as follow:
 3.4. Representing a student’s grades on the Skill Mode
The first step is to transform the grades of the students, like what was done previously for the subjects, to a standard form. The skill mode representation is the solution that’ll allow as the manipulation, usage, and comparison of the grades with high flexibility.
Let GStudenti = gi1, gi2, … gip be the student
grades,
And let MSubj with weights ωjk the skill mode matrix, of the student’s grades. The weights ωjk refers to the weight of the skill k, and for the subject i.
With the same process done to the subjects, the student can be represented by a vector composed of his subjects’ grades, converted to skill mode:
 3.5. Calculus of the student’s Reel Grades
The singular use of GPA, without taking into consideration the real abilities of the learner, will lead to an erroneous orientation [23]. Using an SPS test is crucial for understanding and validating one’s real abilities, allowing a more realistic representation of one’s profile.
In this paper, in addition to the usage of the SPS test, the profiling vector will be added to the vector the results in order to have more accuracy in the results.
Let Ci = ci1, ci2, … cim be the vector representing the coefficients of the students’ skills, resulted from his SPS test.
The vector Pi = pi1, pi2, … pim is representing the coefficients of the students’ skills, calculated based on his profiling data.
The student’s reel grades are defined as follow:
![]() The vector Ri represents the reel student profile and capacities, that will be used later on for calculating his affectation.
The vector Ri represents the reel student profile and capacities, that will be used later on for calculating his affectation.
Given Ff a field of a certain school, this field consists of a set of subjects S j. The vector S Ff S 1,S 2 …,S n represents the representation on the skill mode of Ff , that referes to the field f
We can define the School Fields Matrix as:
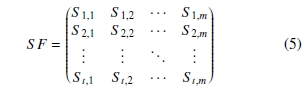 Where t is the fields’ total number.
From: Ri, the reel grade vector of the student i, and, S F, the representation of the fields on the skill mode, The affectation vector can be inferred, and calculated as follow:
From 6, it can inferred that the affectation is proportionally relative to aif : The greater is aif , the better it would be the student’s grade on the field Ff , leading to a more preferable affectation. Finally, the student α best choice would be the field χ, calculated as follow:
![]() Fχ would be the student best-fitted choice.
Fχ would be the student best-fitted choice.
4. Experiments and Results
In this chapter, experimentation of the model presented will be realized. To do this, a sample of 50 baccalaureate students who passed the final high school exam chose to study them. It will be calculated their assignments, and an analysis of the results will be established thereafter. The scientific fields that have been chosen for this experiment are:
- Mathematics Sciences (SMA).
- Life and Earth Sciences (SVT).
- Physics and Chemistry (PC).
- Mechanical Technics Science (STM).
- Electrical Technics Science (STE).
10 students from each field were chosen to form the test sample.
Two among the main institutions of the city of Tangier, were chosen, namely:
- The faculty of Science of Tangier (FST).
- Office of Vocational Training and Promotion of Labor
(OFPPT)
The fields available at the fst are:
- Mathematics, Computer science, Physics and chemistry (MIPC).
- Biology, Chemistry and Geology (BCG).
- Electric and Mechanics (GE Gm).
For the Ofppt, it has 4 fields or specializations. The duration of studies is 2 years, with a total of 4 semesters. The fields taught at the Ofppt are:
- Computer developing Technics (TDI).
- Computer Networks Technic (TRI).
- Multimedia Development Technics (TDM).
- Infographics (Inf).
At first, student grades will be extracted from their final exams.
These notes will then be studied for a career recommendation purpose.
The tables 1 to 5 show students’ grades in their last year of high school.
Table 1: Mathematics Science student grades
| Mathematics sciences | ||||||||||||||
| Subj | Ar | Fr | HG | Math | PC | SVT | Philo | Eng | ||||||
| Student/Coef | 2 | 4 | 2 | 9 | 7 | 3 | 2 | 2 | ||||||
| Student 10 | 8 | 19 | 14 | 17 | 18 | 15 | 6 | 9 | ||||||
| Student 11 | 15 | 18 | 17 | 15 | 16 | 9 | 15 | 19 | ||||||
| Student 12 | 16 | 14 | 15 | 18 | 19 | 17 | 14 | 15 | ||||||
| Student 13 | 15 | 12 | 16 | 20 | 19 | 13 | 10 | 10 | ||||||
| Student 14 | 11 | 16 | 10 | 17 | 14 | 10 | 8 | 13 | ||||||
| Student 15 | 14 | 8 | 12 | 11 | 17 | 9 | 15 | 9 | ||||||
| Student 16 | 7 | 12 | 14 | 9 | 15 | 17 | 9 | 15 | ||||||
| Student 17 | 13 | 16 | 13 | 12 | 13 | 19 | 12 | 14 | ||||||
| Student 18 | 12 | 14 | 14 | 10 | 16 | 13 | 14 | 12 | ||||||
| Student 19 | 10 | 12 | 12 | 16 | 8 | 15 | 10 | 10 | ||||||
| Ta | ble 2: S | VT St | udents G | rades | ||||||||||
| SVT | ||||||||||||||
| Subj | Ar | Fr | HG | Math | PC | SVT | Philo | Eng | ||||||
| Student/Coef | 2 | 4 | 2 | 7 | 5 | 7 | 2 | 2 | ||||||
| Student 20 | 13 | 14 | 19 | 20 | 14 | 17 | 14 | 12 | ||||||
| Student 21 | 15 | 8 | 18 | 20 | 19 | 17 | 12 | 10 | ||||||
| Student 22 | 16 | 6 | 11 | 14 | 18 | 10 | 13 | 14 | ||||||
| Student 23 | 18 | 14 | 12 | 19 | 13 | 10 | 7 | 10 | ||||||
| Student 24 | 19 | 14 | 13 | 13 | 13 | 12 | 9 | 10 | ||||||
| Student 25 | 13 | 12 | 12 | 14 | 17 | 15 | 9 | 12 | ||||||
| Student 26 | 12 | 8 | 9 | 11 | 17 | 14 | 13 | 13 | ||||||
| Student 27 | 18 | 8 | 12 | 14 | 15 | 14 | 6 | 14 | ||||||
| Student 28 | 15 | 8 | 6 | 12 | 15 | 15 | 12 | 15 | ||||||
| Student 29 | 11 | 5 | 14 | 16 | 18 | 8 | 12 | 8 | ||||||
| Table 3: | PC Stu | dents Gr | ades | |||||||||||
| Physics Chemistry | ||||||||||||||
| Subj | Ar | Fr | Math | PC | SVT | Philo | Eng | |||||||
| Student/Coef | 2 | 4 | 7 | 7 | 5 | 2 | 2 | |||||||
| Student 30 | 20 | 13 | 17 | 17 | 15 | 12 | 14 | |||||||
| Student 31 | 18 | 15 | 13 | 14 | 17 | 12 | 17 | |||||||
| Student 32 | 13 | 10 | 18 | 13 | 12 | 11 | 6 | |||||||
| Student 33 | 11 | 14 | 16 | 11 | 15 | 11 | 16 | |||||||
| Student 34 | 12 | 11 | 14 | 14 | 17 | 5 | 9 | |||||||
| Student 35 | 16 | 12 | 15 | 16 | 9 | 6 | 12 | |||||||
| Student 36 | 18 | 13 | 10 | 13 | 11 | 6 | 13 | |||||||
| Student 37 | 16 | 14 | 17 | 13 | 9 | 10 | 11 | |||||||
| Student 38 | 14 | 13 | 13 | 14 | 12 | 10 | 9 | |||||||
| Student 39 | 18 | 6 | 15 | 17 | 12 | 10 | 10 | |||||||
| Table 4: MTS Students Grades | ||||||||||||||
| Sc tech Mecanic | ||||||||||||||
| Subj | Ar | Fr | Math | PC | SI | Philo | Eng | |||||||
| Student/Coef | 2 | 4 | 6 | 6 | 8 | 2 | 2 | |||||||
| Student 40 | 13 | 13 | 11 | 20 | 12 | 6 | 9 | |||||||
| Student 41 | 14 | 12 | 14 | 16 | 12 | 13 | 13 | |||||||
| Student 42 | 15 | 13 | 13 | 13 | 15 | 14 | 11 | |||||||
| Student 43 | 10 | 12 | 14 | 15 | 12 | 12 | 14 | |||||||
| Student 44 | 14 | 12 | 12 | 15 | 13 | 12 | 14 | |||||||
| Student 45 | 9 | 13 | 13 | 16 | 11 | 10 | 11 | |||||||
| Student 46 | 19 | 13 | 9 | 13 | 11 | 14 | 10 | |||||||
| Student 47 | 12 | 13 | 5 | 13 | 12 | 10 | 4 | |||||||
| Student 48 | 17 | 13 | 10 | 14 | 9 | 6 | 9 | |||||||
| Student 49 | 11 | 11 | 11 | 13 | 12 | 19 | 7 | |||||||
Table 5: ETS Students Grades
| Sc tech Mecanic | |||||||
| Subj | Ar | Fr | Math | PC | SI | Philo | Eng |
| Student/Coef | 2 | 4 | 6 | 6 | 8 | 2 | 2 |
| Student 50 | 14 | 14 | 14 | 15 | 11 | 10 | 16 |
| Student 51 | 19 | 12 | 12 | 16 | 15 | 8 | 11 |
| Student 52 | 15 | 15 | 16 | 16 | 11 | 13 | 11 |
| Student 53 | 11 | 3 | 12 | 18 | 15 | 12 | 13 |
| Student 54 | 10 | 7 | 11 | 17 | 14 | 12 | 11 |
| Student 55 | 10 | 16 | 13 | 11 | 13 | 13 | 15 |
| Student 56 | 9 | 7 | 13 | 16 | 14 | 16 | 9 |
| Student 57 | 10 | 10 | 10 | 13 | 17 | 14 | 9 |
| Student 58 | 14 | 10 | 11 | 14 | 13 | 12 | 12 |
| Student 59 | 11 | 14 | 12 | 15 | 12 | 10 | 12 |
Each line of these tables represents the vectors of the students’ grades G10, G11, …and G59 respectively of Student10, Student11,…Student59.
4.1. Matrix Subjects of final year High School
Let MBAC be the Matrix of the final year of high school exam Subjects. After assigning the skills weights of each subject by the members of the research team, MBAC can be the skill mode
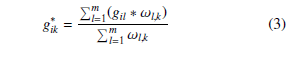
The first step is to calculate G10, G11, …G59, that represents the student’s grade on the skill mode, using (3), and calculate G∗10, G∗11, …G∗59,
For G∗10, (3) will be used in order to calculate G∗10(2),
In the same way, the other grades vectors represented in the skill mode of the students will be calculated. For calculation details and results, please refer to the appendix.
4.3. Calculus of the students’ Reel Grades
The real grades of the students will be calculated from:
- Grades vectors represented in the skill mode G∗10, G∗11, …G∗
- The skill coefficients of the students C10, C11,…and C
The Grades vectors represented in the skill mode were calculated in the previous chapter. For students’ skill coefficients, they are described in detail in the appendix ’Calculus of the student Reel Grades’. (4) can be used then in order to calculate the reel grades. For example, to calculate RG10, the student 10 real grade:
The same calculus will be to all the other students. For the full results and calculus, please refer to the appendix, subsection ’Calculus of the student Reel Grades’.
4.4. Calculus of the School fields Matrix
The following abbreviations will be used for the Faculty of science of Tangier:
- FMP : Mathematics, Physics, Chemistry & Computer science
- FGEM,Electrical and mechanical.
- and FBCG Biology Geology & Chemistry field.
For the offpt, the following abbreviations will be used :
- FTDI Computer software technics.
- FTRI Network Technics.
- FTDM multimedia developing technics.
- FInf
The matrix FieldRG will be deduct from the calculation of all the skill vectors, for all the modules and fields:
|
FMP FGEM FBCG FTDI FTRI FTDM FInf |
S1 5 68991 7 |
S2 6 6 8 7 7 6 1 |
S3 9 9 7 7 9 5 1 |
S4 8 6 6 9 1 3 5 |
S5 3 7 3 3 4 8 5 |
S6 7 7 4 7 5 5 2 |
S7 6 7 7 4 4 7 6 |
S8 6 6 8 9 4 5 1 |
S9 3 5 2 5 5 3 4 |
S10 4 5 6 4 6 4 3 |
4.5. Calculus of the Affectation Vector
Using (7), the affectation of Student10 can be calculated as follow:
which means that Ff st = 1, corresponding to F1. The Student10 should be affected to the MP.
In the same way, the assignment of the other students will be calculated.
The following tables, show the results of the affectation, for each student.
The results are grouped by students’ high school fields. The grades can be easily compared, with the affectation of each field, for each institutions.
The tables 6 to 10 show the results of the differents fields.
Table 6: Mathematics Science Affectation
| Std11 | 14.4 | 52.0 | 50.5 | 50.2 | 45.5 | 55.1 | 51.7 | 51.6 |
| Std12 | 14.5 | 43.2 | 46.2 | 45.8 | 30.7 | 47.7 | 48.9 | 42.6 |
| Std13 | 15.8 | 57.7 | 56.5 | 55.2 | 47.3 | 60.0 | 56.3 | 57.6 |
| Std14 | 15.2 | 47.8 | 53.8 | 49.6 | 47.2 | 55.3 | 50.5 | 52.0 |
| Std15 | 13.0 | 41.2 | 41.0 | 38.7 | 36.5 | 46.1 | 41.1 | 39.0 |
| Std16 | 11.4 | 41.3 | 41.2 | 41.2 | 36.5 | 43.0 | 42.3 | 41.9 |
| Std17 | 11.4 | 33.4 | 36.2 | 36.4 | 23.1 | 33.9 | 37.8 | 35.0 |
| Std18 | 12.8 | 37.1 | 41.1 | 40.8 | 35.0 | 41.1 | 43.1 | 37.9 |
| Std19 | 12.2 | 41.6 | 40.4 | 40.7 | 33.7 | 44.7 | 42.5 | 40.1 |
| Std20 | 11.4 | 38.2 | 36.9 | 37.0 | 32.9 | 41.7 | 39.5 | 35.8 |
Table 7: SVT Affectation
| Std21 | 16.2 | 49.6 | 50.4 | 48.5 | 43.8 | 52.9 | 50.6 | 47.8 |
| Std22 | 16.0 | 52.5 | 50.6 | 51.0 | 45.3 | 55.2 | 54.8 | 51.5 |
| Std23 | 12.6 | 36.1 | 37.8 | 36.3 | 28.3 | 42.8 | 39.6 | 35.4 |
| Std24 | 13.6 | 41.9 | 41.1 | 40.3 | 33.3 | 44.3 | 42.0 | 42.7 |
| Std25 | 12.8 | 41.7 | 37.9 | 39.6 | 28.1 | 42.8 | 42.5 | 38.3 |
| Std26 | 14.0 | 45.5 | 46.8 | 47.4 | 45.7 | 49.2 | 50.6 | 45.9 |
| Std27 | 12.5 | 35.9 | 38.6 | 39.0 | 29.9 | 36.1 | 39.9 | 37.8 |
| Std28 | 13.1 | 41.2 | 40.4 | 40.0 | 39.9 | 43.8 | 43.3 | 38.9 |
| Std29 | 12.5 | 38.2 | 38.5 | 38.6 | 39.5 | 43.1 | 41.0 | 38.3 |
| Std30 | 11.9 | 41.0 | 41.1 | 41.1 | 32.9 | 45.6 | 45.1 | 38.6 |
Table 8: PC Students Grades
|
Std31 Std32 Std33 Std34 Std35 Std36 Std37 Std38 Std39 Std40 |
15.3 14.7 13.0 13.3 13.2 13.2 12.0 13.0 12.6 13.0 |
36.8 44.3 38.5 34.0 36.0 34.5 30.8 40.1 35.0 37.5 |
44.2 43.7 39.9 36.3 37.7 35.3 33.5 39.5 34.9 39.9 |
41.7 43.9 40.5 35.2 38.3 35.1 32.8 39.3 36.7 42.8 |
39.9 44.0 37.6 31.3 31.9 31.6 33.6 37.4 30.9 32.9 |
40.2 46.7 41.4 36.8 38.1 37.3 34.1 43.3 36.9 39.6 |
40.6 44.9 42.9 36.5 39.8 36.9 33.8 42.3 39.0 46.0 |
44.0 45.2 39.1 33.9 36.5 33.0 33.4 37.1 34.0 38.6 |
Table 9: MTS Students Grades
| Std41 | 13.2 | 36.2 | 36.2 | 36.7 | 26.3 | 37.1 | 38.7 | 34.9 |
| Std42 | 13.3 | 32.9 | 33.3 | 32.0 | 41.9 | 34.7 | 33.1 | 32.3 |
| Std43 | 13.5 | 33.7 | 32.1 | 32.9 | 24.6 | 33.1 | 33.5 | 33.4 |
| Std44 | 13.1 | 30.3 | 30.7 | 28.0 | 33.4 | 32.5 | 27.9 | 29.0 |
| Std45 | 12.8 | 29.4 | 29.7 | 30.1 | 38.0 | 30.4 | 30.0 | 31.2 |
| Std46 | 12.3 | 29.0 | 27.7 | 26.8 | 29.4 | 25.9 | 25.0 | 29.2 |
| Std47 | 11.9 | 29.2 | 25.5 | 27.2 | 34.7 | 29.6 | 29.4 | 24.0 |
| Std48 | 10.9 | 23.0 | 21.5 | 23.6 | 23.9 | 22.0 | 23.2 | 22.7 |
| Std49 | 11.5 | 27.7 | 27.0 | 25.9 | 28.8 | 27.2 | 25.7 | 27.2 |
| Std50 | 12.0 | 26.0 | 27.0 | 28.3 | 19.7 | 26.7 | 29.3 | 27.3 |
Table 10: ETS Students Grades
| Std51 | 13.6 | 30.5 | 27.9 | 28.0 | 33.3 | 29.9 | 28.1 | 29.7 |
| Std52 | 13.8 | 36.7 | 34.6 | 34.1 | 33.7 | 37.1 | 35.1 | 33.9 |
| Std53 | 13.6 | 34.7 | 33.5 | 31.9 | 48.1 | 36.5 | 32.2 | 33.2 |
| Std54 | 13.2 | 32.8 | 36.2 | 35.5 | 35.6 | 33.4 | 35.4 | 36.9 |
| Std55 | 12.9 | 36.6 | 36.6 | 35.1 | 34.1 | 38.4 | 35.3 | 38.1 |
| Std56 | 13.0 | 33.2 | 35.0 | 35.3 | 31.7 | 35.7 | 36.0 | 34.9 |
| Std57 | 12.8 | 31.7 | 33.8 | 36.1 | 32.7 | 32.5 | 37.9 | 33.4 |
| Std58 | 12.9 | 28.9 | 30.2 | 30.2 | 31.6 | 30.6 | 31.3 | 30.0 |
| Std59 | 12.3 | 28.8 | 27.0 | 27.3 | 20.8 | 26.9 | 27.3 | 29.1 |
| Std60 | 12.8 | 31.9 | 32.1 | 33.3 | 29.2 | 31.8 | 33.8 | 33.2 |
From the tables 6 to 10, the table 11 can be established, where the affectation summary of the students is illustrated. The table shows their affectation for both institution, the FST and OFPPT. In each institution, the affectation for each student will be calculated. Then, compare their real choice, with their best suitable field, that is expressed in the relevance column: A ’True’ mention for an accurate choice, and ’False’ in the other case.
5. Analysis
In this section, an analyze the results will be done.
According to these calculations, the percentage of relevant choices made by the student can be inferred. In global, more than 50% of the students made a wrong choice, which means that 1 out of 2 students will follow a wrong pathway, leading him to failure. We can notice also, that all the students with a high GPA, chose the FST rather than the Ofppt. In this institution, many students tend to select the MIP field, just because it’s the tendency, while they would perform better in other fields. It is the case for the student 12, 31 and others. We can conclude that students chose a given field, only if their GPA allows it. Figure 8 compares the affectation with the real choices for the FST.
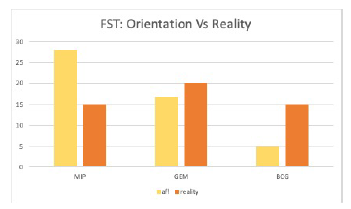 Figure 8: FST: Orientation Vs Reality
Table 11: Students affectation summary Reel
| Std11 | 52.0 | FTDI | 55.1 | FMIP | FMIP | T |
| Std12 | 46.2 | FTRI | 48.9 | FGEM | FMIP | F |
| Std13 | 57.7 | FTDI | 60.0 | FMIP | FMIP | T |
| Std14 | 53.8 | FTRI | 55.3 | FMIP | FMIP | T |
| Std15 | 41.2 | FTDI | 46.1 | FMIP | FGEM | F |
| Std16 | 41.3 | FTDI | 43.0 | FMIP | FInf | F |
| Std17 | 36.4 | FTDM | 37.8 | FGEM | FTDM | F |
| Std18 | 41.1 | FTRI | 43.1 | FGEM | FTDI | F |
| Std19 | 41.6 | FTDI | 44.7 | FMIP | FTDM | F |
| Std20 | 38.2 | FTDI | 41.7 | FMIP | FInf | F |
| Std21 | 50.4 | FTRI | 52.9 | FMIP | FMIP | T |
| Std22 | 52.5 | FTDI | 55.2 | FMIP | FMIP | T |
| Std23 | 37.8 | FTRI | 42.8 | FMIP | FTRI | F |
| Std24 | 41.9 | FTDI | 44.3 | FMIP | FBCG | F |
| Std25 | 41.7 | FTDI | 42.8 | FMIP | FTDI | F |
| Std26 | 47.4 | FTDM | 50.6 | FGEM | FBCG | F |
| Std27 | 39.0 | FTDM | 39.9 | FGEM | FTDM | F |
| Std28 | 41.2 | FTDI | 43.8 | FMIP | FBCG | F |
| Std29 | 39.5 | FInf | 43.1 | FMIP | FTRI | F |
| Std30 | 41.1 | FTDM | 45.6 | FMIP | FTDM | F |
| Std31 | 44.2 | FTRI | 44.0 | FBCG | FMIP | F |
| Std32 | 44.3 | FTDI | 46.7 | FMIP | FMIP | T |
| Std33 | 40.5 | FTDM | 42.9 | FGEM | FGEM | T |
| Std34 | 36.3 | FTRI | 36.8 | FMIP | FBCG | F |
| Std35 | 38.3 | FTDM | 39.8 | FGEM | FGEM | T |
| Std36 | 35.3 | FTRI | 37.3 | FMIP | FGEM | F |
| Std37 | 33.6 | FInf | 34.1 | FMIP | FInf | F |
| Std38 | 40.1 | FTDI | 43.3 | FMIP | FGEM | F |
| Std39 | 36.7 | FTDM | 39.0 | FGEM | FTDM | F |
| Std40 | 42.8 | FTDM | 46.0 | FGEM | FGEM | T |
| Std41 | 36.7 | FTDM | 38.7 | FGEM | FGEM | T |
| Std42 | 41.9 | FInf | 34.7 | FMIP | FBCG | F |
| Std43 | 33.7 | FTDI | 33.5 | FGEM | FGEM | T |
| Std44 | 33.4 | FInf | 32.5 | FMIP | FGEM | F |
| Std45 | 38.0 | FInf | 31.2 | FBCG | FTDI | F |
| Std46 | 29.4 | FInf | 29.2 | FBCG | FInf | F |
| Std47 | 34.7 | FInf | 29.6 | FMIP | FInf | F |
| Std48 | 23.9 | FInf | 23.2 | FGEM | FInf | F |
| Std49 | 28.8 | FInf | 27.2 | FMIP | FInf | F |
| Std50 | 28.3 | FTDM | 29.3 | FGEM | FTDM | F |
| Std51 | 33.3 | FInf | 29.9 | FMIP | FGEM | F |
| Std52 | 36.7 | FTDI | 37.1 | FMIP | FGEM | F |
| Std53 | 48.1 | FInf | 36.5 | FMIP | FGEM | F |
| Std54 | 36.2 | FTRI | 36.9 | FBCG | FGEM | F |
| Std55 | 36.6 | FTRI | 38.4 | FMIP | FTRI | F |
| Std56 | 35.3 | FTDM | 36.0 | FGEM | FGEM | T |
| Std57 | 36.1 | FTDM | 37.9 | FGEM | FTRI | F |
| Std58 | 31.6 | FInf | 31.3 | FGEM | FTDI | F |
| Std59 | 28.8 | FTDI | 29.1 | FBCG | FTRI | F |
| Std60 | 33.3 | FTDM | 33.8 | FGEM | FTDI | F |
We expected that more than 25 students will choose the MIP, 5 the BCG, and 17 the GEM.
But in the reality, 15 preferred to attend the MIP, 15 the BCG, and 20 the GEM.
It’s due to the quota imposed by the institution. The students can not make a choice above the threshold. They’re aware of their acceptance probabilities, and not applying for a field where they have better chances in order not to miss their opportunities.
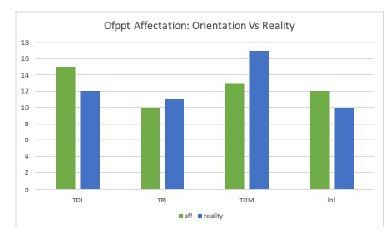 Figure 9 compares the affectation with the reel choices for the Ofppt.
We expected that 12 will choose the TDI, 10 the TRI , 13 the TDM , and 12 the Inf. But in the reality, preferred the 12 TDI, 11 the TRI , 17 the TDM , and 10 the Inf. The Figure 10: Student’ Choice Relevance
From 12, the graph 10 can be generated, that describes the relevance for each institution, and the, a general affectation accuracy statistics.
6. Conclusion
In this work, an orientation model for science students towards their most suitable career was presented, tested and analyzed. The results of this research show that the current system of orientation penalizes students, who are forced to choose courses that are not dedicated to them, and make erroneous choices. The proposed solution would provide better guidance, to promote a better future for students, and at home.
The developed model has been submitted to the School, working in collaboration with the research team, for the purpose of using the first version of the solution. This model can be easily adapted to any education system, and be customized according to each organization needs.
We intend in the future works to integrate methodologies from Artificial Intelligence (AI) based on mathematical theories to add more significance and improvements to the actual model.
Annexure The SPS coefficients for SM:
|
A.1 Representation of the student Grades on the skill mode The representation of the vectors for SM: |
C10( 0,70 C11( 0,90 C12( 0,70 C13( 0,90 |
0,90 0,90 0,90 0,90 |
0,80 0,80 1,00 0,90 |
0,50 0,20 0,60 0,10 |
0,60 0,70 0,60 0,50 |
0,60 0,80 0,50 0,50 |
0,60 0,30 0,60 0,20 |
0,90 0,50 0,70 0,80 |
0,70 0,40 0,70 0,60 |
0,50 ) 0,20 ) 0,30 ) 0,70 ) |
G 2 76,5 43,1 49,3 ) C14( 0,70 0,80 0,80 0,30 0,40 0,70 0,30 0,70 0,60 0,50 )
3 71,3 49,5 52,3 ) C15( 0,80 0,90 0,70 0,60 0,50 0,60 0,40 0,80 0,70 0,60 )
G 5 84,5 48,3 54,6 ) C16( 0,90 0,90 0,80 0,50 0,60 0,40 0,30 0,50 0,50 0,20 )
0 84,8 43,8 50,6 ) C17( 0,90 0,80 0,70 0,30 0,70 0,70 0,30 0,60 0,60 0,50 )
G 5 68,3 41,1 44,3 ) C18( 0,50 0,80 0,80 0,50 0,60 0,80 0,80 0,70 0,70 0,40 )
C19( 0,60 0,70 0,70 0,40 0,80 0,70 0,40 0,80 0,70 0,50 ) 0 61,1 34,3 40,0 )
G 6 57,3 35,7 41,6 ) The SPS coefficients for SVT:
1 63,8 42,8 46,8 ) C20( 0,80 0,90 0,70 0,50 0,50 0,80 0,30 0,60 0,60 0,30 )
G 3 60,7 39,5 44,4 ) C21( 0,80 0,50 0,90 0,70 0,60 0,50 0,30 0,80 0,70 0,30 )
0 61,9 36,1 38,7 ) C22( 0,70 0,80 0,80 0,20 0,50 0,90 0,20 0,60 0,40 0,30 )
| The representation of the vectors forFor SVT: |
C23( 0,90 C24( 0,50 |
0,90 0,80 |
0,80 0,80 |
0,50 0,60 |
0,40 0,70 |
0,60 0,70 |
0,50 0,60 |
0,80 0,90 |
0,20 0,60 |
0,40 ) 0,10 ) |
G 6 80,7 47,1 54,5 ) C25( 0,90 0,80 0,70 0,40 0,70 0,80 0,30 0,60 0,40 0,60 )
G 0 83,6 42,5 52,5 ) C26( 0,90 0,80 0,70 0,60 0,40 0,60 0,50 0,40 0,70 0,40 )
G 5 63,2 36,0 42,5 ) C27( 0,80 0,60 0,80 0,70 0,60 0,70 0,30 0,70 0,60 0,40 )
G 4 65,6 41,3 45,4 ) C28( 0,60 0,60 0,60 0,20 0,50 0,80 0,50 0,80 0,70 0,60 ) G 1 59,2 40,2 44,9 ) C29( 0,80 0,70 0,90 0,30 0,80 0,80 0,30 0,70 0,70 0,40 )
G 1 68,5 39,9 47,9 )
The SPS coefficients for PC:
G 2 61,7 35,3 43,0 ) C30( 0,90 0,80 0,80 0,20 0,30 0,40 0,50 0,50 0,40 0,70 )
G 9 64,0 37,9 45,0 ) C31( 0,60 0,80 0,80 0,30 0,50 0,50 0,60 0,80 0,60 0,70 )
G 6 60,8 36,2 43,0 ) C32( 0,90 0,80 0,70 0,60 0,60 0,80 0,40 0,30 0,20 0,70 ) G 3 63,9 31,2 38,5 ) C33( 0,80 0,70 0,50 0,30 0,50 0,50 0,10 0,60 0,80 0,30 )
| The representation of the vectors for PC: | C34( 0,80 | 0,70 | 0,50 | 0,30 | 0,50 | 0,70 | 0,30 | 0,60 | 0,80 | 0,30 ) |
| C ( 0,60 | 0,70 | 0,70 | 0,40 | 0,40 | 0,70 | 0,50 | 0,50 | 0,80 | 0,40 ) | |
35
G 4 70,6 42,1 48,4 )
C36( 0,80 0,60 0,80 0,40 0,20 0,60 0,60 0,60 0,60 0,70 )
G 2 64,1 43,2 48,2 )
C37( 0,80 0,70 0,70 0,40 0,70 0,80 0,30 0,60 0,70 0,60 )
G 9 63,0 32,2 37,7 )
C38( 0,70 0,60 0,50 0,40 0,70 0,60 0,30 0,90 0,80 0,20 )
G 2 60,3 38,0 41,9 )
C39( 0,90 0,70 0,60 0,50 0,90 0,60 0,40 0,50 0,50 0,50 )
G 3 62,4 33,3 40,8 )
G 2 58,8 35,3 40,0 ) The SPS coefficients for STM:
C40( 0,90 0,70 0,40 0,60 0,50 0,70 0,40 0,60 0,60 0,20 )
G 3 49,4 34,9 38,6 )
C41( 0,70 0,50 0,50 0,60 0,20 0,70 0,10 0,30 0,60 0,60 )
G 2 59,9 36,9 40,3 )
C42( 0,50 0,60 0,70 0,60 0,50 0,40 0,60 0,60 0,50 0,10 )
G 9 57,1 34,3 39,3 )
| The representation of the vectors for STM: |
C44( 0,50 C45( 0,40 |
0,50 0,90 |
0,50 0,50 |
0,40 0,70 |
0,60 0,40 |
0,40 0,20 |
0,30 0,30 |
0,50 0,50 |
0,30 0,50 |
0,70 ) 0,50 ) |
C43( 0,50 0,70 0,60 0,40 0,20 0,80 0,40 0,30 0,50 0,30 )
G 1 63,9 32,8 40,0 )
G 4 63,8 45,9 52,1 ) C46( 0,30 0,50 0,30 0,50 0,70 0,80 0,40 0,30 0,50 0,60 )
G 6 64,4 48,2 54,9 ) C47( 0,30 0,70 0,20 0,40 0,40 0,30 0,60 0,50 0,40 0,50 )
G 2 63,8 48,1 56,6 ) C48( 0,60 0,60 0,50 0,60 0,40 0,30 0,20 0,70 0,70 0,50 ) G 1 64,0 46,9 54,4 ) C49( 0,70 0,70 0,40 0,30 0,40 0,50 0,60 0,40 0,30 0,20 )
G 0 62,8 46,3 53,1 ) The SPS coefficients for STE:
G 1 59,5 44,1 50,2 ) C50( 0,50 0,60 0,30 0,60 0,30 0,50 0,20 0,70 0,40 0,50 )
G 0 54,9 44,9 49,5 ) C51( 0,40 0,50 0,70 0,40 0,60 0,30 0,40 0,70 0,80 0,30 )
G 4 49,4 35,9 41,2 ) C52( 0,10 0,50 0,60 0,60 0,50 0,70 0,50 0,40 0,40 0,80 )
G 8 50,5 42,8 46,5 ) C53( 0,80 0,70 0,80 0,60 0,50 0,40 0,50 0,20 0,20 0,60 ) G 9 58,8 41,4 48,7 ) C54( 0,70 0,70 0,70 0,50 0,40 0,50 0,40 0,50 0,40 0,40 )
| The representation of the vectors for STE: | C55( 0,60 | 0,50 | 0,50 | 0,30 | 0,40 | 0,60 | 0,80 | 0,60 | 0,60 | 0,40 ) |
| C56( 0,80 | 0,70 | 0,50 | 0,60 | 0,60 | 0,70 | 0,40 | 0,20 | 0,10 | 0,40 ) |
G 9 62,5 51,2 57,0 )
C57( 0,70 0,30 0,10 0,40 0,30 0,50 0,30 0,60 0,60 0,50 )
G 2 64,9 48,4 56,1 ) C58( 0,70 0,60 0,30 0,70 0,20 0,30 0,40 0,50 0,50 0,20 )
G 0 65,0 52,7 59,0 ) C59( 0,70 0,50 0,60 0,40 0,70 0,40 0,70 0,60 0,60 0,40 )
G 3 69,3 38,4 49,4 )
The real grades for SM:
G 6 65,2 39,9 48,9 )
RG10( 43,4 66,9 62,5 37,6 48,2 58,7 44,5 68,9 30,2 29,6 )
G 8 60,4 49,3 56,1 )
RG11( 53,6 63,5 58,0 27,7 49,7 71,3 33,6 35,6 24,7 10,5 )
G 5 66,5 40,1 50,3 )
RG12( 48,2 74,6 86,5 49,9 52,1 52,4 48,9 67,6 33,8 27,3 )
G 2 64,8 41,4 52,1 )
RG13( 57,8 75,0 77,8 8,3 50,3 54,1 15,6 67,8 26,3 35,4 )
G 5 59,4 42,4 49,7 )
|
A.2 Calculus of the student Reel Grades The vectors C10, C11,…and C59 represents respectively the coefficients of the students Skills, calculated on the basis of their SPS test: |
G15 RG16( 47,8 RG17( 50,9 RG18( 27,7 RG19( 30,7 |
48,8 50,1 46,6 44,4 |
52,8 45,7 55,9 44,0 |
33,6 19,5 29,2 25,5 |
46,9 54,5 40,7 43,3 |
27,0 53,0 57,7 53,9 |
25,0 19,2 51,4 25,5 |
28,7 38,3 42,4 49,5 |
17,8 25,7 27,7 25,3 |
8,3 ) 23,4 ) 17,8 ) 19,4 ) |
The real grades for SVT:
- Alimam Mohammed Abdellah, SEGHIOUER Hamid, Alimam Mohammed Amine, Cherkaoui. Automated System For Matching PCGE Students To Their Appropriate Engineering School Pathway . In :Computing Conference 2017, 18-20 July 2017 London, UK.
- Robert Lucas, Econometrica,61, Making a Miracle 1993
- Sumitkumar Kanojea, Debajyoti Mukhopadhyaya, Sheetal Girase, User Profiling for University Recommender System using Automatic Information Retrieval, Procedia Computer Science 78 (2016) 5 ’ 12
- Antonia Martinez-Pellicera , Antonio Llamas-Botiab, Ma Belen
Garcia-Palma. Career guidance in universities as a tool for the improvement of employability. The case of the University of Murcia. Procedia – Social and Behavioral Sciences 139 (2014) 56 64. - Martinez R., Danalache P., Socio-professional insertion: the analysis of transition towards active life and adult life in the context of the European Union. Sociologie Romaneasca, Vol. VI, no. 2/2008, pp. 61-75
- Fawcett, Tom, and Foster J. Provost. ”Combining Data Mining and Machine Learning for E_ective User Profiling.” In KDD, pp. 8-13, Portland, Oregon, USA 1996.
- McGarry, Ken, Andrew Martin, and Dale Addison. ”Data Mining and User Profiling for an E-Commerce System.” In Classification and Clustering for Knowledge Discovery, pp. 175-189. Springer Berlin Heidelberg, 2005.
- B. A. Khivsara, Kale Ruchira, Naval Mayuri, Shinde Rashmi, Sonwane Ratna, IJETT, 1, Career Guidance System,4, 2017
- A. G. Watts, Career guidance and orientation, Chapter 7, p 241
- Chatchai Kruea-Ina, Nantarat Kruea-In, Witat Fakcharoenphol. A
Study of Thai In-Service and Pre-Service Science Teachers Understanding of Science Process Skills. Procedia – Social and Behavioral Sciences 197 (2015) 993 997 - Martina Hodosyova, Jana Utlaa, MonikaVanyova, Petra Vnukova, Viera Lapitkova. The Development of Science Process Skills in Physics Education. Procedia – Social and Behavioral Sciences 186 (2015) 982 989.
- Alimam Mohammed Amine, SEGHIOUER Hamid, et ELYUSUFI, Yasyn. Building profiles based on ontology for career recommendation in E-learning context. In : Multimedia Computing and Systems (ICMCS), 2014 International Conference on. IEEE, 2014. p. 558-562.
- Alimam Mohammed Abdellah, SEGHIOUER Hamid, Alimam Mohammed Amine, Cherkaoui. Automated system for guiding scientific students to their most appropriate career. In :EDUCON Conference 2017, 25-28 July 2017 Athens, Greece.
- B. Jean Luc. ”Methods of personality assessment”. Topos Dunod, 2008.
- Burke, R. 2000. Knowledge-based Recommender Systems. In: A. Kent (Ed.) Encyclopaedia of Library and Information Systems, Vol. 69, Supplement 32.
- Sumitkumar Kanoje, Sheetal Girase, Debajyoti Mukhopadhyay, ’User Profiling for Recommender System,’ 4th Post Graduate Conference for Information Technology (iPGCon-2015), Amrutvahini College of Engineering, Sangamner, 24-25 March 2015.
- Li, Rui, Shengjie Wang, et.al. ”Towards social user profiling: unified and discriminative influence model for inferring home locations.” In Proceedings of the 18th ACM SIGKDD international conference on Knowledge discovery and data mining, pp. 1023-1031. ACM, Beijing, China, 2012
- Desislava Paneva Ontology based student modelling Conference: Chiron Open Workshop ’Ubiquitous Learning Challenges: Design, Experiments and Context Aware Ubiquitous Learning’
- Chen, W., Mizoguchi, R. (1999) Communication Content Ontology for Learner Model Agent in Multi-Agent Architecture, In Proceedings of AIED99 Workshop on Ontologies for Intelligent Educational Systems
- Kay, J. (1999) Ontologies for reusable and scrutable student model, In Proceedings of AIED99 Workshop on Ontologies for Intelligent Educational Systems
- OWL Web Ontology Language Overview. W3C Recommendation 10 February 2004, Available Online: http://www.w3.org/TR/owlfeatures /
- Hidi, S. Interest and its contribution as a mental resource for learning. Review of Educational Research, 60(4), 549-571. (1990)
- National Science Foundation, Shaping the Future: New Expectations for Undergraduate Education in Science, Mathematics, Engineering and Technology, (Report NSF 96-139) National Science Foundation, Washington, DC, 1996.
- A. Altun ”Ontologies for Personalization: A new challenge for instructional designers”, Procedia – Social and Behavioral Sciences 64, 691 – 698, Elseiver, 2012.
- Abbas H. El-Zein, Chris Hedemann. Beyond problem solving: Engineering and the public good in the 21st century. Journal of Cleaner Production 137 (2016) 692-700.
- LTSC Learner Model Working Group of the IEEE (2000) IEEE p1484.2/d7, 2000-11-28 Draft Standard for Learning Technology – Public and Private Information (PAPI) for Learners (PAPI Learner),
- Claudia C, Anis oara Paveleab, Oana Ghimbulut, A Need Assessment on Students Career Guidance. BProcedia – Social and Behavioral Sciences 180 2015 1022 1029
- Rajaraman, Anand, and Je_rey David Ullman. ’Mining of massive datasets’. Cambridge University Press, 2011.
- Smythe, C., Tansey, F., Robson R. (2001) IMS Learner Information Package Information Model Specification,
- Makinde. Fundamentals of guidance and counselling. Macmillan Publisher, 1993.
- WYNNE HARLEN (1999) Purposes and Procedures for Assessing Science Process Skills, Assessment in Education: Principles, Policy & Practice, 6:1, 129-144.