Early Detection of Alzheimer’s Using Digital Image Processing Through Iridology, An Alternative Method
Early Detection of Alzheimer’s Using Digital Image Processing Through Iridology, An Alternative Method
Volume 4, Issue 3, Page No 126-137, 2019
Author’s Name: Fernando Hernández1, Roberto Vega1, Freddy Tapia1,a), Derlin Morocho2, Walter Fuertes1
View Affiliations
1Computer Science Department, Universidad de las Fuerzas Armadas ESPE, 170501, Ecuador
2Electrical and Electronics Department, Universidad de las Fuerzas Armadas ESPE, 170501, Ecuador
a)Author to whom correspondence should be addressed. E-mail: fmtapia@espe.edu.ec
Adv. Sci. Technol. Eng. Syst. J. 4(3), 126-137 (2019); ![]() DOI: 10.25046/aj040317
DOI: 10.25046/aj040317
Keywords: Alzheimer’s, Iridology, Digital Image Processing, Machine Learning, Newton’s Interpolation, Alternative medicine

Export Citations
Over the years, alternative medicine has carried out numerous systematic studies related to the ophthalmological field, specifically the eye. Studies that propose as support of analysis to the Iridology, which studies the alterations of the iris in correspondence with the organs of the human body. Thus, it presents the opportunity to investigate neuronal diseases related to certain alterations that occur in the iris such as Alzheimer’s, in this way generate an alternative method for the early detection of Alzheimer’s based on iridology and based on the digital processing of images. Addressing this problem, a systematic literature review was carried out to evaluate the characteristics of the iris, which allow to establish criteria to determine if a person could have a problem associated with Alzheimer’s. With all this, the prototype is evaluated with an image data of N individuals who have and do not have such a clinical picture. In addition, within the evaluation is considered the extraction of several parameters that allow detecting anomalies in the iris, at the same time the best range of approximation in the pixelated will be analyzed, for the location of the brain area in the iris applying Newton’s interpolation, which will allow the modeling of a function that meets the best approximation criteria. The criteria for evaluation are presented in terms of precision, sensitivity and predictive capacity, with which the behavior of the characteristics and the impact that is generated on the performance of the proposed system can be understood. Also for a technical support the algorithm was exposed to an evaluation of results estimation and this process generated an adequate radius for the correct extraction of the segment of the iris, where the whole study will be carried out to determine and validate whether the person has Alzheimer’s or not.
Received: 08 January 2019, Accepted: 08 May 2019, Published Online: 26 May 2019
1. Introduction
The present work is an extension of the work originally presented at the CISTI’2018 – 13th Iberian Conference on Information Systems and Technologies, held on June 13 and 16, 2018, in Caceres, Spain [1].
The objective of expanding this work was to address in a more detailed way the alternative method proposed to detect Alzheimer’s as a neuronal disorder in the early stage, which affect society today. The starting point for this type of pathological analysis is to determine patterns associated with the iris of the eye, through the use of digital image processing to obtain and issue criteria related to alternative diagnosis. It is worth mentioning that the study is based on iridology that is based on alternative medicine as a support for its scientific validation.
The statistics show that Alzheimer’s covers 60% of all neuronal diseases, which has awakened an alert and a great medical challenge around the world, in public health issues. Alzheimer’s, being considered one of the most complex neurodegenerative disorders, studies several factors that influence the possible diagnosis, which in itself is already complicated. Because the symptoms are notorious and occur in very advanced stages (age and progression of the disease) and severe disease, making the treatment useless because it is irreversible [2].
Alternative medicine uses techniques based on iridology, as a strategy for the study of pathologies based on the iris of the eye, that is, the colored membrane of the eye [3]. The iridology relates the iris to the organs of the body, and links these alterations based on the analysis of characteristics among which we highlight: color, texture, nerve rings, gaps, inflammations, among others. The result obtained is a diagnosis of non-scientific diseases [4].
The iris on its side is a flat and ring-shaped membrane, it contains pigments that provide color to the eyes, and is composed of connective tissue cells with muscle fibers that control the size of the pupil [5]. In addition, the iris develops from the formation of the fetus, and has the peculiarity of shrinking the pupil if there is too much light and expanding it if there is not enough, a function controlled by the brain [6]. These considerations are fundamental for the development of the present study.
ISO / IEC 29794-6 establishes the methods used to quantify the quality of iris images, as well as software and hardware regulatory requirements. This helps regulate the samples during the analysis; However, medical conditions that could affect the study of the iris, such as: excessive dilation or constriction of the pupil, congenital diseases, surgical procedures and many other pathologies must be considered. All this affecting directly or indirectly the results obtained by the iris recognition systems [7].
Of the several studies reviewed for the realization of this research, many highlight the importance of the eye to assess medical disorders associated with problems such as: alcoholism, smoking, hypertension, diabetes and obesity [8]; for this case, the relationship between the study of the iris and neurological disorders such as Alzheimer’s will also be determined.
The advantage of the iris is that due to its anatomical structure it varies between each individual, making it difficult to falsify it. That is the importance as a biometric authentication method, using pattern recognition based on images of the iris of the eye [5]. In addition, with the support of sophisticated camera systems and computer-aided image processing, they capture high-quality samples that are converted and stored as digital templates. With its objective characteristics that have greater precision, reliability and high efficiency in the results [5].
On the other hand, iridology has been used for years in alternative medicine as a diagnostic method for diseases, which is based on establishing related patterns between the organs of the body and the iris of the eye; therefore, it allows a mathematical representation of the iris allowing a positive and unequivocal identification of the individuals analyzed [6]. Therefore, applying a neural network will help validate the alternative method proposed and the results of the diagnosis, gathering the largest amount of information stored in the iris of the eyes (Fig. 1).
The remainder of the article has been organized as follows:
Section I addresses a systematic review of literature and related work with respect to the central theme and other works that contribute to the understanding of the field of study. Section II deals with the Methodology used to obtain the characteristics, as well as analyzing the learning algorithms and classifiers that adapt better. Section III presents the results obtained, as a result of qualitative exploratory analysis, in addition to the use of mathematical models that validate the proposed model and software. Finally, Section IV presents studies related to this research, as well as the incorporation of some ideas and future lines of research.
1.1. Literary Review and Functionality
The reviewed works focus much of their attention on the enormous utility of digital image processing, since they allow to determine certain health disorders related to vision. For this, digital templates play a major role in determining the characteristics of location and removal of the eyes, which are necessary to determine diagnoses and evaluate them [9]. These studies also reveal that during the analysis stage for the recognition of the iris, aspects such as surgeries, cataracts, among others must be considered. All this, compared with eyes without any problem or pre-existing surgery, as it influences the performance of recognition, with a non-coincidence rate equal to 11% percent [10].
Table 1: Comparative table of work related to the proposal made
| Related Work | Approach | Results |
| New methods of verification and identification using iris patterns | Proposal of a new method for the verification and recognition of identity with the help of the modalities of the iris of the eyes | The use of light in process and performance techniques can recognize the inner limit of the iris. |
| Various iris recognition algorithms for biometric identification: a review | A vision of the different methods of iris recognition. | Daugman algorithm offers maximum accuracy and minimum error rates among the four algorithms |
|
Assessment of iris recognition reliability for eyes affected by Ocular pathologies |
More exhaustive analysis of the performance of iris recognition in the presence of various eye diseases
|
Some different diseases do not depend on the taxonomy of the disease, but on the type of damage inflicted on the eye |
| Review of Image Processing and Machine Learning Techniques for Eye Disease Detection and Classification | Review of the processing of medical images and automatic learning techniques to detect and classify images of eye diseases for the recognition of diseases | The detection and recognition of eye diseases can be achieved through the proposed system with the use of image processing techniques and data mining |
|
The application of retinal fundus camera imaging in dementia: A systematic review |
Investigate cerebrovascular disease and the contribution of microvascular disease to dementia with camera-background images. | Ten studies evaluating the properties of the retina in dementia were included. Retinopathy was more prevalent in dementia. |
| Early Detection of Alzheimer’s using digital image processing through Iridology, an Alternative method | It aims to show that there are alternative methods to detect certain neuronal disorders through the digital processing of the images in such a way that criteria related to the alternative diagnosis on said pathology can be issued. | The potential of the image analysis and the quality of the data depend on the adjustment of the criteria and the decision making when issuing the diagnosis. |
Other works present different mechanisms of analysis to locate and segment the ocular sector, but in the case of the present study it is intended to contribute with the analysis of the different characteristics extracted from the human eye; and how they influence the determination of certain pathologies such as Alzheimer’s [9] [11]. Alzheimer’s disease is a progressive disorder that causes the brain cells to degenerate and die, this being the most common form of senile dementia accompanied by a continuous decrease in the abilities of: thinking, behavior and social influencing in a negative way in the life of the individual. Alzheimer’s is composed of two systemic cerebrovascular factors, such as: diabetes and hypertension [2]. In addition, recent studies reveal that part of the population suffer from some type of eye disease such as: Macular Degeneration, Cataracts, Retinitis, Diabetic Macular Edema, Ocular Hypertension, Retinal Detachment, Glaucoma and Neurodegenerative Alteration, among others [12].
From the related works, the contribution for the proposed research can be evidenced, either by its approach and techniques which would allow to improve the results and the use of associated tools. In addition to considering the criteria that were taken into account to contrast in some way the results obtained.
2. Materials and methods
The data was analyzed and published with the help of a Foundation in the city of Quito, which collaborated with the staff for the collection of the samples. In this way, a cross-validation was carried out with the information obtained, to perform the processing of the images and subsequently obtain the characteristics of the iris of the people.
From the literature reviewed, conclusive points can be established regarding the presence of a state of alteration in any organ of the body, seeing this reflected in the iris of the human eye; and this condition is contrasted with templates of iridology to verify if it suffers from an alteration corresponding to the area where said alteration is located. Figure 1 illustrates a map or template of iridology, which allows to address the various diseases related to the organs of the body, according to alternative medicine. For the present study, the region where the alteration and anomalies that cause Alzheimer’s occur is found in the brain area.
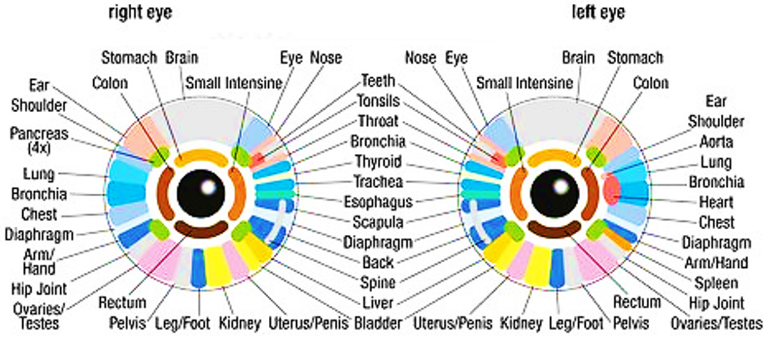 Figure 1. Iridology of the eyes map (source: Shutterstock)
The first thing that is done is to detect the color changes in the area of the brain (Fig. 1), then the relevant parameters for the analysis and subsequent evaluation are extracted. For this case, six parameters are extracted (Table 4), which are relevant for the recognition of the pathology. Then it is necessary that the system learns to establish based on criteria a possible diagnosis automatically, but through a learning, whether supervised or unsupervised applying the theory of Artificial Intelligence and other aspects. Figure 2 shows the general process by which can be described as a process diagnosis is described.
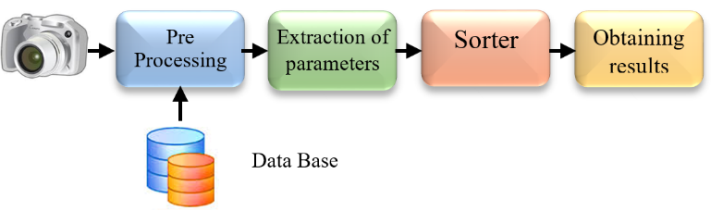 Figure 2. Proposed process for the detection and diagnosis of Alzheimer’s
2.1. Process Description
The process begins when the system acquires an image of the iris, which can be obtained from an existing camera or database (for example, Iriso). For the present work we use the images that were obtained by the Foundation, it is worth mentioning that these are in JPG format due to pixelated themes when processing the image (Fig. 3). During the pre-processing of the image, some steps are carried out to determine the characteristics that will be used later.
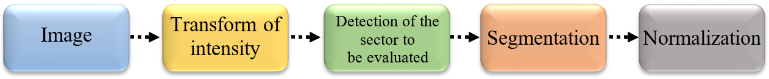 Figure 3. Algorithm of image pre-processing
In the next step, the detection of the inner (iris) and external (pupil) edges is performed, using the Hough Transform, which basically detects the circular shape of the sectors of the eye (Fig. 4). Then, the image is segmented applying discontinuity to divide the image where sudden changes of gray appear (Fig. 5), to establish the area of the brain that will be analyzed. An additional process that is included is the Logarithmic Intensity Transformation applied to the image, allowing to clarify the affected area.
Once the region is established, applying the Hough Transform, the LaGrange equations are applied to determine which would be the best curve that approximates the required characteristics. Then, it can be concluded that the approximations for the area of the pupil will be verified from the circumferences of 20, 30 and 40 pixels around it; and in the same way a second circumference for the interior area to the iris, which will be verified from the circumferences of 90, 100 and 110 pixels around it. The entire process will lead to obtain the corresponding region of the brain area and, this whole process aims to obtain the best sensitive area of analysis and the results are biased as little as possible.
 Figure 4. Hough transform for detection of pupil and iris
Tables 2 and 3 show the approximation processes proposed for obtaining the most suitable area of the brain, which will later be used during the testing stage and the results obtained. It must be borne in mind that the ranges identified have the purpose of covering the first sector corresponding to the brain as shown in Figure 6.
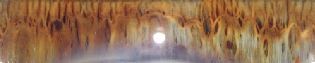 Figure 5. Process of segmentation of the image
 Figure 6. Sector of analysis corresponding to the area of the brain
Table 2. Process of obtaining the brain area (second ring)
| Approach to the brain area (IRIS) | |
| Pupil Range | Average pupil pixels |
| [30–70] | 40 |
| [40–70] | 30 |
| [50–70] | 20 |
Table 3. Process of obtaining the brain area (third ring)
| Approach to the brain area (IRIS) | |
| Pupil Range | Average pupil pixels |
| [90–200] | 110 |
| [100–200] | 100 |
| [110-200] | 90 |
The process of segmentation of the image is evaluated, verifying if it was fulfilled without problems and that oblige to adjust the process. Otherwise, it proceeds to transform to fixed dimensions that allow comparing and extracting the standardized characteristics, which in this case are white lines identified in the image that is in gray scale (Figure 7).
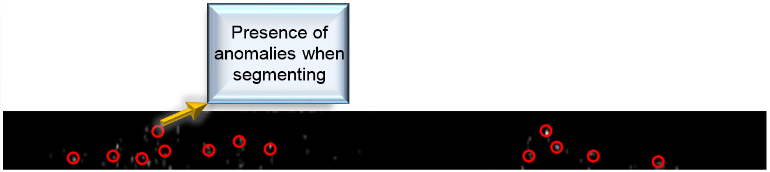 Figure 7. Normalized image for feature extraction
At this point it is intended that the system is able to feed their learning, taking as input the parameters or anomalies within the area of the brain. During the process it was possible to identify and extract 6 parameters (Table 4) as a basis for their evaluation, of which the functionality is detailed below [13]: (1) Average intensity, is the depth of the gray tone determined by the number of bits used to define each pixel, that is, the deeper it proportionally will fulfill the quantity of tones that can be represented in an image. (2) The average contrast of the standard deviation is a range of brightness or average variant in the bitmap, which is evidenced when there is a propagation of the gray levels and the texture does not have a direct proportionality with the softness. (3) The softness, is responsible for minimizing variations or intensity differentials between the closest pixels, eliminating noise or details, which includes techniques that provide a smoother appearance of the image. (4) Third moment, measures the bias or asymmetry of the central periods normalized in a histogram, from which they are derived to a set of moments: invariants, translations, rotations and changes of scale. (5) Uniformity of the histogram, verify if there is correspondence between the number of pixels and the gray level of a monochromatic image, where the elongation or shrinkage of the curvature is analyzed. (6) Entropy, it measures the randomness of the pixels in the image, and corresponds to the average of information it has after applying the segmentation process, to identify information relevant to its analysis.
Table 4 describes the parameters of the image associated with the characteristics that were extracted in the previous stage to be processed.
Table 4. Name of the parameter and number of features extracted
| Name of the evaluated parameter | Number of extracted characteristics |
| Average intensity | 1 |
| Average contrast of standard deviation | 1 |
| Mildness | 1 |
| Third moment | 1 |
| Uniformity of the histogram | 1 |
| Entropy | 1 |
| TOTAL | 6 |
2.2. Sorter
To evaluate the 6 parameters or characteristics extracted, supervised learning techniques will be used, however, it is verified that it is simple and agile during the processing. For which purpose it is tried to review some proposals found in the literature, in such a way that when evaluating and comparing its performance, it allows to realize a correct discrimination and detection of thresholds, thus we have the most suitable techniques: ZeroR, Multilayer Perceptron and Naive Bayes. (1) ZeroR: is a classifier that predicts the majority (nominal) or average (numerical) value class according to the purpose. In addition, it is easy to implement and serves as a basis for measuring the performance of other classifiers [8]. (2) Multilayer perceptron: it is a logistic regression classifier; with a neural network of backward propagation formed a single hidden layer, which is used to solve problems that cannot be separated linearly, reducing as much as possible the threshold in the values of bias [8]. (3) Naïve Bayes: it is an automatic probabilistic learning model that is used for the task of simple classification and widely used for its sophisticated way of working, it is useful for quite large data [8].
3. Evaluation and validation results
At this point, feedback is given on the process that has been carried out to carry out the validation tests with the diagnosis obtained: in the first instance, the images are acquired in a Foundation of the city of Quito; these images being those corresponding to elderly people who have a clinical Alzheimer’s disease, with which a Database is structured.
As a second point, the images are taken to apply digital processing, thus obtaining the parameters or characteristics necessary for the analysis of said criteria. The derivative of this process resulted in obtaining 3 characteristics that do not influence the results (Table 5), on the other hand, the remaining 3 characteristics were considered of high relevance at the time of presenting the diagnosis (Table 6). Analyzing the results scenario, we choose to exclude the less relevant characteristics to avoid the over-training of the classifier.
Then, in the analysis stage of the possible pathology, the proposed classification methods are used, to evaluate the efficiency of each one and to determine which is ideally suited to the particularities of the prototype. Obtaining as a result a system that is capable of performing recognition through automatic learning, during training.
Table 5. Unnecessary characteristics in the diagnosis of Alzheimer’s
| Name of the evaluated parameter | Number of extracted characteristics |
| Mildness | 1 |
| Third moment | 1 |
| Average intensity | 1 |
| TOTAL | 3 |
Table 6. Characteristics needed in the diagnosis of Alzheimer’s
| Name of the evaluated parameter | Number of extracted characteristics |
| Average contrast of standard deviation | 1 |
| Entropy | 1 |
| Uniformity of the histogram | 1 |
| TOTAL | 3 |
Next, the parameters within the classifiers are evaluated and thus determine if they adapt to the proposed diagnostic model. In the case of ZeroR, the characteristics of medium intensity, smoothness and standard deviation in RGB are analyzed. On the other hand, in the case of the multilayer perceptron, the characteristics of the standard deviation of RGB and the third moment are analyzed. Finally, similar tests were carried out in Naïve Bayes, unlike the other classifiers, in the latter it was possible to establish decision rules as shown in Figure 8.
At this point, it is concluded that the efficiency of the ZeroR and Multilayer Perceptron classifiers are not suitable for the process of identifying the characteristics, since their predictive capacity is approximately 0.45 in relation to the Naïve Bayes classifier with a predictive capacity of 0.63, this being much higher and reliable in terms of precision, sensitivity and specificity, which will allow to establish an appropriate diagnosis. analyzed and presented in terms of accuracy, sensitivity, specificity and predictive capacity; all this analysis is achieved by applying a tool known as “ROC Curve” [13], used in clinical/medical research, which allows to measure the overall performance of a test and compare it with the other tests; for this, the area under the curve called “receiver performance characteristic” to verify the performance of the system (see equations 1-3).
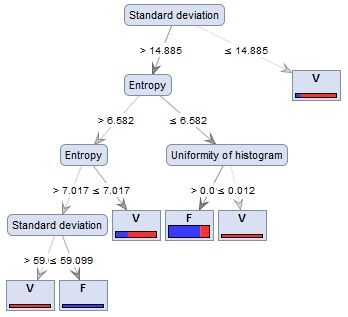 Figure 8. Decision Tree
Accuracy is the ratio between the addition of true positives and true negatives, out of a total number of cases inspected:
Sensitivity measures the model’s ability to discover true positives:
The specificity is the percentage value that represents the group of healthy people or who do not have the correctly identified conditions:
Given the following: i) VP – true positive; ii) VN – true negative; iii) FP – false positive; and, iv) FN – false positive.
The result of the ROC curve shows the sensitivity to the specificity that each classifier has for all threshold values, in which they can take the different values to yield a possible decision based on characteristics. During the analysis of the area under the curve, we have the following observations: (1) the area as close as possible or equal to 1, indicates that the predictor has ideal prediction characteristics, which does not occur with an area near or equal to 0.5. Where the predictor has more random characteristics of prediction, what in a clinical system is relevant in the diagnosis. Then, the data is taken to elaborate the confusion matrix of the classifiers and evaluate them in the ROC curve.
Table 7 shows the average of the precision, sensitivity, specificity and predictive capacity obtained by each classifier, during the analysis that the ROC curve showed for each case. Thus it can be identified that the Naïve Bayes classifier has a better performance compared to the other two classifiers. Therefore, Table 8 presents the confusion matrix of this classifier, with which the values of precision, sensitivity and specificity of the system were obtained.
Table 7. Efficiency of classifiers
| Sorter | Accuracy % | Sensitivity % | Specificity % | Predictive ability |
| ZeroR | 61.9565 | 100 | 0 | 0.454 |
| Multilayer perceptron | 61.9565 | 92.7272 | 16.2162 | 0.449 |
| Naïve Bayes | 61.9565 | 74.0000 | 47.6191 | 0.632 |
The results shown in Table 7 show the efficiency level of the classifiers, during the analysis the ROC curve was shown for each case. Then, it can be concluded that the Naïve Bayes classifier is more efficient in relation to the other two classifiers. Therefore, the confusion matrix of the Naïve Bayes classifier is elaborated, as shown in Table 8, from which the precision, sensitivity and specificity values of the proposed system were obtained.
Table 8. Matrix of confusion of Naïve Bayes
| Alzheimer’s Prediction | |||
| Yes | No | ||
| Alzheimer | Yes | 37 | 20 |
| No | 22 | 13 | |
During the analysis of the results shown in the ROC curve (Figure 9), all possible positive values (true positives and false positives) were identified to generate the diagnosis. On the other hand, the area value of the ROC curve oscillates between 0.632, which corresponds to 63.2% of the result of the diagnosis that was made to the patient with the pathology is more precise than that of healthy patient who is chosen at random, all this taking into account the quality of the diagnostic test.
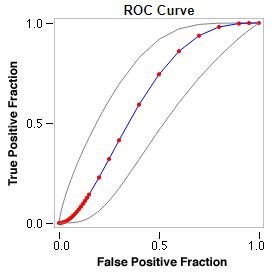 Figure 9. ROC curve for affirmative Alzheimer’s values (Naïve Bayes classifier)
We must mention some considerations to establish the reasons why the system cannot get an optimal diagnosis: (1) The first reason involves the anatomy of the human eye, where the alterations or deformations in the pupil are due to genetic processes or degenerative age, since some images obtained and sent to the segmentation process do not allow to identify the circumference; (2) the second reason involves the specialized team with which the images of the eye are captured, in which the main influence is the reflection of the light in the pupil of the eye, since during the detection of the associated characteristics in said area can be extracted partially, or none that contribute with the diagnosis.
The results of Naïve Bayes obtained in the process will be used as input data to determine the best approximation to the area of the brain. For this, Newton’s interpolation is used, which allows to establish and model curves for each proposed scenario in which abnormalities occur in the area of the brain and determine the diagnostic.
During the interpolation of Newton, mathematical functions that represent the diagnostic will be obtained, then functions are compared with each other, to determine the model that has the least error in approaching the area of the brain. The purpose is to improve in some way the level of precision in the preventive diagnosis.
3.1. Stage 1: Analyzing the data in image 1 of the database
Result: “No abnormalities have been found in the brain area”.
Table 9. Naïve Bayes range 40-pixel pupil and 110-pixel brain.
| X | R | Y |
| 1 | 2.4650 | 99.8260 |
| 2 | 2.5970 | 23.5004 |
| 3 | 2.5070 | 0.0084 |
| 4 | 0.2550 | -0.0009 |
| 5 | 0.2550 | 0.0135 |
| 6 | 0.2550 | 6.5143 |
Figure 10 shows the result of the interpolation of the points obtained in the image processing using Naïve Bayes shown in Table 9, in such a way that the following function is interpreted:
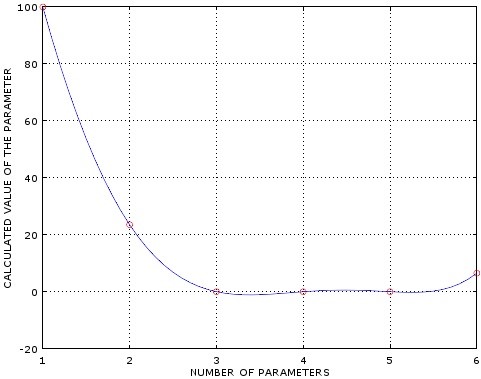 Figure 10. Modeling of the function for Naïve Bayes for the range of 40-pixel pupil and 110-pixel brain
Table 10. Naïve Bayes range 30-pixel pupil and 100-pixel brain.
| X | R | Y |
| 1 | 2.4650 | 131.251429 |
| 2 | 2.5970 | 25.564477 |
| 3 | 2.5070 | 0.009951 |
| 4 | 0.2550 | -0.227350 |
| 5 | 0.2550 | 0.013389 |
| 6 | 0.2550 | 6.569150 |
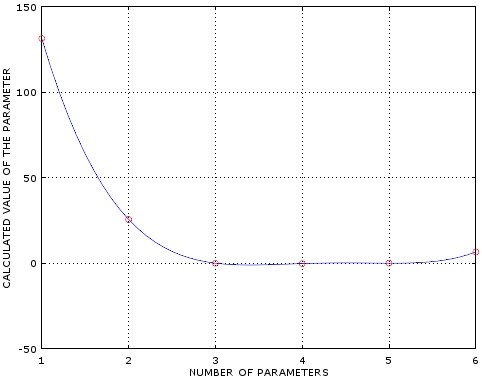 Figure 11. Modeling of the function for Naïve Bayes for the range of 30-pixel pupil and 100-pixel brain
Figure 11 shows the result of the interpolation of the points obtained in the image processing using Naïve Bayes shown in Table 10, in such a way that the following function is interpreted:
Table 11. Naïve Bayes range 20-pixel pupil and 90-pixel brain.
| X | R | Y |
| 1 | 2.4650 | 74.029405 |
| 2 | 2.5970 | 17.280810 |
| 3 | 2.5070 | 0.004571 |
| 4 | 0.2550 | 0.053247 |
| 5 | 0.2550 | 0.019178 |
| 6 | 0.2550 | 6.040649 |
Figure 12 shows the result of the interpolation of the points obtained in the processing of the image using Naïve Bayes (See Table 11), in such a way that the following function is obtained:
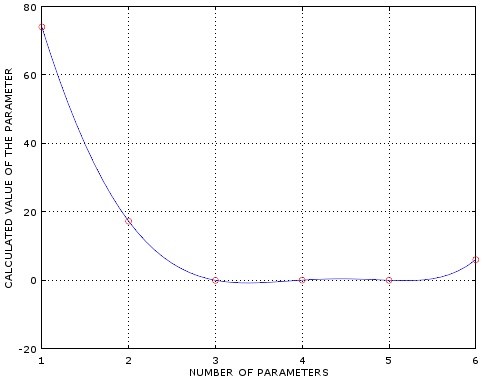 Figure 12. Modeling of the function for Naïve Bayes for the range of 20-pixel pupil and 90-pixel brain
3.2. Result of the comparison of functions Stage 1
For the comparison of the results of image 1 of the database with criteria: “No abnormalities have been found in the area of the brain”; For this reason, it is proposed to calculate the levels of error in the approximation of functions, using a code of own authorship that will basically be evaluated in the same intervals of functions.
In order to appreciate the graph and analytically the error that would later be compared with a table that explains this process.
3.3. Results of the analysis of image 1 of the database
Result: “No abnormalities have been found in the brain area”.
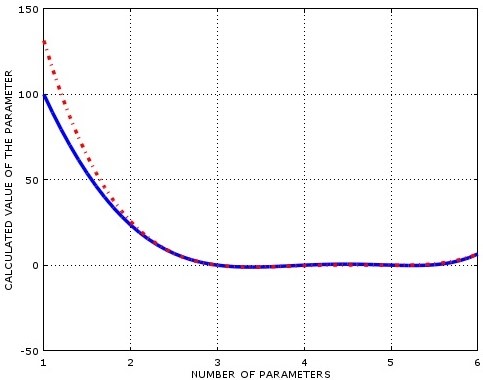 Figure 13. Comparison between the functions: Range of 40 pixels (iris) and 110 pixels (brain) in red; Range of 30 pixels (iris) and 100 pixels (brain) in blue of the pupil
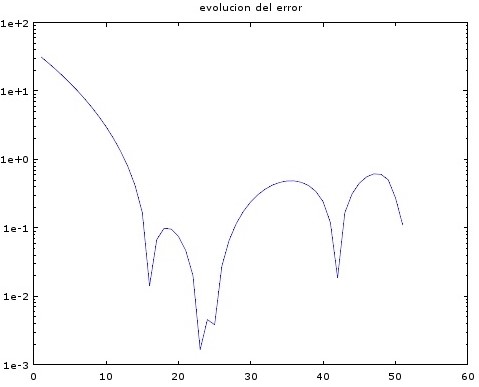 Figure 14. Approximation of the error between the functions: Range of 40 pixels (iris) and 110 pixels (brain); Range of 30 pixels (iris) and 100 pixels (brain) of the pupil
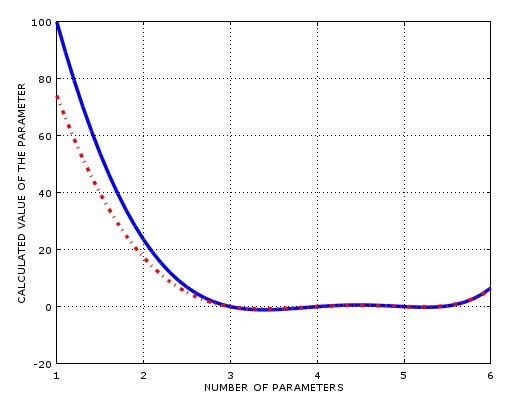 Figure 15. Comparison between the functions: Range of 40 pixels (iris) and 110 pixels (brain) in red; Range of 20 pixels (iris) and 90 pixels (brain) in blue of the pupil
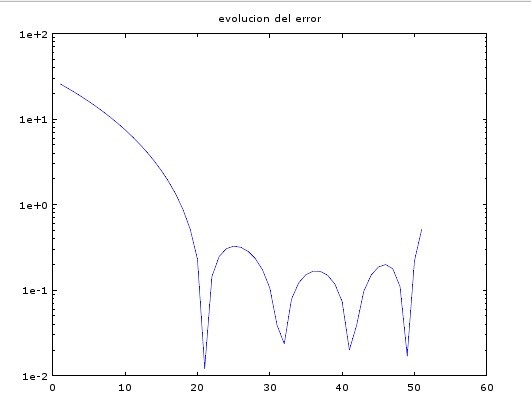 Figure 16. Approximation of the error between the functions: Range of 40 pixels (iris) and 110 pixels (brain); Range of 20 pixels (iris) and 90 pixels (brain) of the pupil
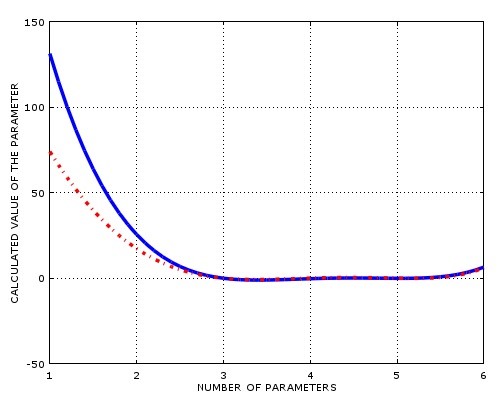 Figure 17. Comparison between the functions: Range of 30 pixels (iris) and 100 pixels (brain) in red; Range of 20 pixels (iris) and 90 pixels (brain) in blue of the pupil
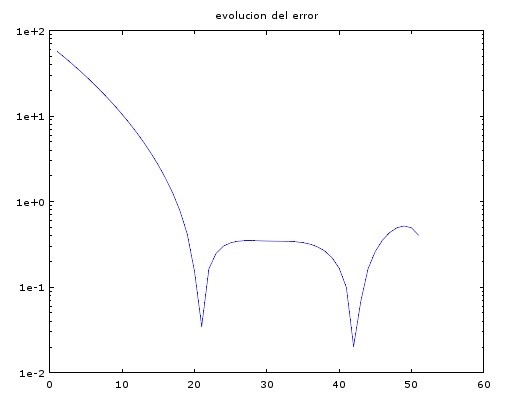 Figure 18. Approximation of the error between the functions: Range of 30 pixels (iris) and 100 pixels (brain); Range of 20 pixels (iris) and 90 pixels (brain) of the pupil
After appreciating the results of the same program where stage 1 was evaluated error reference values as shown below it was obtained Table 12:
Table 12. Referential error values analyzed with respect to image 1 of the database
| Error reference valuesResult: “No abnormalities have been found in the brain area” | |
| Function | Error |
| (1) range of 40 pixels (iris) – 110 pixels (brain) with 30 pixels (iris) – 100 pixels (brain) | 0.48533 |
| (2) range of 40 pixels (iris) – 110 pixels (brain) with that of 20 pixels (iris) – 90 pixels (brain) | 0.52800 |
| (3) range of 30 pixels (iris) – 100 pixels (brain) with that of 20 pixels (iris) – 90 pixels (brain) | 0.57215 |
During the evaluation of the pairs of functions (x, y) for the ranges that delimit the study sector of the brain, the error values that are generated in an image without anomalies detected were estimated and in this case which is adapted as a contribution of improvement to the proposed diagnostic model (Table 12).
3.4. Stage 2: Analyzing the data in image 2 of the database
Result: “Abnormalities have been found in the brain area”.
Table 13. Naïve Bayes range 40-pixel pupil and 110-pixel brain.
| X | R | Y |
| 1 | 2.4650 | 108.3348 |
| 2 | 2.5970 | 29.2406 |
| 3 | 2.5070 | 0.0130 |
| 4 | 0.2550 | -0.6294 |
| 5 | 0.2550 | 0.0176 |
| 6 | 0.2550 | 6.2318 |
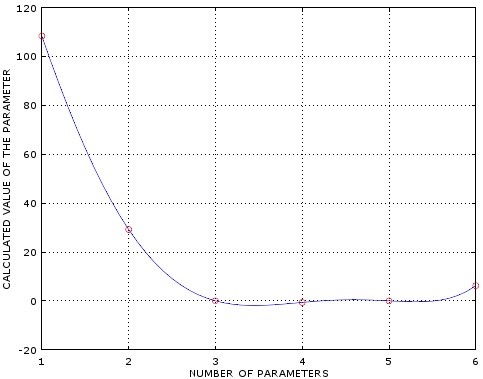 Figure 19. Modeling of the function for Naïve Bayes for the range of 40-pixel pupil and 110-pixel brain
Figure 19 shows the result of the interpolation of the points obtained in the image processing using Naïve Bayes shown in Table 13, in such a way that the following function is obtained:
Table 14. Naïve Bayes range 30-pixel pupil and 100-pixel brain.
| X | R | Y |
| 1 | 2.4650 | 99.571548 |
| 2 | 2.5970 | 29.976068 |
| 3 | 2.5070 | 0.013630 |
| 4 | 0.2550 | 0.350826 |
| 5 | 0.2550 | 0.012525 |
| 6 | 0.2550 | 6.722807 |
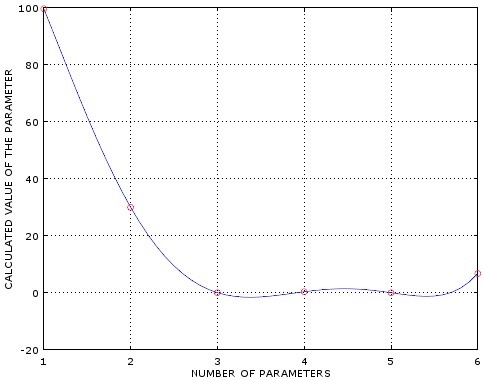 Figure 20. Modeling of the function for Naïve Bayes for the range of 30-pixel pupil and 100-pixel brain
Figure 20 shows the result of the interpolation of the points obtained in the image processing using Naïve Bayes shown in Table 14, in such a way that the following function is obtained:
Table 15. Naïve Bayes range 20-pixel pupil and 90-pixel brain.
| X | R | Y |
| 1 | 2.4650 | 84.176905 |
| 2 | 2.5970 | 23.862226 |
| 3 | 2.5070 | 0.008681 |
| 4 | 0.2550 | 0.266040 |
| 5 | 0.2550 | 0.016836 |
| 6 | 0.2550 | 6.352425 |
Figure 21 shows the result of the interpolation of the points obtained in the image processing using Naïve Bayes shown in Table 15, in such a way that the following function is obtained:
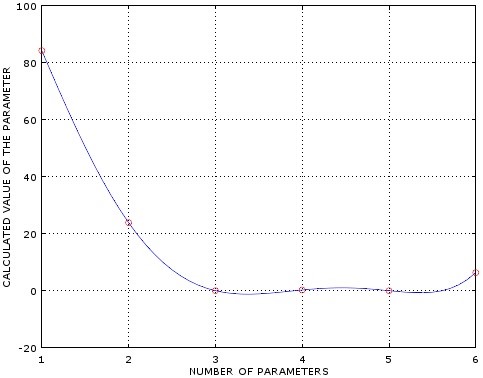 Figure 21. Modeling of the function for Naïve Bayes for the range of 20-pixel pupil and 90-pixel brain
3.5. Result of the comparison of functions Stage 2
In this case for the comparison of the results of image 2 of the database with criteria: “anomalies have been found in the area of the brain”; For this reason it is proposed to calculate the error levels in the approximation of the functions using the same own authorship code applied in scenario 1, in order to evaluate in the same intervals pairs of functions. To appreciate graphically and analytically the error that was later compared in a table that explains this process.
3.6. Results of the analysis of image 2 of the database
Result: “Abnormalities have been found in the brain area”.
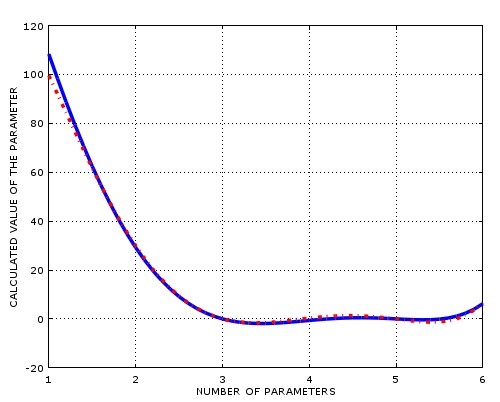 Figure 22. Comparison between the functions: Range of 40 pixels (iris) and 110 pixels (brain) in red; Range of 30 pixels (iris) and 100 pixels (brain) in blue of the pupil
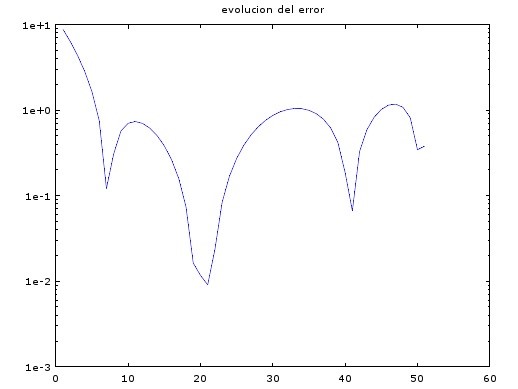 Figure 23. Approximation of the error between the functions: Range of 40 pixels (iris) and 110 pixels (brain); Range of 30 pixels (iris) and 100 pixels (brain) of the pupil
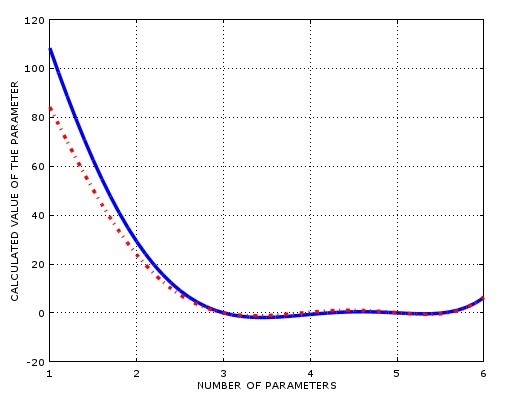 Figure 24. Comparison between the functions: Range of 40 pixels (iris) and 110 pixels (brain) in red; Range of 20 pixels (iris) and 90 pixels (brain) in blue of the pupil
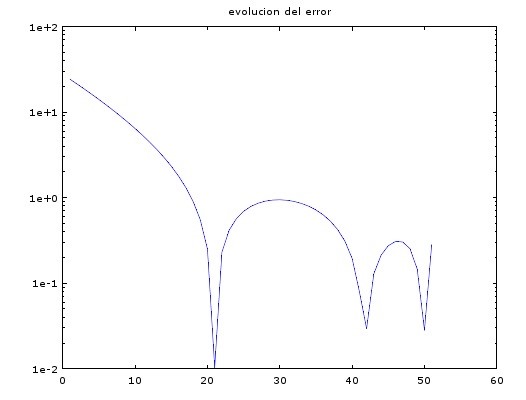 Figure 25. Approximation of the error between the functions: Range of 40 pixels (iris) and 110 pixels (brain); Range of 20 pixels (iris) and 90 pixels (brain) of the pupil
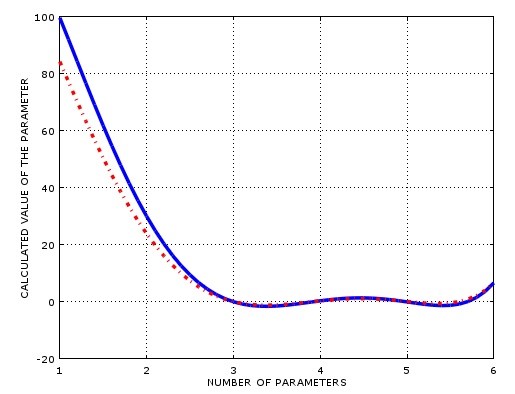 Figure 26. Comparison between the functions: Range of 30 pixels (iris) and 100 pixels (brain) in red; Range of 20 pixels (iris) and 90 pixels (brain) in blue of the pupil
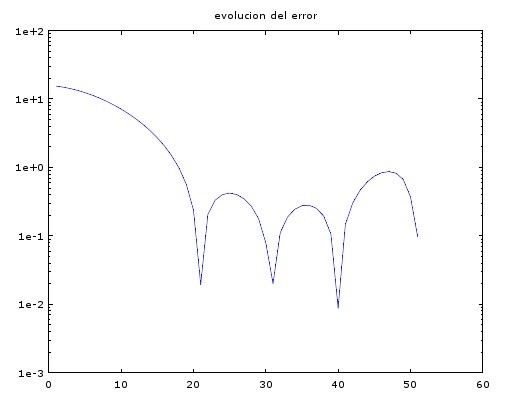 Figure 27. Approximation of the error between the functions: Range of 30 pixels (iris) and 100 pixels (brain); Range of 20 pixels (iris) and 90 pixels (brain) of the pupil
After appreciating the results obtained from the same program where scenario 2 was evaluated, reference error values were obtained as shown below (Table 16):
Table 16. Referential error values analyzed with respect to image 2 of the database
|
Error reference values Result: “Found abnormalities in the brain area” |
|
| Function | Error |
| (1) range of 40 pixels (iris) – 110 pixels (brain) with 30 pixels (iris) – 100 pixels (brain) | 0.87607 |
| (2) range of 40 pixels (iris) – 110 pixels (brain) with that of 20 pixels (iris) – 90 pixels (brain) | 0.24154 |
| (3) range of 30 pixels (iris) – 100 pixels (brain) with that of 20 pixels (iris) – 90 pixels (brain) | 0.15393 |
During the evaluation of the pairs of functions (x, y) for the ranges that delimit the study sector of the brain, the error values that are generated in an image with anomalies detected were estimated and in this case which is adapted as an improvement to the model of proposed diagnosis (Table 16).
3.7. General analysis of the results obtained
The results of the pairs of functions (x, y) reviewed and evaluated, were analyzed to conclude that those with a lower level of error will be taken in the study, in order to allow a tolerable approximation to the solution being investigated. For this case, the functions are taken for the range (1) (Table 12) and the functions for the range (3) (Table 16) with error levels of 0.48533 and 0.15393 respectively.
During the validation of the model, the permissible error level with which the system works was estimated (Table 17), analyzing the pairs of functions (x, y) the range of 30 pixels, shown in Fig. 28.
Table 17. Referential value of error
| Referential error value permissible for the model | |
| Function | Error Value |
| (3) 30 pixeles (iris) – 100 pixeles (cerebro) | 0.075019 |
The characteristics or parameters that were previously extracted during the processing stage are evaluated with the best approximation model to adjust the diagnostic results. In Fig. 28 can be analyzed aspects such as: possible pathology or some anomaly located in the iris of the eye that corresponds to the brain area, and achieve compare the results thrown by the system.
Table 17 indicates the level of error, which is within a margin of 1%, being permissible at the time of presenting correct results, including understanding that the functions are adjusted to the requirements of the system. In any case, the error can be controlled and improved by using processing data in other types of models that can adapt to the proposed predictive system.
These results are favorable to the problem of the lack of early detection in patient has Alzheimer’s disease; the diagnosis will be verified when attending a medical appointment and receiving the appropriate treatment avoiding the complication of the future pathology. The ROC curve indicates a good level of prediction, however, it must be optimized in order to implement a fully automatic system, and that is, a high value in the ROC curve is required. Based on this the present work determined that the predominant value is the sensitivity to specificity, since during the process it was analyzed and determined that a pathology of easy analysis and interpretation is better in healthy patients. With the implementation of patterns in corrective models on the approach function to the brain area, the level of approach proposed in this work can be improved. The numerical method of Newton’s interpolation is already one of the modeling processes of a function that allows coupling certain approximation criteria for detection of the brain area.
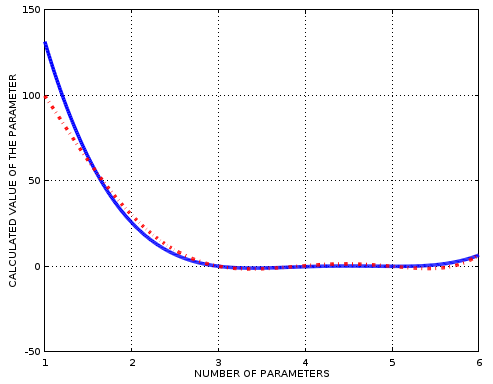 Figure 28. Comparison between functions with a range (3). Has Alzheimer’s disease (blue), does not have Alzheimer’s disease (red)
The results presented in the study are a contribution to the analysis and medical support, as a response to the lack of alternative methods of early detection of Alzheimer’s disease. During the diagnosis, the doctor will use the results to hire and help them, as well as when the patient attends a medical appointment, will receive the indications and treatment to prevent future complications and a possible condition of this pathology.
On the other hand, we have the results of the ROC curve as satisfactory in terms of its predictive capacity, however, it is necessary to optimize it by improving the growth of the curve to obtain an area closer to 1, turning it into a fully automatic system. Taking these results, it can be determined that there is a higher level of preponderance in terms of sensitivity and specificity, since during the study it can be verified that the pathology can be analyzed and contributes with the doctors in a better way. Another observation regarding the model of approach to the area of the brain we can analyze that the method of interpolation of Newton allows coupling based on the criteria of approach to detect the area that corresponds to the brain, however, it can be optimized with the use of patterns based on the models generated by the functions.
4. Conclusions and future work
One of the most significant differences between each classification algorithm is the percentage of accuracy, which may vary depending on the characteristics that are implemented in each of them.
In order to reach an adequate characterization of subtypes of this pathology, more significant and more relevant characteristics must be used, that is, a better specific treatment based on patterns that can present each of these characteristics provided by the processing of the iridology template.
The adequate extraction of characteristics is proportional to an adequate recommendation of the pathology in question, it can be achieved with an exhaustive work of spatial image processing.
In the work in question, the most relevant classifier is Naïve Bayes with a 61.96% of accurate diagnoses, a 74.00% probability of success that a patient with this pathology obtain a diagnosis with an assertive result and a 47.62% of a patient in optimal conditions, this pathology does not.
The values of this study allow to have a better panorama of the situation that is being handled and of the variants that a future could intervene for the improvement of the proposed algorithm.
For associated works that are going to be carried out, more sophisticated tools such as convolutional neural networks should be used, specifically if you have adequate data for the work in question.
The use of artificial vision tools is limited for the present work since it is not strictly counted with a sufficiently robust data for the use of it.
It is recommended the use of google APIs like Tensor Flow, as an artificial vision tool to compare the results.
Supervised and unsupervised learning can significantly help the crystallization of a project, the parameters to be used should always be defined by a multidisciplinary group where specialists and technicians of the area are always involved so that the emission of results always contains a significant value.
- Hernández, F., Vega, R., Tapia, F., Morocho, D., & Fuertes, W. (2018). Early detection of Alzheimer’s using digital image processing through iridology, an alternative method. 2018 13th Iberian Conference on Information Systems and Technologies (CISTI), 1-7.
- McGrory, S, Cameron, J, Pellegrini, E, Warren, C, Doubal, F, Deary, I, Dhillon, B, Wardlaw, J, Trucco, E & MacGillivray, T 2017, “The application of retinal fundus camera imaging in dementia: a systematic review” Alzheimer’s & Dementia: Diagnosis, Assessment & Disease Monitoring, vol 6, pp. 91-107. DOI: 10.1016/j.dadm.2016.11.001.
- N.D.Pergad , Miss. S. B. More,* E&TC, Shri Tulja Bhavani College of Engineering, Tuljapur, India, Pergad*, 4(7): July, 2015, “Detection of diabetic presence from iris by using support vector machine”, ISSN: 2277-9655.
- Casals, J. (2013-2018). Datelobueno.com: La Web de Jordi Casals. New York, EU.: Curso de Iridologia. Recuperado de http://datelobueno.com/.
- Gao Xiaoxing1, Feng Sumin2, Cui Han, Shijiazhuang University of Economics, Shijiazhuang 050031, China, Shijiazhuang Engineering Vocational College ,Shijiazhuang 050031, China, June 2015, ‘Enhanced iris recognition based on image match and hamming distance’, VOL. 8.
- Najmeh dashti nejad, June 2015, ‘Diagnosis of heart disease and hyperacidity of stomach through iridology based on the neural network’, Vol. 2, No. 6, 2015, pp. 17-25, ISSN 2454-3896.
- Mateusz Trokielewicz, Adam Czajka, Piotr Maciejewicz, Poland-2014, “Cataract influence on iris recognition performance”, Proc. of SPIE Vol. 9290 929020-1, doi: 10.1117/12.2076040.
- Sarika G. Songire, Madhuri S. Joshi, PhD, India-431001, January 2016, “Automated Detection of Cholesterol Presence using Iris Recognition Algorithm”, Volume 133 – No.6.
- Ali Azimi Kashani*, Alimohamad Monjezi Nori, Iman Mosavian, 2015, “New methods of verification and identification using iris patterns”, pp. 118-122, ISSN 1115-7569.
- Mateusz Trokielewicz, Adam Czajka and Piotr Maciejewicz, “Assessment of iris recognition reliability for eyes affected by ocular pathologies”, The IEEE Seventh International Conference on Biometrics: Theory, Applications and Systems (BTAS 2015), September 8 – 11, 2015, Arlington, USA.
- Chandranayaka, I.R, Jul-Aug, 2016, “Various iris recognition algorithms for biometric identification: a review”, Vol. 03, Issue 04, Pg. 286 – 290, ISSN – 2394-0573.
- Mr. Langade Umesh, Ms. Malkar Mrunalini, Dr. Swati Shinde, March 2016, “Review of Image Processing and Machine Learning Techniques for Eye Disease Detection and Classification”, Volume: 03 Issue: 03, e-ISSN: 2395 -0056, p-ISSN: 2395-0072.
- Gonzalez, Rafael C.; Woods, Richard E. “Digital Image Processing”, 2007, Addison-Wesley. Publishing Company, Inc.