Evaluation of IEEE 802.11n and IEEE 802.11p based on Vehicle to Vehicle Communications

Adv. Sci. Technol. Eng. Syst. J. 4(2), 422–427 (2019);
 DOI: 10.25046/aj040252
Wireless communication opens up new avenues in the field of intelligent vehicle systems, including monitoring, guidance and warning applications. In order to determine more precisely the feasibility of using the 802.11n standard in vehicular communication systems, this paper describes a process for evaluating the propagation performance of the 802.11n and 802.11p standards. To do that, the antennas are described and simulated using Win Pro Solutions which include Proman, Wallman softwares. The measurements were performed using an urban environment to prove the effectiveness of the simulation analysis
1. Introduction
This section we focus in the properties of propagation of electromagnetic waves, second section related works, third section simulation of the standard that we want to compare and in the final section the results.
Radio propagation is the behavior of electromagnetic waves in the radio spectrum when propagating, from one point to another. Like light waves, radio waves are affected by the phenomena of reflection, refraction, diffraction, absorption, polarization and dispersion and interference. Understanding the effects of different conditions on the propagation of the radio has many practical applications such as: frequency selection, power, type of modulation, type of antenna, among others. To simulate how electromagnetic waves propagate the WinProp software was used, this software includes a set of tools for simulation in the domain of wireless propagation and radio network planning. To solve this problem, the Friis equation was used to calculate the power received from an antenna, when it is transmitted from another antenna, as follows:
Pr = PtGtGr(λ/4πR)2 (Dbm) (1)
Where Pr is the power at the receiving antenna, Pt is the transmitted power, Gt is the gain in the transmitted antenna, Gr is the gain in the received antenna, R is the distance from the transmitted antenna to the received antenna, λ is the wavelength. This is the equation used by the PROMAN software to calculate the behavior of the propagation of the different wireless systems.
Our real objective was design a low cost vehicular communication system to prevent for frontal and read collision, the system designed allow to send vital information between vehicles that are within the coverage and limitations of the communication protocol used. The system to be designed will be able will be able to establish a vehicular communication between the mobile nodes. Because the V2V network does not behave like a conventional star network with a main node assigning the IP addresses, other alternatives such as Ad-Hoc networks will be searched.
2. Related Works
Considering the above-mentioned paragraph, the initiatives are addressing the problem of how to improve monitoring vehicle communication capacities in order to reduce accident risk. The ongoing studies are focused mainly on calculating the performance of communication [1], [2], [3], understanding of the environment surrounding [4], [5], the geometry-based vehicular propagation modeling and simulation [6], [7], as well as a vehicular cloud-based communication
Researchers [8] used the Friis equation to estimate the distance between the mobile device and the access point within an indoor environment using a trilateration strategy. Researchers in [9] analyzed how the performance of the V2V communication system in a controlled or not environment. To do this, the author uses the Network Simulator (NS2). In that sense, Authors in [10] proposed to use the optimized network engineering tools (OPNET) simulator to introduce a modeling and solution of a large scale vehicle communication problem.
The main difference of our journal is that in most of the cases investigation for vehicular communication where based using 802.11a standard that is no longer being used. We also focus our investigation in the possibility to use 802.11n for V2V because the 802.11p standard hardware are too expensive.
3. Simulation Analysis
To mesure the cause and effect between the urban environment and the V2V/V2I communication model a performance evaluation between both IEEE 802.11n and IEEE 802.11p standards were developed. The statistical measurement analysis was conducted at the Causeway Islands, Amador, Panamá, see Figure 1. To do that a database of the urban scenario was created using WinProp software. The 3D model of the urban environment was edited and generated using WallMan software, while to predict the propagation the ProMan software was used. The electrical specifications of the Raspberry Pi that has been used in the simulation process are shown in Table I and Table II.
Note: FCC ID Web [11]
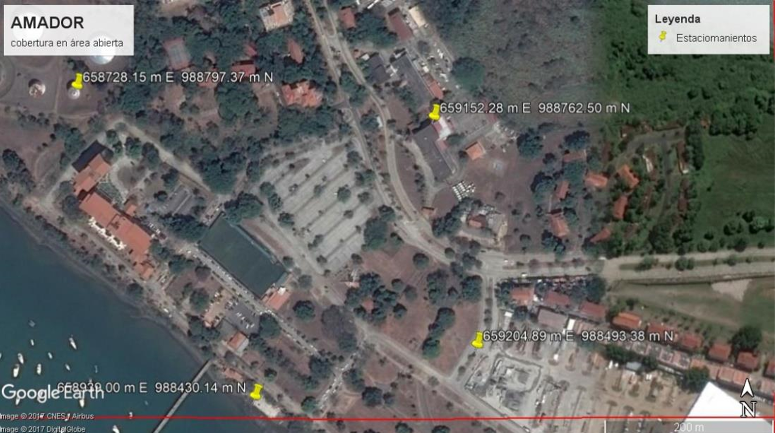 Figure 1. Satellite image of open area , Panama
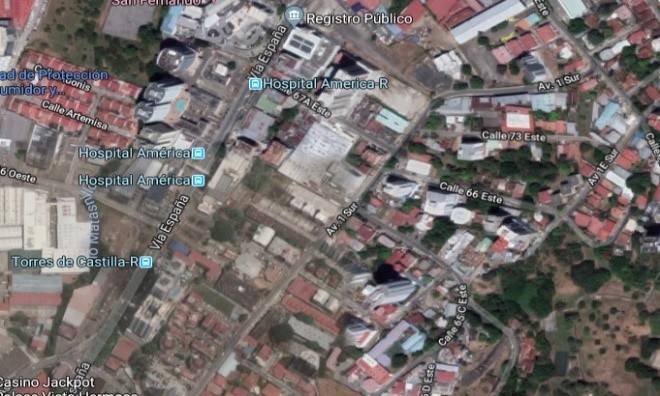 Figure 2. Satellite image urban area, Panamá.
Note: FCC ID Web [11]
3.1. Image Reference
To get the reference image to be used in the IEEE 802.11n and IEEE 802.22p simulation task the satellite image of the following places located in Panama City were used: Amador and Via España. Google Earth Maps was used to get the satellite imagery and geospatial information of the selected areas. The information was added to Wallman Sofware as follows:
- Height in meters. Building, trees and objects are limited to a height of 732 meters.
- Width and Length in meters. This was done by subtracting the UTM coordinates, in case of the width from the East to the West, to extract the length the coordinates from the North to the South were subtracted.
- Finally, the process was repeated for all those areas within the image were the propagation model should be computed.
3.2. Scenery Recreation
In this section we proceed to create the database that will be used in the Proman to determine the propagation of the following way.
- To define the environment information, the indoor database and draw option was selected. It is important to emphasize that to perform the simulation with different urban scenarios the indoor database option should be used. Using this option, objects such as trees, bulk, building, as well as other objects are added into the database.
- Due to the absence of 3D maps information of the urban area, the option draw was used to describe the 3D environment data.
- Then the catalog material properties for different frequency bands of materials [12].
- Once the catalog is imported into the database, the georeferenced image was created by specifying units in meters. This process can also be done by using UTM coordinates (X,Y), however it will cause some difficulties viewing images because pixels are not correctly mapped into the simulator.
- Finally, database information of buildings and other objects were added.
Figure 3 and 4 shows the process result. The information related to the trees was shown into the image using a cylinder shapes in green.
Note: D is the distance between the antennas, from t1 to t2 are the samples results in meters, A are the average in meters.
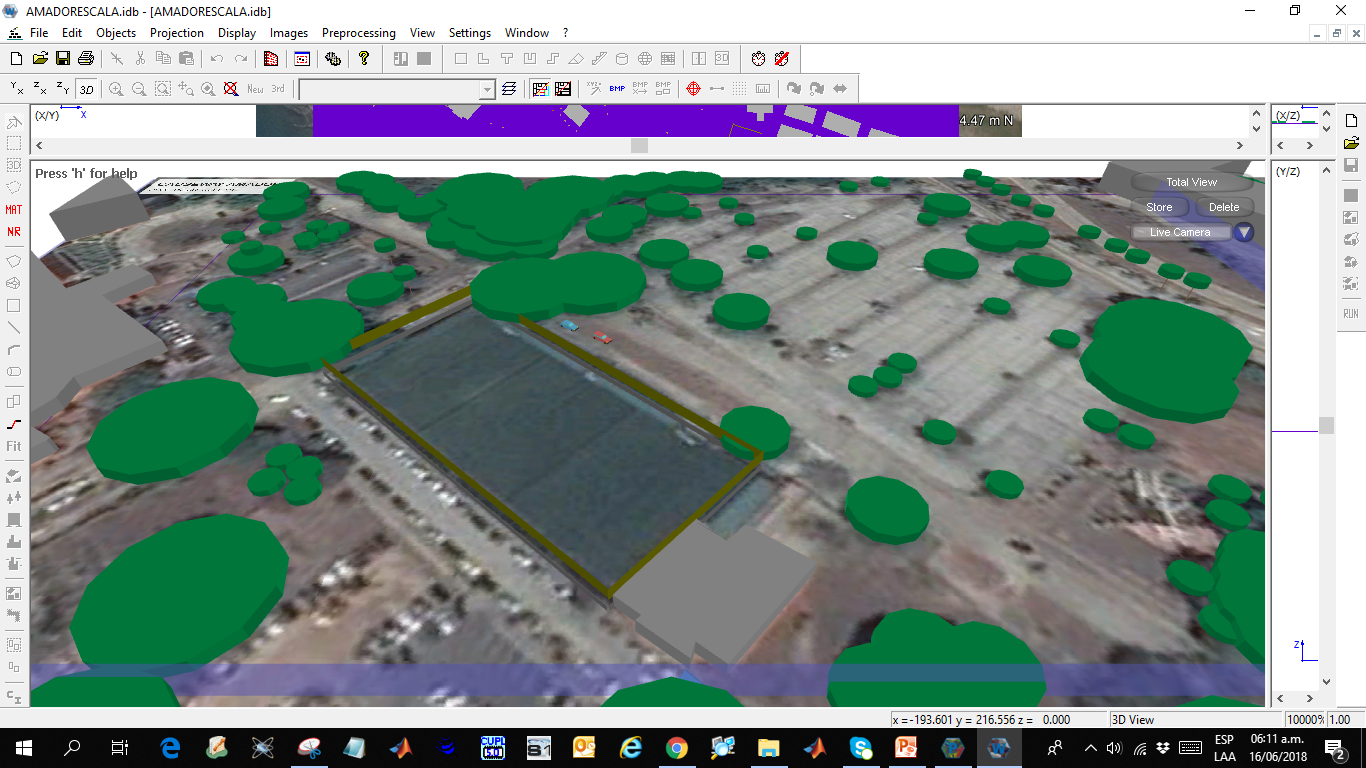 Figure 3. Shows the process result. The information related to the trees was shown into the image using a cylinder shape
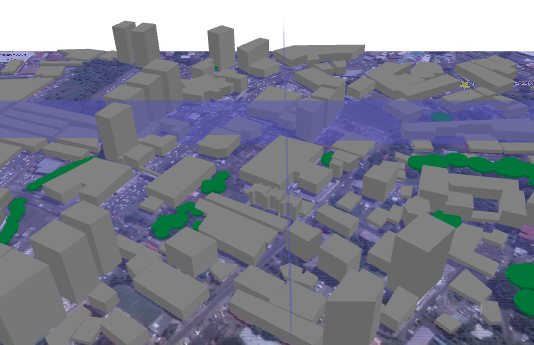 Figure 4. Shows the process result for building. The information these objects are designed using geometrical shapes like rectangles and square.
3.3. Simulation Process
To analyze the effect of the 3D urban environment under the propagation model used in the V2V/V2I communication systems a simulation was developed as follows:
- Firstly, select the connection to the database that it was created in the previous section. To do that, in the scenario section the indoor database was selected while in the indoor 3D section the database previously created was the selected one.
- Secondly, the propagation point was added. Here in the simulation option choose the time variant.
- Thirdly, the type of transmitter site and antenna were selected considering an omni-directional type which is the Raspberry Pi 3 antenna.
- Fourthly, the Raspberry PI 3 transmitter parameters were defined. This task was done using channel 1, the frequency is 2.41GHz and the transmission power is 8 dBm and the antenna 1.5 dBi. The parameters of the WIFI module BCM43438 since both are from the same manufacture, Raspberry does not provide enough information about it.
- Finally, at this step the propagation can be computed.
Here, the tasks consist in verifying the radiated power. To do that the test involves measuring the power intensity receive in a notebook using a Raspberry Pi 3 as a transmitter. This process starts by taken measures at every certain distance by measuring the power intensity received in a laptop with a WiFi analyzer. Figure 3 shows the tests from 0.5 to 100 meters that were made to the Raspberry Pi 3. Table III shows the results of this task.
4. Experimental Results
The results of the comparison is presented in this section. To do that, the error between both IEEE standards were computed using MatLab. Figure 5 and Figure 6 show the expected result between the both IEEE standards, 802.11n and 802.11p respectively. In case of the simulation task it can be observed that at the same power transmission, the more distance increase, the more attenuated the signal is in the IEEE 802.11p. It should be clearly noticed that those differences are basically due to the fact that the 802.11p standards were developed for data quality while the 802.11n was designed for transmission speeds.
The results in Figure 7 have shown that for the practical results (data in blue) there is high attenuation (over 16%) compared with the simulations using the 802.11p and 802.11n standards. Since the vehicle-to-vehicle prototype system is taken into consideration to work with a low data rate, the proposed V2V prototype system is a promising strategy to deal with the problem of vehicle communication. Although there is a drawback of the proposed implementation of the V2V over the IEEE 802.11n standards, the problem of oversaturation on 2.4GHz band due to the presence of devices is compensated with the use of OFDM.
Fig 4. Experimental results using the IEEE standard 802.11p. If we compare with the next figure we see clearly that the 802.11p signal at the same power weakens more quickly
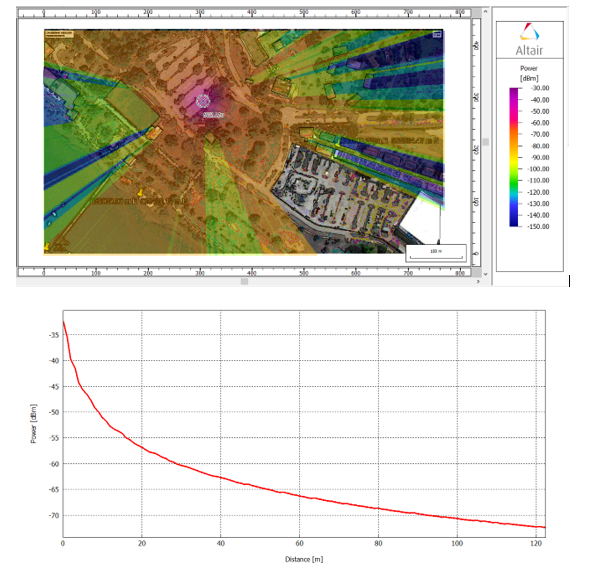 Figure 5. Experimental results using the IEEE standard 802.11n. In the Top right hand, we can see that there is the scale of color intensity according to the power in dBm. The height at which the propagation was simulated was about 1.3 meters. The region where colors are not visible is due to the existence of an installed metal fence about 4 meters high.
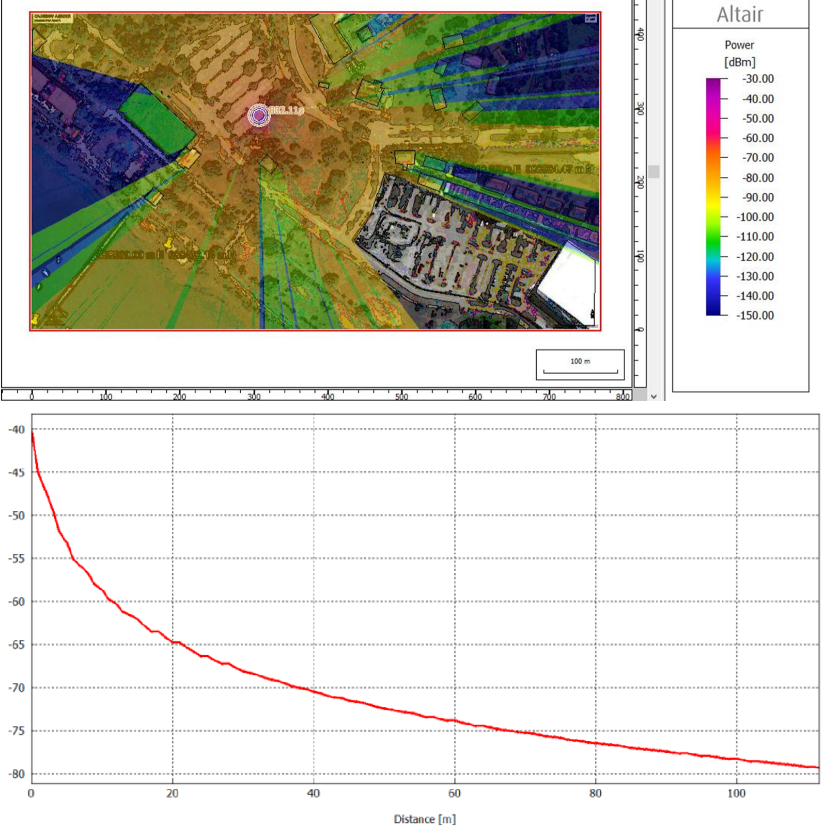 Figure 6. Experimental results using the IEEE standard 802.11p. If we compare with the previous figure we see clearly that the 802.11p signal at the same power weakens more quickly
At this point it is important to mention that the 802.11p standard uses a transmission power above 13 dBm but for comparative purposes between both standards we will place the power and gain parameters of the antenna at the same value. The 802.11p standard uses more power as it aims to cover from 300 meters to 1000 meters above all to compensate for the loss in urban spaces.
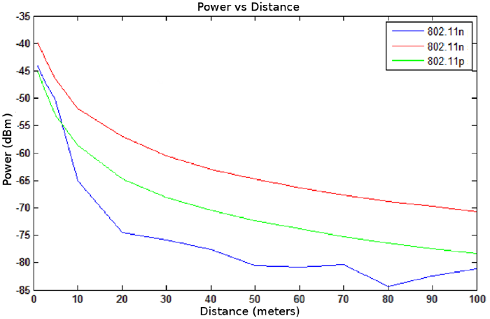 Figure 7. Experimental results using the IEEE standard 802.11p. If we compare with the previous figure we see clearly that the 802.11p signal at the same power weakens more quickly
5. Implementation:
At present there are different types of vehicle control algorithms, we will limit ourselves to determining the collision time (TTC). The condition of collision can occur when the driver in front suddenly stops or slows downs when the driver behind is going too fast. This type of collisions represents 23% of the collisions that occur on the roads.
Figure 8 is an example of the type of collisions that can occur on the road. The vehicle A in an accident case suffered a rear collision, while the vehicle B a front collision.
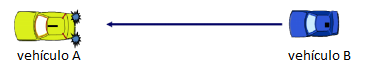 Figure 8. Vehicle A Vehicle B
- Microcontroller: For this task the Raspberry PI 3 reduced board computer with Linux Rasbian operating system and Python programming language will be used. This will be responsible for processing the information acquired, formatting, sending and receiving information through the network and finally send alarms or alerts to the driver about possible risks.
- Acquisition of data: This task will be performed by the serial receiver of the Global Positioning System (GPS) and the bluetooth reader of the vehicular diagnostic port (OBD II) that will allow us to access the vehicle’s data bus (CAN Bus).
- Wireless communication: The communication will be made using the 802.11n module integrated in the Raspberry Pi 3 in the 2.4GHz band. The network topology will be Ad-Hoc.
- Alerts: the alert system will be used to indicate the distance and time of collision and if the event is a rear or front collision.
Figure 9 details the components to be used in the development of our prototype and the way in which everyone interacts and communicates with each other:
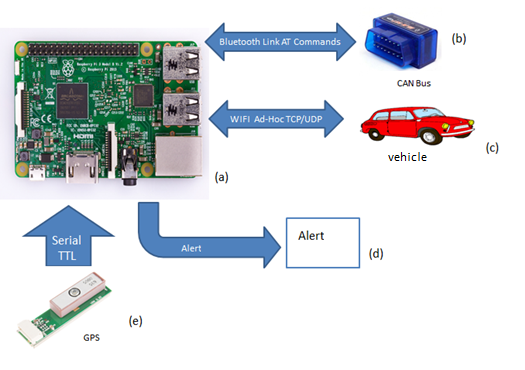 Figure 9. V2V prototype
In order to calculate and predict the collision is important to know each of the factors involves that may cause failure to our algorithm.
Latency due to the transmission of data, acquisition times and information processing are factors of vital relevance for our algorithm since when the data is received it has been some time since it was captured. Table IV of times involved to be considered in the calculation of collision time.
Table IV Latency Times
| Tiempo de latencia a considerar. |
| T0: Time when the vehicle data is available in the electronic systems of the vehicle. |
| T1: Data capture of CAN bus and time at which the GPS position information is updated. This is the real time the event was detected, and it will be the information that will be sent |
| T2: Time taken by the message to be processed and sent to the wireless network |
| T3: Time in which the message is received in the access layer (antenna level) in the receiver. |
| T4: Time the decoding of the received message data and it is ready for processing |
| T5: Time in which the processing of the received data is completed. The application can request a driver action, if applicable. |
| T6: Time is that it takes the information processed in giving an alert the driver either sonorously or visually |
With these 6 times involved we can easily predict the trajectory of the vehicles involved in a possible collision. Figure 10 below shows how the information flows between the vehicles involved in a possible collision
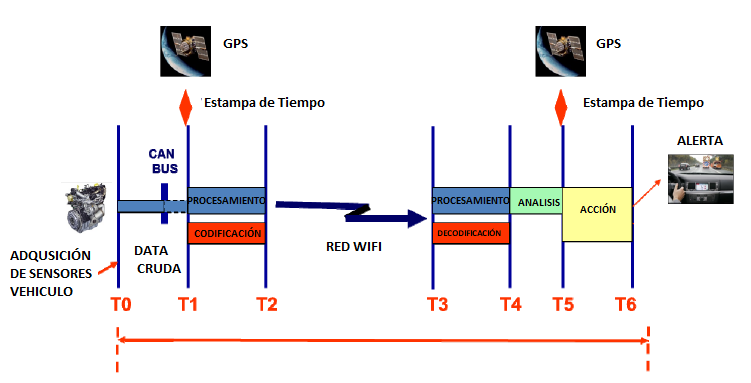 Figure 10. Processing time.
6. Experimental Results V2V communication
In order to verify the results of systems already in operation, the equipment was installed in two vehicles. Figure 11 and Figure 12 show the result of the GPS positions of the X-Trail vehicle and the data received from the Kicks vehicle.
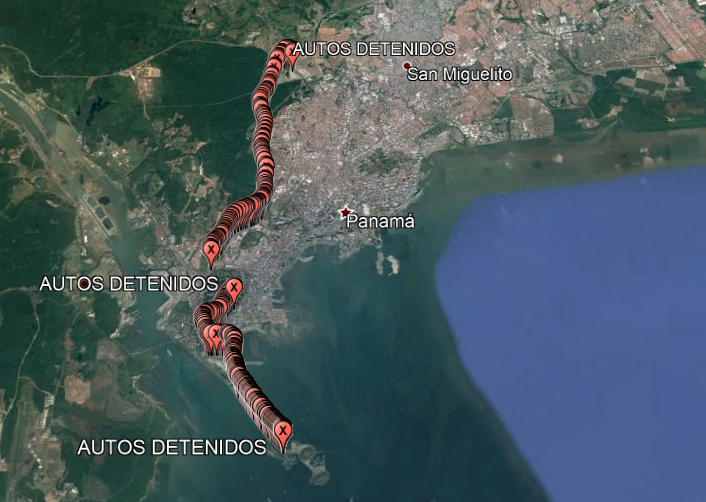 Figure 11. GPS track of prototype installed in Nissan Kicks
 Figure 12. GPs track of prototype installed in Nissan Kicks received by Nissan X-trail
Based on the results obtained, we passed the data acquired by a Kalman filter to determine the accuracy of the GPS positions of the path used. Figure 13 and Figure 14 below show the real data in red and the result of the prediction using the Kalman filter.
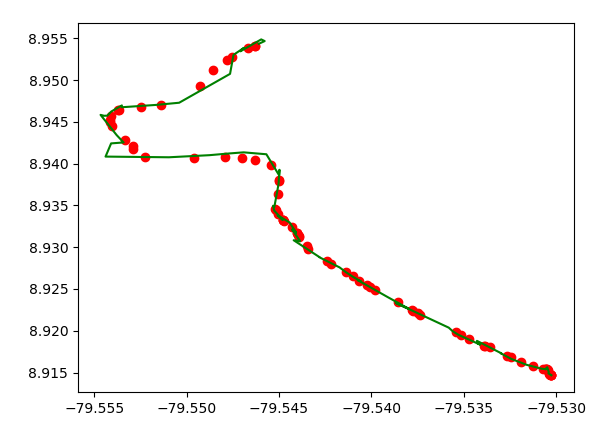 Figure 13. First track
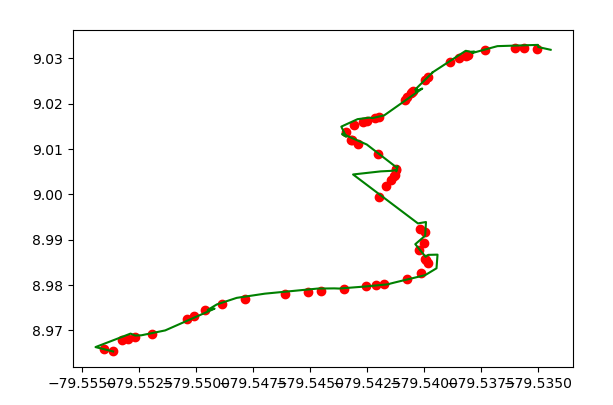 Figure 14. Second Track
We proceed do a statistical analysis of the results obtained for each of the tracks. These results are shown below in the table
Table V. First track statistical results
| Data | Result |
| Average absolute error of latitude | 6.36607E-05 % |
| Average absolute error of the length | 53.2094E-05 % |
| Correlation coefficient of latitude | 0.999 |
| Coefficient of correlation of length | 0.997 |
Table VI. Second track statistical results
| Data | Result |
| Average absolute error of latitude | 6.36607E-05 % |
| Average absolute error of the length | 53.2094E-05 % |
| Correlation coefficient of latitude | 0.999 |
| Coefficient of correlation of length | 0.997 |
From the previous figure and the statistical analysis, we can realize that where there is loss of data or information for the Kalman filter it is difficult to make an accurate prediction especially if this path involves curves.
TABLE VII. Summary of the changes/additions made to the extended version.
Applications: Including the final implementation we were looking for with the 802.11n propagation study
Graphical material: Including simulation graphics of the propagation environment, graphs of actual tests of the V2V communication system designed, Kalman filter path graphs
Tables: including table of the statistical results of the V2V system designed
Motivation: The main motivation to study the propagation of 802.11n was to design a low-cost vehicular communication system
- Context: Added more information related with the implementation.
- Conclusions: Added conclusion related use 802.11n in vehicular environments
- Introduction: Additional information related with the final implementation.
Acknowledgment
The authors would like to thank the National Bureau of Science, Technology and Innovation of Panamá (SENACYT) and the Sistema Nacional de Investigación (SNI) of Panama (SNI 168-2017, SNI 153-2017).
In both analytical and simulation results, the IEEE 802.11n standards achieved a good performance of propagation studies than the IEEE 802.11p standard. Future analysis of the proposed systems will be focused on the effects of the weather conditions.
- Y. R. Hidayanti, N.A. Siswandari, and O. Puspitorini. N. Sneddon, “An analysis of simulation-based vehicle to vehicle (V2V) communication system in main street of Surabaya,” In 2015 International Electronics Symposium. Indonesia, pp. 183–188.
- R. I. Meneguette, and A. Boukerche, “Peer to peer protocol for allocated resources in vehicular cloud based on V2V communication”, In 2007 IEEE Wireless Communications and Networking Conference. Spain, pp. 1–6.
- M. Cheong, Y. Lee, W. Park, and I. Yeom, “Analysis of V2V communication for ADAS,” IN 2017 Ninth International Conference on Ubiquitous and Future Networks. Czech Republic, pp. 248-246.
- Z. H. Mir and F. Filali, “Simulation and perfomance evaluation of vehicle-to-vehicle (V2V) propagation model in urban environment,” In 2016 7th International Conference on Intelligent Systems, Modelling and Simulation. Thailand, pp. 394-399.
- B. U. Rani, and S. Tarannum, “ A channel modelling considering varied environmental model for dsrc based V2V application services,” In 2016 International Conference on Devices, Circuits and Systems. India, pp. 48-53.
- L. Chen, B. E. Henty, F. Bai, and D. D. Stancil, “Highway and rural propagation channel modeling for vehicle-to-vehicle communications at 5.9 Ghz,” In 2008 IEEE Antennas and Propagation Society International Symposium. United States, pp. 1-4.
- T. Abbas, J. Nuckelt, T. Kaijrner, T. Zemen, C.F. Mecklenbrauker, and F. Tufvesson, “Simulation and measurement-based vehicle-to-vehicle channel characterization: accuracy and constraint analysis,” IEEE Transactions on Antennas and Propagation, 63(7), pp. 3208-3218, July 2015.
- F. Lassabe, P. Canalda, P. Chatonnay, F. Spies, and O. Baala, “A Friss-based calibrated model for wifi terminals positioning,” In IEEE International Symposium on a World of Wireless Mobile and Multimedia Networks. Italy, pp. 382-387.
- V. Khairnar, and K. Kotecha, “Propagation models for V2V communication,” In Vehicular ad-hoc Networks, 61, pp. 686-695, January, 2014.
- T. Islam, Y. Hu, E. Onur, B. Boltjes, and J. F. C. M. de Jongh, “Realistic simulation of IEEE 802.11 p channel in mobile vehicle to vehicle communication,” In 2013 Conference on Microwave Techniques. Czech Republic, pp. 156-161.
- FCC ID, “FCC ID 2ABCB-RPI3BP”. [Online]. https://fccid.io/2ABCB-RPI3BP
- GlobalMaterial-Catalogue.mcb. https://connect.altair.com/ [Accessed: 29- May- 2018].
- E. Murillo, D. Caceres, H. Poveda, K. Jo, “Evaluation of IEEE 802.11n and IEEE 802.11p based on Vehicle to Vehicle Communications,” In International Conference on Human System Interaction (HIS), 2018.