Effects of The Low-Resolution 3D Video Clip on Cerebrum Blood Flow Dynamics

Adv. Sci. Technol. Eng. Syst. J. 4(2), 380–386 (2019);
 DOI: 10.25046/aj040247
We have already succeeded in findings that stereoscopic video clips enhance brain activity. We herein increase the knowledge about the influence of 3D and blurred images on the human body, especially on brain activity. From of old, it has been pointed out that the motion sickness is induced by the blurred images. In this study, stabilogram and cerebral blood flow are measured to investigate the process in the brain during the 3D sickness. Activity in the ventral and dorsal streams is enhanced. The most suitable cutoff frequency for viewing the effects of the dorsal stream are estimated between 0.1–0.3 Hz in a Fourier-Shuffle surrogate data analysis of the cerebral blood flow.
1. Introduction
In recent years, various three-dimensional (3D) video display systems have been developed. Generally, they require 3D glasses, but some recent displays can present binocular and multiaspect autostereoscopic images. However, in either case, there are issues: (1) unpleasant symptoms such as headaches, vomiting, and eyestrain, (2) and a lack of ambience and realism. Especially with Japanese 3D televisions, binocular disparity is set to 1º or less; therefore, dynamic movements cannot be fully expressed. The reason for the eyestrain induced by 3D video viewing is not fully known yet; thus, without an appropriate manufacturing standard for 3D videos and their display systems, excessive measures against visually induced motion sickness (VIMS) have been implemented.
With natural vision, accommodation and vergence are consistent. However, it is generally understood that in 3D video viewing, while the lens is accommodated to the position of the screen that displays the image, the eyes converge at the position of the 3D object (a common reason for eyestrain during 3D image viewing). This discrepancy between the accommodation and vergence is considered to be the reason for the eyestrain from 3D viewing and visually induced motion sickness [1–4].
We can easily view stereoscopic video clips in daily life; however, it has been reported that symptoms such as headaches, nausea, dizziness, and vomiting occurred from VIMS [5]. It is said that the abovementioned symptom is induced by the vestibulo-vegetative reflex [6]. The vestibulo-vegetative system is closely accompanied by the vestibular nuclei, which is also involved in body balance. Compensatory movements in this equilibrium function are controlled by the vestibule-spinal reflex and the vestibule-ocular reflex. In these, the outputs from the vestibular nuclei are projected to the antigravitational muscles and the extraocular muscle, respectively. Therefore, body sway is affected by motion sickness, although there are some processes that control the antigravitational muscles through other nervous pathways (see [7]).
According to Patterson [8], if the viewing conditions are sufficiently bright, the depth of field of a target has a mean difference on the order of 1.0 D (diopter), and the accommodation-vergence conflict discussed above is a problem unique to proximity displays. Factors associated with the depth of field are the pupil diameter and resolution, and viewing conditions of images influence the pupil diameter. Most previous studies used a deep depth of field to prevent blurriness, resulting in a measurement environment quite different from that of everyday life.
Moreover, distribution of the vergence fusional stereoscopic limits in stereoscopic images is desired [9]. Eighty-four percent of all subjects could see a stereoscopic image of two planar images with a binocular disparity of 2º. The target under such a condition is a single target without a surrounding image. When there is no other parallax image, an accommodation-vergence process that creates an image from a double image is considered to function as a positive feedback system [10].
With developments such as the miniaturization of diagnostic equipment, brain science is developing rapidly, and a variety of brain activities are being defined [11]. Brain functional imaging using near-infrared spectroscopy (NIRS) has been developed of late years [12]. This technique is known to be a noninvasive measurement of brain activity, which utilizes the property of a hemoglobin which absorbs near infrared light, detecting the time course of the overall reactivity to activation of the cerebral cortex in subjects in a natural state [13–17]. Applying this to surfaces on the brain, we can observe changes in cerebral blood flow (CBF) within a 2–3 cm depth from the scalp, and recorded polygraph as time series data.
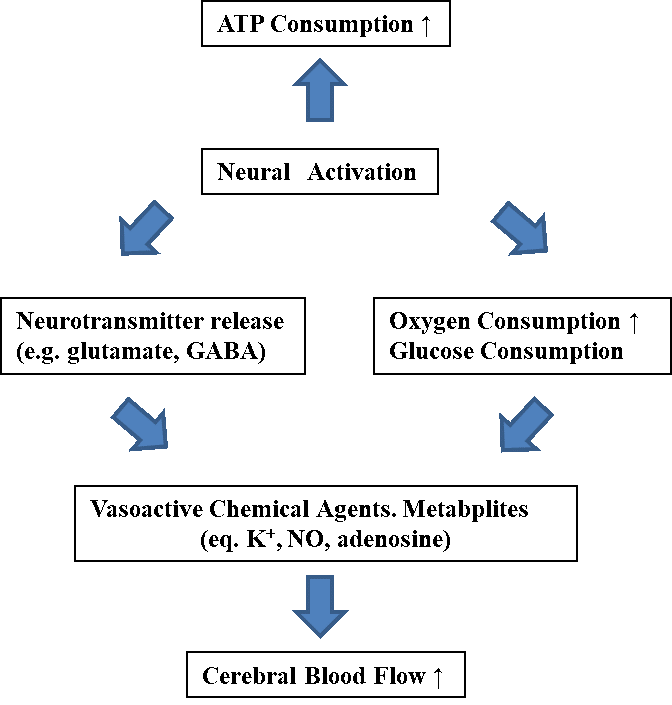 Figure 1: Physiological structure of neurovascular coupling.
The impacts of viewing 3D images on equilibrium function and brain activities were investigated in order to elucidate the cause for 3D sickness, which is induced during the peripheral vision more readily. Potential changes in brain activity can be measured by using fNIRS. Here, peripheral vision for the entire screen was compared to tracking a target while viewing 3D images [18] in accordance with neurovascular coupling (See Figure 1), which was known to be the relationship between subsequent changes in the CBF and local neural activity [19]. Tight temporal and amplitudinal linkages have been observed between the CBF supply and demand of the neuronal activity for over a century [20–22]. According to previous studies [23–25], the regional blood flow is likely controlled by multiple mechanisms such as the feedforward involving neural signaling via neurotransmitters.
In this study, we investigated effects of 3D video clips on human body. In this experiment, we recorded a stabilogram from which the severity of the VIMS could be estimated. The brain function, especially in the hemodynamics in the CBF, was also measured.
2. Material and Method
Biometric data were obtained for the center of pressure (CoP), heart rate variability, and hemodynamics on the surface of the cerebrum in 11 healthy young individuals (mean ± standard deviation: 22.6 ± 1.0 years) with no abnormalities in the extremities and no past medical history of ear or nervous system disease. Moreover, the visual acuity of subjects with the naked eye and/or contact lenses had to be greater than 0.8 and capable of stereoscopic vision. This experiment was fully explained to the subjects beforehand, and written consent was obtained. The experiment was approved by the Ethics Committee of the Department of Human and Artificial Intelligent Systems in the Graduate School of the Engineering University of Fukui (No. H2018010-11).
In this study, subjects wore a head-mounted display (HMD) GOOVIS G2 (Lets-co.jp, Nagoya), and the following video clips (VCs) were projected to the HMD:
VC1) stereoscopic video clip with a resolution of 1080p
VC2) stereoscopic video clip with a resolution of 360p
A resolution of 1080p (1920 × 1080 px; also known as Full HD (high definition video) or FHD (full high definition 2K) and BT.709 (broadcasting service television 709)) is a set of HDTV (high-definition television) high-definition video modes characterized by 1,920 pixels displayed across the screen horizontally and 1,080 pixels down the screen vertically. The p stands for progressive scan, i.e. noninterlaced [26]. Contents using as visual stimuli in this experiment was supplied by Sky Crystal (Olympus Memory Works Ltd. Co., Tokyo), which was modified with the company’s permission. A sphere in a video clip was ambulated in a complex manner.
Biometric data such as the stabilogram, electrocardiogram (ECG), and oxy-/deoxygenated hemoglobin concentrations on the CBF were recorded while the participant viewed high-resolution video clip VC1 and low-resolution video clip VC2. At a sampling frequency of 100 Hz, each sway of the CoP was recorded by using a Wii balance board (Nintendo, Kyoto). Subjects were instructed to maintain the Romberg posture during the duration of the trials. The subjects were asked to use peripheral vision for VC1 for the first 60 s and VC2 for the next 60 s, and to stand when there were no images (resting state). This trial was repeated five times (Figure 2).
In addition to the electrocardiogram (ECG), the CBF on was recorded on the surface of the frontal lobe (1–12 ch), on that of left temporal lobe (13–24 ch), on that of the right temporal lobe (25–36 ch), and on that of the occipital lobe (37–48 ch) in accordance with the fNIRS; channels in the prove of the FOIRE-3000 (Shimadzu, Kyoto) were arranged as shown in Figure 3. Our previous study gave a description of the position where the probe cap was attached in detail [27, 28]. Observing cross-section MRI shots in the brain, we have also confirmed the field on which the CBF changes [29]. Time series data of the CBF were smoothed by the low-pass filtering whose cutoff frequency was set to be 0.15 Hz.
 Figure 2: Experimental protocol.
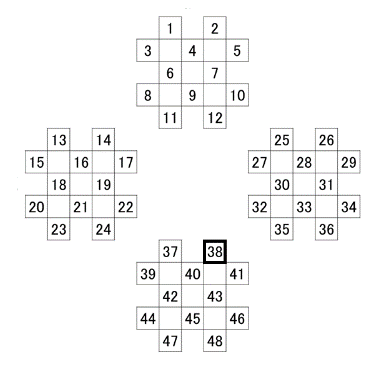 Figure 3: NIRS measurement channel layout.
3. Results
Sway values such as the area of sway, total locus length, total locus length per unit area, and sparse density [30,31] were estimated from the stabilograms (Figures 4–5). By using the Wilcoxon signed-rank test, we compared the sway values while viewing the VCs for a trial as follows. The statistical significance was herein set to be 0.05.
There was no statistical significance in the difference between the sway values while viewing the VCs during the trials except for the total locus (Figure 6b). In the third trial, the total locus length per unit area while viewing VC1 tended to be different from that while viewing VC2 (p < 0.1).

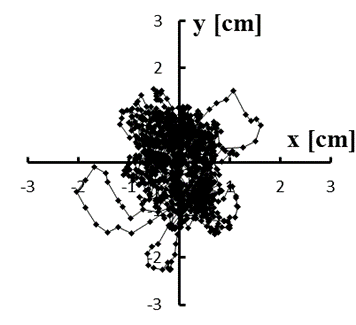
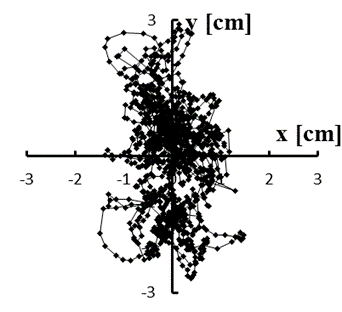

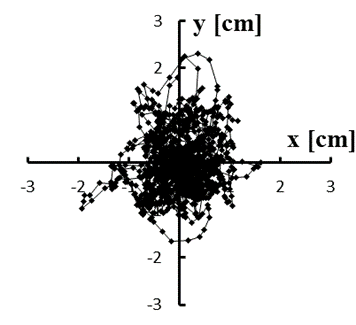 Figure 4: (a–e) Typical stabilograms while viewing VC1 for first to fifth trials, respectively
The oxygenated hemoglobin concentration in the CBF recorded while viewing VC2 was compared to that while viewing VC1. Significant changes were observed in the frontal lobe, temporal lobe, and upper occipital lobe (Figure 7).
For area of sway, sparse density, and total locus length, the sway values for the n-th trial (n = 3, 4, 5) were significantly greater than those for the first trial while viewing VC1 (p < 0.05). In addition, all sway values for the n-th trial (n = 3, 4, 5) were significantly greater than those for the first trial while viewing VC2, as shown in Figure 6 (p < 0.05).
4. Discussion
In this study, we investigated effects of 3D video clips on the equilibrium function and the brain function, especially in the hemodynamics in the CBF. Video clips were projected on an HMD.
In this experiment, no statistical differences were observed between the sway values while viewing the high-resolution video clip (VC1) and those while viewing the low-resolution video clip (VC2). The VIMS did not result from differences between the resolutions in this study. In addition, there was a statistical significance between the sway values of the n-th trial and those of the first trial (n = 3, 4, 5) while viewing any video clip. The changes in the sway values were considered to be owing to acclimatization in the upright posture.
Time series data are prone to noise with measurement errors, and biological signals are no exception. Noise including in the biological signals should be removed. We have already conducted a study for a nonlinear analysis of the changes in the CBF using fNIRS in order to determine an appropriate cutoff frequency for the low-pass filtering of the CBF. In the experiment, subjects did not view stereoscopic VCs through the HMD but those on a liquid crystal display (LCD) through polarizing spectacles, following a test with subjects’ eyes closed (Cnt). The VCs were played back for 70 s in visual pursuit and for 70 s in the peripheral vision in succession, which were classified as the resting, the visual pursuit, and the peripheral vision terms. This protocol was repeated five times. Changes in the CBF were recorded in the measurements taken from 10 healthy persons that sat in a dark room. Sampling frequency and the arrangement of the probes were set to be same as shown in this study (Figure 3). Also, the study focused on the dorsal stream, which can be measured around the channel 38. Low-pass filters with some cutoff frequencies were applied to the original CBF for 38-ch, and the translation errorsere estimated using the Wayland algorithm [32]. We herein focused on the first set of results from each subject to compare among translation errors during the resting, the visual pursuit, and the peripheral vision terms Because the regularity of the changes in the CBF were indicated through the experiment. Using the Fourier shuffle surrogate data method, the nonlinearity of the results was also analyzed [33].
In each instance, the translation error peaked at cutoff frequencies of 0.3–0.5 Hz [34]. Statistically significant differences were noted between mathematical models of the raw data in the CBF and their surrogate sequences. In addition, statistically significant differences/tendencies were also observed between mathematical models of the surrogate data and the CBF time series smoothed by the low-pass filtering whose cutoff frequencies ≤ 1 Hz. We believed that the CBF data were affected by noises with high frequencies > 1Hz, owing to muscular activities in the extraocular muscles and physical artifacts.
The translation errors were compared according to the cutoff frequencies f0 (Figure 8). At f0 = 0.2 Hz, translation errors estimated in the visual pursuit and in the peripheral vision were significantly greater than those observed while the eyes were closed (Cnt). Hence, the visual effect is thought to lie in the 0.1–0.3 Hz band.
In order to evaluate the difference between raw data and surrogate data, a t-value was herein calculated at f0 = 0.2 Hz. The values were estimated as 6.77, 3.52, and 1.09 for the Cnt, the peripheral vision, and the visual pursuit, respectively. For the visual pursuit and peripheral vision, the t-value was reduced compared to the Cnt. Thus, it was difficult to observe the nonlinearity in the CBF while viewing stereoscopic video clips. Compared to that for the peripheral vision, the t-value was reduced for the visual pursuit. This is thought to be the effect of increased activity in the dorsal stream that governs subjects’ spatial awareness with respect to the object being viewed [35]. This manifested itself more strongly when viewing stereoscopic video clips. For this reason, it is thought that a low-pass filter with a cutoff frequency of approximately 0.2 Hz is suitable for observing the nonlinearity and changes in the CBF during the viewing of stereoscopic video clips.
Presently, we investigated effects of 3D video clips on the equilibrium function [27] and the CBF [28,34]. In the former, video clips were projected on the screen. The images were composed of a number of balls. A virtual evoked postural response (VEPR) was expected to be induced by their periodic motion with 0.25 Hz. Severity of the VIMS could be measured as a VEPR. We confirmed that the motion sickness was occurred while viewing 3D video clips. Based on the results of the stabilometry frequency analysis, we observed a reduction in the intensity of power spectral density for 0.25 Hz with the course of the noise amplitudes. The frequency seemed to be synchronized with the periodic motion of the balls in the video clips. In the latter, subjects viewed video clips on LCDs of the video game and the television, respectively. Except for the video game, subjects viewed video clips through shutter/polarizing spectacles in this paragraph.
We investigated the effects of 3D video clips on the brain function, especially in the hemodynamics in the CBF which was remarkably increased while viewing the stereoscopic video clip, compared to while viewing the 2D.
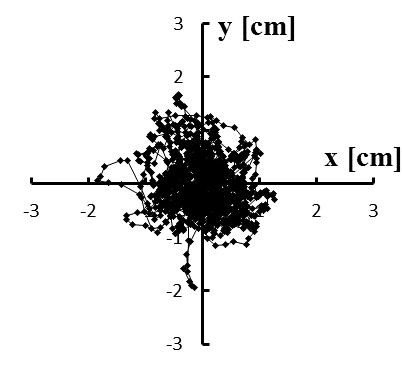
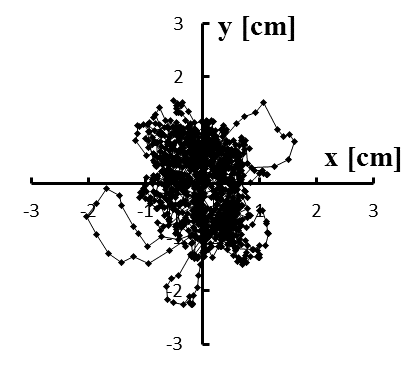
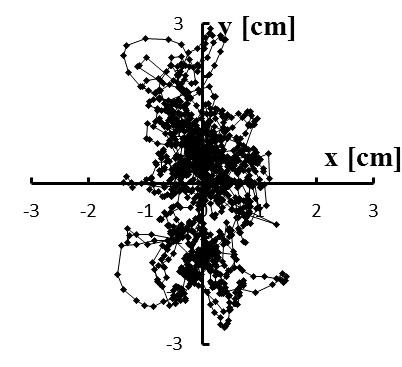
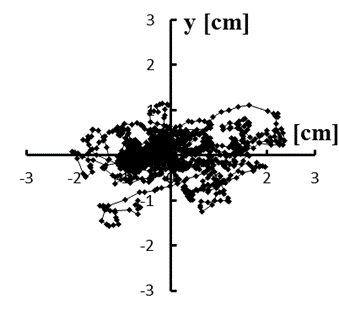
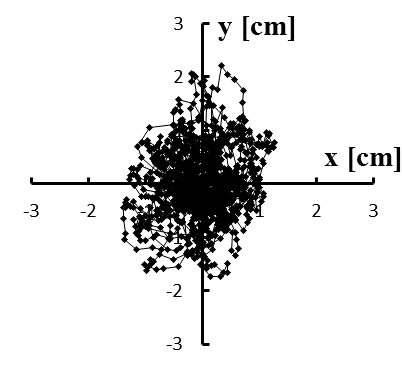 Figure 5: (a–e) Typical stabilograms while viewing VC2 for first to fifth trials, respectively
One question remains: compared with the impact of viewing 3D videos with peripheral vision on the balance system, the amount of sway during viewing is small. Presently, we have not directly captured the instability in the balance system during the peripheral viewing of 3D videos. Therefore, it would be meaningful to improve the measurement precision of the impact on the balance system through numerical models. Considering research ethics, as it would lessen the burden on the subjects, this would not be limited to the design evaluation analysis of ultrahigh-definition images and VR, but could also contribute to hygiene and biomedical engineering.
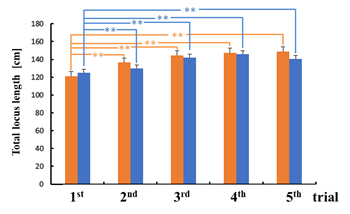
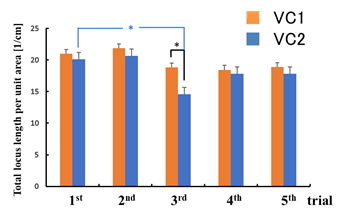 Figure 6: Comparison of sway values while viewing VCs for each trial: total locus length (a); total locus length per unit area (b).
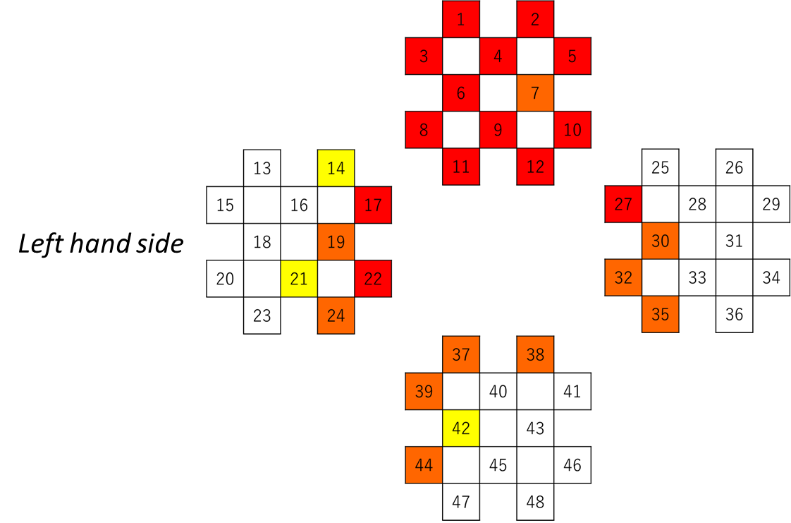 Figure 7: Changes in oxygenated hemoglobin concentration in the CBF recorded while viewing VC2 compared to that while viewing VC1: significant increase (p < 0.01 and p < 0.05) marked by ■ and ■, respectively; increase tendency (p < 0.1) marked by ■.
In this study, by continuing the research challenges described above, we verified the illusion of self-motion (vection) induced by 3D video viewing. As an application, we determined new research topics. Is vection induced by 3D video viewing caused selectively by peripheral vision? Does uncoordinated movement of central and peripheral vision cause vection, inducing visually induced motion sickness? We plan to elucidate these questions. By working on new research topics, we may be able to propose a guideline for the safe viewing of 3D videos.
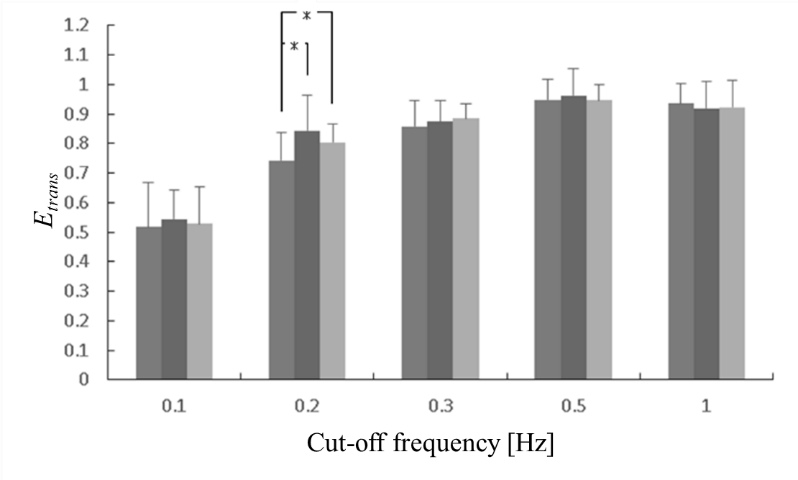 Figure 8: Comparison of translation errors estimated from CBF with eyes closed as control (Cnt) ■ with those of the visual pursuit ■, and of the peripheral vision ■.
According to the fNIRS measurement, as shown in Figure 7, significant changes were observed in the temporal lobe and upper occipital lobe that corresponded to the ventral and dorsal streams, respectively [35]. It is difficult to recognize the visual objects and motion processes owing to the low resolution of the video clip. Activity in the ventral and dorsal streams was enhanced, and theircooperativeness might be expected to be found in the next step.
The number of elderly people with dementia in Japan is estimated to reach approximately 7 million people by 2025. It is important to diagnose/respond dementia in early stage. Games for people with mild cognitive impairments (MCIs) has been developed in accordance with the previous. Epidemiologic research [36]; Untreated poor vision is associated with cognitive decline, particularly Alzheimer disease. It is important to take care the decline in the visual acuity. Protecting eyesight also keep our brain function. Their medical evaluations are now conducting, using fNIRS and electroencephalograms (EEG) [37-38]. The basic experiments will be also stated in detail for the virtual space and the video games in the next paper.
5. Conclusion
We focused on the visual consciousness and examined whether the hemodynamics in the CBF depend on the consciousness. Despite the consciousness, the CBF contains body artifacts owing to the cardiovascular system and extraocular muscles in accordance with a nonlinear analysis of the CBF filtered at cutoff frequencies >0.5 Hz. In other words, noise at high frequency (>0.5 Hz) exhibits regularity.
Conflict of Interest
The authors declare no conflict of interest.
Acknowledgment
This work was supported in part by the Takeuchi Scholarship Foundation and the Descente and Ishimoto Memorial Foundation for the Promotion of Sports Science; the Japan Society for the Promotion of Science, Grant-in-Aid for Scientific Research (C) Number 17K00715 and Young Scientists (B) Number 15H06711.
- F. M. Toates, “Vergence eye movements” Doc. Ophthalmol., 37, 153–214, 1974.
- C. Cruz-Neira, D. J. Sanding, T. A. DeFanti, “Virtual reality: The design and implementation of the CAVE,” in Proceedings of the 20th Annual Conference on Computer Graphics and Interactive Techniques, SIGGRAPH ’93, 135–142, 1993.
- D. M. Hoffman, A. R. Girshick, K. Akeley, M. S. Banks, “Vergence-accommodation conflicts hinder visual performance and cause visual fatigue” J. Vis., 8(3): 33.1–30, 2018. doi: 10.1167/8.3.33
- T. Shibata, J. Kim, D. M. Hoffman, M. S. Banks, “The zone of comfort: Predicting visual discomfort with stereo displays” J. Vis., 11(8), 1–29, 2011.
- International Standard Organization, “IWA3:2005 Image safety-reducing determinism in a time series” Phys. Rev. Lett., 70, 530–582, 1993.
- K. R. Brizzee, “Mechanics of vomiting: A mini review” Can. J. Physiol. Pharmacol., 68: 221–229, 1990.
- H. Takada, M. Miyao, S. Fateh (eds.), Stereopsis and Hygiene, Springer Nature, 2018.
- R. Patterson, “Human factors of stereo displays: An update” J. SID, 17(12), 987–996, 2009.
- S. Nagata, “Distribution of vergence fusional stereoscopic limits (VFSL) of disparity in a stereoscopic display” TVRSJ, 7, 239–46, 2002 (in Japanese).
- S. Nagata, “The binocular fusion of human vision on stereoscopic displays: Field of view and environments” Ergonomics, 39(11), 1273–1284, 1996.
- A. M. Chiarelli, F. Zappasodi, F. Di Pompeo, A. Merla, “Simultaneous functional near-infrared spectroscopy and electroencephalography for monitoring of human brain activity and oxygenation” Neurophot., 4(4), 041411, 2017.
- M. Fukuda, M. Mikuni, “A study of near-infrared spectroscopy in depression” J. Clinical and Exp. Med., 219, 1057–1062, 2006.
- A. Zardecki, “Multiple scattering corrections to the Beer-Lambert Law” in Proc. SPIE, 103–110, 1983.
- S. Wray, M. Cope, D. T. Delpy, J.S. Wyatt, E. O. Reynolds, “Characterization of the near infrared absorption spectra of cytochrome AA 3 and hemoglobin for the non-invasive monitoring of cerebral oxygenation” Biochemica et Biophysica A., 933, 184–192, 1988.
- T. Kato, A. Kamei, S. Takashima, T. Ozaki, “Human visual cortical function during photic stimulation monitoring by means of near-infrared spectroscopy” J. Cereb. Blood Flow Metab., 13, 516–520, 1993.
- Y. Hoshi, M. Tamura, “Detection of dynamic changes in cerebral oxygenation coupled to neural function during mental work in man” Neurosci. Lett., 150, 5–8, 1993.
- C. E. Elwell, C. E. Cooper, M. Cope, D. T. Delpy, “Performance comparison of several published tissue near-infrared spectroscopy algorithms” Anal. Biochem., 227, 54 –68, 1995.
- M. Takada, Y. Fukui, Y. Matsuura, M. Sato, H. Takada, “Peripheral viewing during exposure to a 2D/3D video clip: Effects on the human body” Env. Health Prev. Med., 20, 79–89, 2015.
- A. A. Phillips, F. H. N. Chan, M. M. Z. Zheng, A. V. Krassioukov, P. N. Ainslie, “Neurovascular coupling in humans: Physiology, methodological advances and clinical implications” J. Cerebral Blood Flow & Metabol., 36, 647–664, 2016.
- F. C. Donders, “Die bewegungen des gehirns und die vera: Nderungen der gefa¨ssfu¨llung der pia mater” Schmid’s Fahrbucher., 69, 16–20, 1851.
- A. Mosso, “Sulla circolazione del cervello dell’uomo” Atti R Accad Lincei., 5, 237–358, 1880.
- C. S. Roy, C. S. Sherrington, “On the regulation of the blood-supply of the brain” J. Physiol., 11, 85–158, 1890.
- D. Attwell, C. Iadecola, “The neural basis of functional brain imaging signals” Trends in Neurosci., 25, 621–625, 2002.
- M. Lauritzen, “Reading vascular changes in brain imaging: Is dendritic calcium the key?” Nature Rev., 6, 77–85, 2005.
- K. Uludag, D. J. Dubowitz, E. J. Yoder, K. Restom, T. T. Liu, R. B. Buxton, “Coupling of cerebral blood flow and oxygen consumption during physiological activation and deactivation measured with fMRI” Neuro Im., 23, 148–155, 2004.
- R. Silva, “720p vs. 1080p: A comparison” Lifewire.com, 2018, last accessed 2016/11/21.
- M. Takada, K. Ito, T. Tanimura, H. Tahara, A. Sugiura, H. Takada, “The impact of 3D games on brain blood flow dynamics and its utilization” in 13th international conference on computer science and education (ICCSE), 828-833, 2018.
- M. Takada, Y. Mori, F. Kinoshita, H. Takada, “Changes in brain blood flow by the use of 2D/3D games” in Universal Accessin Human-Computer Interaction (UAHCI/HCII2016), PartII (eds. A. Margherita, S. Constantin) LNCS9738, 516-523, 2016.
- Y. Matuura, T. Taniguchi, A. Sugiura, M. Miyao, H. Takada, “Distribution of cerebral blood flow during gum-chewing” Forma, 27, 1-4, 2012.
- H. Takada, Y. Kitaoka, S., M. Miyao, “Physical meaning on geometrical index for stabilometry” Equil. Res., 62(3), 168–180, 2003.
- Japan Society for Equilibrium Research (ed.), “Standard of Stabilometry” Equil. Res., 42, 367–369, 1983.
- R. Wayland, D. Bromley, D. Pickett, A. Passamante, “Recognizing determinism in a time series”, Phys. Rev. Lett., 70, 580-582, 1993.
- J. Theiler, S. Eubank, A. Longtin, B. Galdrikian, J. D. Farmer, “Testing for nonlinearity in time series: The method of surrogate data” Physica D, 58, 77-94, 1992.
- T. Tanimura, D. Iida, Y. Jono, M. Takada, Y. Matsuura, H. Takada, “Nonlinear analysis using multiple cutoff frequencies for local cerebral blood flow during biofeedback training” JAMMR, 28(6), 1-12, 2018.
- L. G. Ungerleider, M. Mishkin, “Two cortical visual systems” in Analysis of visual behavior (ed. D. J. Ingle et al.), MIT Press, 1982.
- M. A. M. Rogers, K. M. Langa, “Untreated poor vision: A contributing factor to late-life dementia” Am. J. Epidemiol., 171(6), 728–735, 2010.
- G. R. Mendez, I. Dunwell1, E. A. M. Mirón, M. D. V. Cerdán, S. de Freitas, F. Liarokapis, A. R. G. Gaona, “Assessing NeuroSky’s usability to detect attention levels in an assessment exercise” in Human-Computer Interaction (UAHCI/HCII 2009), Part I (ed. J. A. Jacko), LNCS 5610, 149–158, 2009.
- S. J. Johnstone, S. Roodenrys, R. Blackman, E. Johnston, K. Loveday, S. Mantz, M. F. Barratt, “Neurocognitive training for children with and without AD/HD” ADHD Atten. Def. Hyp. Disord., 4, 11–23, 2012.