Multi-Objective Path Optimization of a Satellite for Multiple Active Space Debris Removal Based on a Method for the Travelling Serviceman Problem
Volume 3, Issue 6, Page No 479-488, 2018
Author’s Name: Masahiro Kanazaki1,a), Yusuke Yamada1, Masaki Nakamiya2
View Affiliations
1Division of Aerospace Engineering, Graduate School of System Design, Tokyo Metropolitan University, 190-0015, Japan
2Department of Aerospace Engineering, Teikyo University, 320-8551, Japan
a)Author to whom correspondence should be addressed. E-mail: kana@tmu.ac.jp
Adv. Sci. Technol. Eng. Syst. J. 3(6), 479-488 (2018); ![]() DOI: 10.25046/aj030656
DOI: 10.25046/aj030656
Keywords: Multiple Space Debris Removal, Trajectory Optimization, Travelling Serviceman Problem, Evolutionary Algorithm, Multi-objective Optimization
Export Citations
Space debris removal is currently a critical issue for space development. It has been reported that five pieces of debris should be removed each year to avoid further increase in the amount of debris in orbit. One approach for the removal of multiple pieces of debris is to launch multiple satellites that can each remove one target debris from orbit. The benefit of this approach is that the target debris can be removed without orbit transition, and thus, the satellite can be developed considering simple satellite mechanics. However, to realize this concept, multiple satellites need to be launched. Another approach is to use one satellite to remove multiple pieces of space debris. This approach can reduce the launch costs and achieve efficient removal of space debris. However, the satellite must change its orbit after the removal of each debris piece, and a technique for optimizing the orbit transition is required. In this study, the latter strategy and developed a satellite trajectory optimization method for efficient space debris removal were focused on. The similarity between the problem of multiple space debris removal and the travelling serviceman problem (TSP) were considered, and the TSP solution involving an evolutionary algorithm (EA) was applied. To improve the efficiency of multiple debris removal, the total radar cross-section (RCS), which indicates the amount of space debris, and the total thrust of the satellite was minimized. The TSP solution method was extended to multiple objectives by coupling it with a satellite trajectory simulation. To evaluate the developed method, a set of 100 pieces of space debris was selected from a database. The results indicated a trade-off between the total RCS and total thrust.
Received: 14 August 2018, Accepted: 12 December 2018, Published Online: 26 December 2018
1. Introduction
Parts of rockets, spent satellites, and tools left behind during space operations by astronauts continue to remain in orbit as space debris (”debris”) [1, 2, 3, 4]. Such debris pose a threat to satellites in operation, including the International Space Station as the debris components may collide with these satellites and cause critical damage. Furthermore, when the amount of debris exceeds a certain value, the involved parts may collide with each other, and further increase the amount of debris. This phenomenon is referred to as the ”Kessler syndrome”[5], and a theoretical model has residual fuel also increases the amount of debris. Thus, increasing debris is an urgent problem that needs to be solved in future space development, and active debris removal techniques are being studied[7, 8, 9]. To this end, several methods using removal satellites have been studied. For example, the use of extending conductive tethers that connect the removal satellite and a piece of debris, and then eliminate the debris by passing electric current in the Earth magnetic field and providing thrust to the debris by using the generated Lorentz force [7], has been widely investigated. Another possible approach is to attach thrusters to the debris pieces [9] to change their trajectory. Such methods require the satellite to be powered to rendezvous with the debris; therefore, efficient mission scenarios are required.
From the viewpoint of cost-effectiveness, it is desirable to eliminate multiple debris with a removal satellite. In addition to the technology of the removal satellites, the optimization of the order in which debris is collected and/or captured and disposed should be considered. Although the optimization of the meeting order can be achieved by considering general combination optimization problems such as the travelling salesman problem (TSP), the debris moves noncooperatively towards the dumping satellite in this multiple debris removal problem. Therefore, it is also necessary to investigate the applicability of the TSP solution. In an actual dumping mission, there are multiple objectives such as maximizing the total size of debris to be discarded while minimizing the total amount of energy required for the removal satellite to change its trajectory. In particular, it is predicted that the sum of the sizes of debris represented by the radar cross-section (RCS) and the sum of the trajectory-changing energies associated with each debris are contradictory.
Therefore, in this research, a general methodology for the TSP expanded as a multi-objective problem was applied to the path optimization problem of satellites for active debris removal to eliminate a plurality of debris. The data of 100 observed debris was taken as an example; solve the multi-objective problem by changing the number of target debris to 2, 3, 4, and 5; and determine the trend of the optimum path.
2. Related Study
2.1. Researches on Active Space Debris Removal
In 2017, there were 15,000 pieces of space debris with a size of 10 cm or more. The number of debris pieces is expected to exceed 28,000 in 2116 and more than 65,000 in 2210. However, assuming that five pieces of debris can be removed annually from 2020, the number of debris in 2116 can be reduced to approximately 20,000; if 20 pieces can be removed, this number can be reduced to approximately 16,000, according to the prediction reported in [10]. Although this suggests that multiple debris removal techniques are required, it is expensive to launch and operate multiple removal satellites. Thus, an active debris removal technique using only one satellite operating with path optimization is required.
Conceptual research on multiple debris removal considering cost reduction was carried out at the NASA Goddard Space Flight Center [11]. Conductive tether satellites were adopted in this exercise, and the effectiveness of removal of the assumed 50 pieces of debris was discussed. The optimum trajectory was calculated, and the weight of the removed debris was evaluated by an estimation formula. The examination was conducted using the TSP solution method. In this study, several case studies focusing on the number of removed debris were examined; however, the required thrust for the removal satellite was not considered in the optimization process and only a single objective was considered.
2.2. Solutions for TSP and TSP-like Problems
The TSP [12], which is a combinatorial optimization problem, is known as a non-deterministic polynomial (NP) problem. To solve the TSP, heuristic methods have been shown to be effective. The problem involves obtaining the shortest travelling distance for a salesman, when the salesman is expected to visit all distributed cities, as shown in Fig. 1. Here, the distance of the path between cities i is di. The TSP is one of the most popular problems and an example of evolutionary calculation.
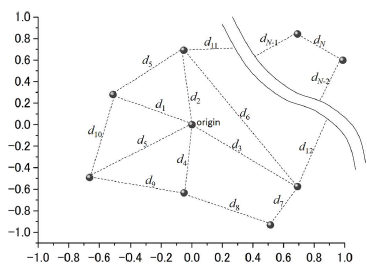 Figure 1: Example of travelling points and routes for the TSP.
A problem similar to the TSP is the ”Kyoto Tourism Problem.” [13]. When visiting and sightseeing in the city of Kyoto, satisfaction and travel expenses are the factors considered by travelers. The TSP solution method that introduces the concept of the Pareto optimum for the multi-objective problem was applied. In this method, a reciprocal relationship exists between the objectives, and a plan must be proposed based on the travel budget of each traveler.
Another application of the TSP is to reduce a driver’s burden and shorten the route for pick up and transfer in consideration of customers and road conditions, which change dynamically [14]. While simulating road conditions and the movement of the customers simultaneously, researchers solved the problem using the evolutionary method. It can be said that this problem is similar to the path optimization problem for active debris removal satellites. However, in reality, it should be noted that debris are uncontrollable and non-cooperative objects, while customers exhibit cooperative behavior through communication and self-judgement.
3. Trajectory Optimization for a Multiple Space Debris Removal Satellite
In this research, a plurality of debris is effectively removed by ”maximizing the sum total of the RCS of the debris to be removed(RCStot) and minimizing the sum of the acceleration to move to the ith debris” (∆Vtot which is the amount of ∆Vi for transition).
The debris travels around different orbits (including altitude); thus, it is necessary to increase the speed to meet the orbit in orbit. It is also necessary to minimize the increase in speed to decrease fuel consumption. This problem can be written as follows.
 Assuming that Ndebri pieces of the debris are removed, RCStot can be expressed as follows:
 ∆Vtot can be written as the summation of the velocity increment ∆Vi for each debris i:
 ∆Vi is obtained by solving Lambert’s problem [15], which is described in the following subsection.
3.1. Lambert’s Problem for Trajectory Evaluation
In this research, the Lambert problem [15] in orbital dynamics was solved to evaluate the path of the removal satellite. This can be rephrased as a problem in which the spacecraft achieves the necessary speed in the orbit to travel from a certain point P to another point Q. The Lambert equation can be expressed as
 where ∆t is the duration of time, a is the semi-major axis, µ is a gravitational parameter, k is the number of revolutions, E is an eccentric anomaly, and e is the orbital eccentricity. ∆Vi is obtained from the target debris position after ∆t, the initial position of the debris removal satellite, and ∆t is obtained by the expression 4. Figure 2 shows an example of the solution of the Lambert problem translating the trajectory of the removal satellite with respect to the debris.
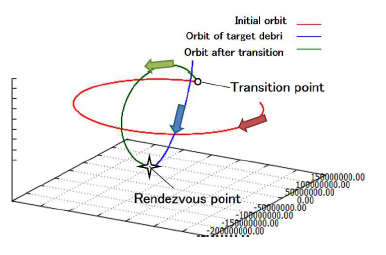 Figure 2: Example of trajectory calculation when the removal satellite heads to the rendezvous point with the debris with one orbit change. Red denotes the original trajectory of the dumped satellite, green denotes the trajectory after the transition, and blue denotes the trajectory of the debris.
4. Combinatorial Optimization and Expansion to Multiobjective Problem
In this research, the TSP solution methods using a genetic algorithm was applied to the path optimization problem of space debris removal satellites. The following typical algorithm was firstly developed to solve TSP.
- As shown in Fig. 1, it was assumed that all the cities are represented by coordinate points on the plane and N intercity routes are defined.
- A salesman does not visit the same city more than once.
The total travelling distance dtot in Fig. 1 can be written as
 4.1. Genetic Operators
4.1.1 Representation of the Combination of the Traveling Path
Path representation (PR) is applied. For example, if the number of visited points is nine, then the order in which the points are visited can be represented as follows::
| a | c | b | g | h | i | d | f | e |. (6)
4.1.2 Selection
A roulette selection is applied to select individuals for the crossover and mutation operations. In the roulette selection, the selection probability pi can be based on fitness fi from Npop:
 4.1.3 Crossover
Order crossover (OX) [12] is applied to two selected individuals. In OX, the individuals p1 and p2 are selected first:
p1 = | a | b | c | d | e | f | g | h | i | p2 = | d | a | b | h | g | f | i | c | e |. (8)
Then, the parts of the gene sequence that are copied to children c1 and c2 are selected from p1 and p2, respectively. An example is shown in Eq. 9. Here, fourth– seventh genes are copied in that order to the children, and the rest of the genes —which are temporarily represented by | ∗ |— are undecided gene sequence parts to be determined by a crossover:
c1 = | ∗ | ∗ | ∗ | d | e | f | g | ∗ | ∗ | c2 = | ∗ | ∗ | ∗ | h | g | f | i | ∗ | ∗ |. (9)
To determine the genes temporarily represented by | ∗ | of c1, the following gene sequence of p2 that corresponds to the undecided gene sequence part of c1 is copied. The sequential order of this gene sequence remains in the clockwise direction:
p2b = | c | e | d | a | b | h | g | f | i |. (10)
Here, the gene sequence part that has already been copied from p1 to c1 is removed from p2b:
| p2c = | e | d | b | h | i |.
c1 can be determined by inserting p2c: |
(11) |
| c1 = | b | h | i | d | e | f | g | e | d |.
c2 can be determined in the same way: |
(12) |
| c2 = | a | b | c | h | g | f | i | d | e |. | (13) |
4.1.4 Mutation
Mutation is used to maintain population diversity, creating individuals with genetic information that cannot be generated only by a crossover. In this research, an inversion mutation that exchanges the genetic information at a position determined by a random number is used. In the inversion method, when p1 shown in Eq. 8 is chosen as a mutation target, two genes are arbitrarily selected and the positions are exchanged as follows.
c1 = | a | b | e | d | c | f | g | h | i |. (14)
In this example, the third and fifth genes of p1 are exchanged to create c1.
3.2. Investigation of the Developed Method with the Typical TSP
As a verification method, a typical TSP (minimizing the total path distance) was solved with 10 randomly distributed cities and the departure point of a salesman. Eight-hundred generations were executed by setting 100 individuals for each generation. It is assumed that the route between the cities is given by a Euclidean distance and the salesman returns to the starting point.
Figure 4 shows the history of the solution (total route distance) obtained by the method outlined in the previous section. From this figure, the total path distance decreases with each generation and converges at approximately 300 generations. An example of the best individual route obtained for each generation is shown in Fig. 1. Figure 4(a), which is the initial generation, has a waste route. Whereas, in Fig. 1(b)-(d), it can be seen that several paths considered to be efficient are being searched. In particular, Fig. 1(c) and (d) show almost the same evaluation value, but the routes are different. This shows that various solutions can be obtained in the design variable space. In this research as well, designers can select the route according to the mission requirements and constraints using the information on the optimum route for the debris removal satellite.
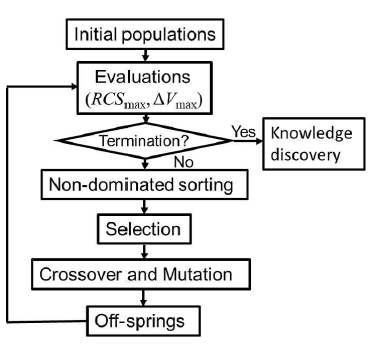 Figure 3: Procedure of multi-objective trajectory optimization of a satellite for multiple active space debris removal.
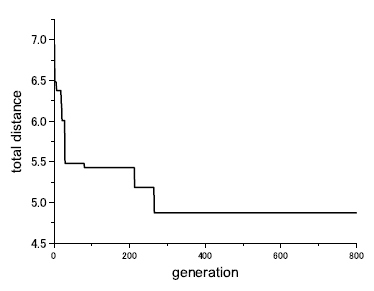 Figure 4: Convergence history of solutions with the developed algorithm
3.3. Non-dominated Sorting for MoPs
The final goal of this research is multi-objective optimization of the orbits of multiple debris removal satellites. For multi-objective optimization, ranking is performed by non-dominated sorting (Fig. 6), which was introduced in the Non-dominated Sorting Genetic Algorithm-II [16]. An elite strategy was adopted to archive good solutions and take over to the next generation without genetic operations such as crossover or mutation.
3.4. Scatter Plot Matrix (SPM)
The solution and design space of the multi-variable design problem obtained by MOEA are observed using SPM [17], which is one of the data mining methods. SPM arranges two-dimensional scatter plots such as a matrix among the objective functions and design variables and facilitates the investigation of the design problem. Each of the rows and columns is assigned attribute values such as design variables, objective functions, and constraint values. The diagonal elements show the same plots. Therefore, it can be said that the SPM shows scatter plots on the upper triangular part of the matrix and the correlation coefficients on the lower triangular part as additional information. modeFrontier™4.2.2 was employed in this study.
4. Results for the Trajectory Optimization of the Multiple Active Space Debris Removal Satellite
In this research, debris data obtained when China destroyed the satellite ”Fengyun-1C” in an experiment for the development of an anti-satellite weapon method in 2007 [6] was used. In this experiment, the over 2800 pieces of satellite debris were obtained debris, which is the highest number to date.
 Figure 5: Selected solutions: (a) initial generation, (b)100th generation, (c)400th generation, and (d) 800th generation
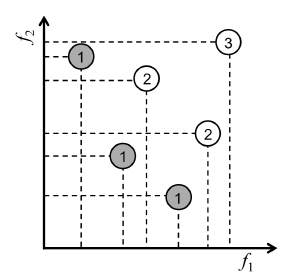 Figure 6: Ranking by the non-dominated sorting algorithm.
The orbital altitude of this debris cloud is located at a high altitude of 800 km; hence, the suspension time is long and is expected to have a negative impact/influence in the long term. Because each piece of debris was tracked from the start, 100 individual debris data which were randomly selected from the catalogue (data table) was used. The frequency distribution of the RCS considered in this research is shown in Fig. 7. RCSi is based on the observation data published by the North American Aerospace Defence Command.
For optimization, the multi-objective problem shown in the expression 1 in the section 3 was solved. To obtain information on removal efficiency, four cases in which the number of debris to be removed was changed to 2, 3, 4, and 5 were solved. It is assumed that the removal satellite has been in a parking orbit at an altitude of 200 km and departed at 0 o’clock on January 1, 2015. Upon reaching each debris, the satellite conducts a removal operation for 1 h and remains stationary in that orbit until it has to depart for the next debris. Evolutionary calculation was carried out with 100 individuals per generation and 2000 generations were executed.
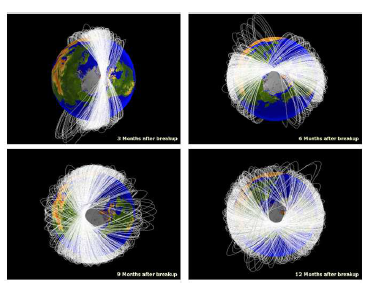 Figure 7: Three months of tracking data for space debris from the satellite destruction test of Fengyun-1C [6].
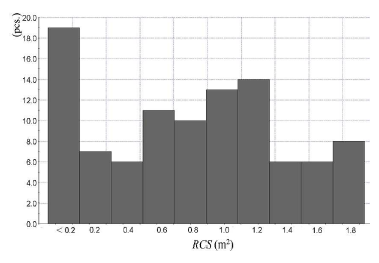 Figure 8: Frequency distribution of the RCS for 100 pieces of debris that were candidates for removal.
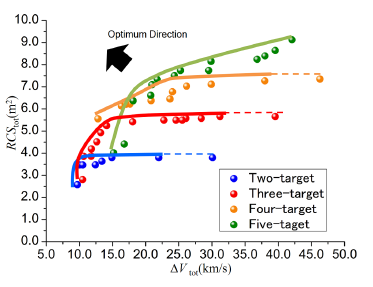 Figure 9: Non-dominated solutions obtained by the developed trajectory optimization method.
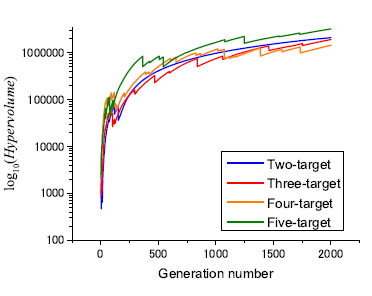 Figure 10: Comparison of hypervolume histories.
4.1. MoP Solutions by Means of MOEA
Figure 9 shows the solution after the 2000th generation. In this figure, the solutions of Rank 1 and 2 were plotted. From Fig. 7, the maximum RCS of one debris is 1.8m2; thus, the maximum value of RCStot in cases of removing two, three, four, and five pieces of debris is 3.6m2, 5.4m2, 7.2m2, and 9.0m2, respectively. In each case shown in Fig. 9, the resulting RCStot shows the maximum possible value. In the figure, the solid line connects Rank 1, and the dotted line connects Rank 2. According to these lines, ∆Vtot was distributed over a wide range while RCStot shows the same maximum values.
The hypervolume convergence history is shown in Fig. 10. In each case, converged solutions were obtained, while it is expected to moderately improve after 2000 generations. This is because the number of solutions constituting the non-dominated solution will increase in each case, while the maximum point of RCStot has already been determined.
4.2. Visualization of the Design Problem with SPM
Figure 11 shows the SPM for each case. The SPM contains two objective functions and the RCS of the selected debris in the rendezvous order. In Fig. 11(a), both RCS whose debris to be removed show high correlation with both the objective functions. In Fig. 11(b) and (c), the RCS of the last debris to be removed (RCS2 And RCS4) is also correlated with both the objective functions. On the other hand, in Fig. 11(d), the RCS (RCS3) of the third debris to be removed is correlated with each objective function; however, the RCS of the last debris to be removed is not correlated with each objective function.
The diagonal elements in Fig. 11 show frequency distributions. Comparing these distributions with those in Fig. 7 shows the deviation. Looking at the frequency distribution of RCS3 in Fig. 11(d), it was found that relatively large debris (RCS over 1.4m2) was removed. Furthermore, as shown in Fig. 11(a) and (b), large debris were selected for RCS1 and RCS2, respectively. However, in Fig. 11(c) and (d), it was found that small debris 0.4m2 or less were also removed. This means that large debris should be removed along with small debris at a convenient position from the point of orbit transition to improve the overall efficiency. Figure 11(d) shows that in the case of removing five pieces of debris, there is a strong correlation between RCStot and RCS3. In fact, when RCS3 is large, RCStot is also large. On the other hand, when RCS3 is large, ∆Vtot does not necessarily become large. In this way, it is expected that planning multiple debris removal paths will become easier if the order in which to remove larger debris can be decided.
5. Conclusions
In this research, the path optimization of multiple space debris removal satellites was attempted by applying the TSP solution by using an evolutionary calculation method. The optimization problem considered was the maximization of the sum total of the radar reflection area that represents the size of the debris and minimization of the total velocity increment to rendezvous with the selected debris. Data, including altitude, for hundred pieces of debris were used to investigate our methodology. The Lambert problem was solved for the orbit transition of the removal satellite. In the optimization, order crossover was used as a crossover method. The reverse order method was used for mutation. Furthermore, as the problem in this study is defined as multi-objective, non-dominated sorting for ranking was employed . In investigating the developed method, multi-objective problems were used by changing the pieces of debris removed by one removal satellite from 2 to 5. According to results, the following information was obtained.
- Because the sum of the maximum radar reflection areas can be calculated from 100 debris candidates in the proposed optimization process, it is effective to use TSP solution method in this problem.
- There is a trade-off between the sum of the sizes of debris to be removed and the total velocity increment of the removal satellite.
- Even when the sum of the sizes of debris to be removed is the maximum, the total velocity increment was not uniquely determined. Thus, the total velocity increment should be set as the objective function.
- By increasing the pieces of removed debris simultaneously, the removal operation can be effective because smaller debris will be removed along with larger debris.
- In the case where five pieces of debris were removed, a positive correlation was observed between the radar reflection area of the third piece of debris and the sum of the radar reflection areas. Such findings can be considered as useful knowledge for mission planning.
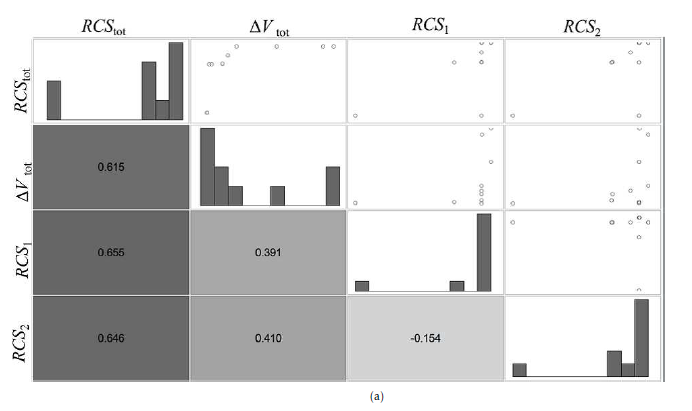
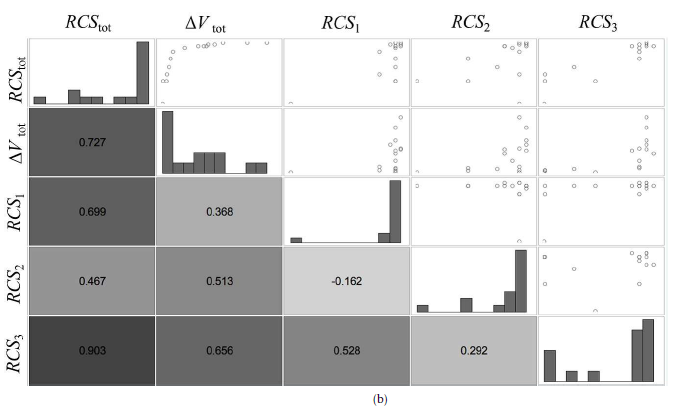
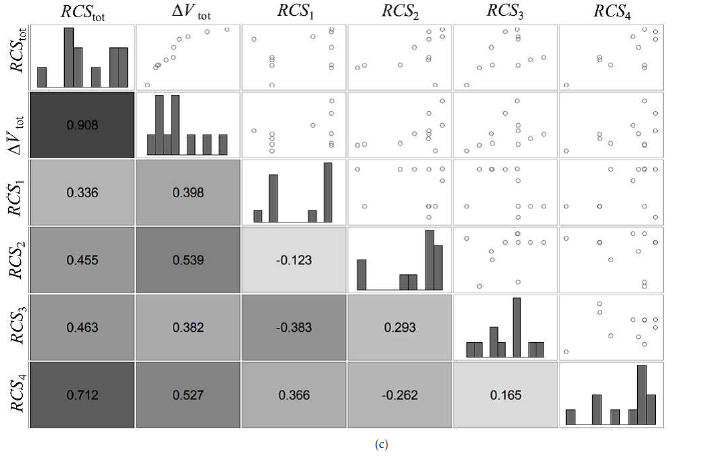
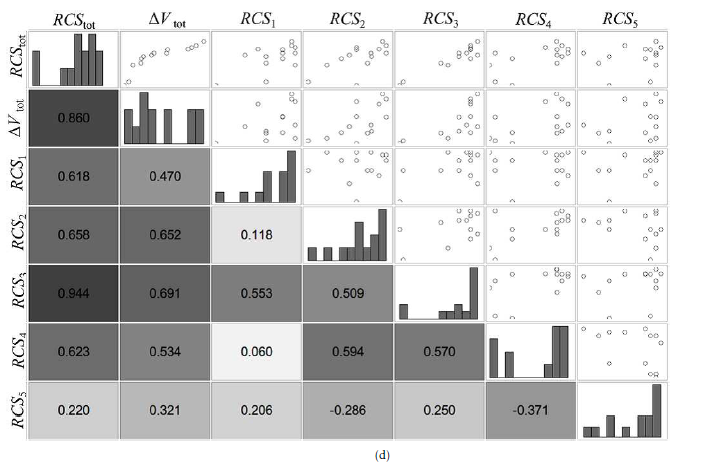 Figure 11: Design problem visualization by SPM: removal of (a) two, (b) three, (c) four, and (d) five pieces of
- N. N. Smirnov, Space Debris: Hazard Evaluation and Debris, ESI Book Series, Taylor and Francis Group, 2002.
- H. Klinkrad, P. Beltrami, S. Hauptmann, C. Martin, H. Sdunnus, H. Stokes, R. Walker, and J. Wilkinson,”The ESA Space Debris Mitigation Handbook 2002,” Advances in Space Research, Elsevier, 34(5), 1251–1259, 2004. https://doi.org/10.1016/j.asr.2003.01.018
- T. Yasaka, R. Hanada, and H. Hirayama, “Geo debris environment: A model to forecast the next 100 years,” Advances in Space Research, Elsevier, 23(1),191–199, 1999. https://doi.org/10.1016/S0273-1177(99)00004-6
- D. J. Kessler and B. G. CourPalais, “Collision frequency of artificial satellites: The creation of a debris belt,” Journal of Geophysical Research, 83(A6), 2637-2646, 1978. https://doi.org/10.1029/JA083iA06p02637
- Kessler, D. J., and Cour-Palais, B. G., : Collision frequency of artificial satellites: The creation of a debris belt, Advances in Space Research, Elsevier, pp. 2637–2646 (1978)
- Johnson, N. L. Stansbery E., Liou, J. C., Horstman, M., Stokely, C. and Whitlock, D., “The characteristics and consequences of the break-up of the Fengyun-1C spacecraft,” Acta Astronautica, Elsevier, 63, 149–156, 2013. https://doi.org/10.1016/j.actaastro.2007.12.044
- V. Aslanov and V. Yudintsev, “Dynamics of large space debris removal using tethered space tug,” Acta Astronautica, Elsevier, 91, 149–156, 2013. https://doi.org/10.1016/j.actaastro.2013.05.020
- Bombardelli, C. and Pelaez, J., : Ion Beam Shepherd for Contactless Space Debris Removal, Advances in Space Research, Elsevier, Vol, 34, No. 3, pp. 916–920 (2011)
- L. T. DeLucaa, F. Bernellia, F. Maggia, P. Tadinia, C. Pardinib, L. Anselmob, M. Grassic, D. Pavarind, A. Francesconid, F. Branzd, S. Chiesae, N. Violae, C. Bonnalf, V. Trushlyakovg, and I. Belokonov, “Active space debris removal by a hybrid propulsion module,” Acta Astronautica, Elsevier, 91, 20–33, 2013. https://doi.org/10.1016/j.actaastro.2013.04.025
- Payne, T. and Morris, R., : The Space Surveillance Network (SSN) and Orbital Debris, 33rd Annual AAS Guidance and Control Conference, AAS Paper Number 10-012, (2010)
- ] Barbee, B. W., Alfano, S., Pinon, E., Gold, K. and Gaylor, D., : Design of Spacecraft Missions to Remove Multiple Orbital Debris Objects, 35rd Annual AAS Guidance and Control Conference, AAS Paper Number 12-017, (2012)
- D. B. Fogel, “An evolutionary approach to the travelling salesman problem,” Biological Cybernetics, Springer, 60(2), 139– 144, 1988. https://doi.org/10.1007/BF00202901
- K. Kondo, K. Miki, and T. Hiroyasu, “Kyoto touring problem – proposal of a new discrete test problem in multiobjective optimization -,” in IPSJ Symposium, Tokyo, Japan, 2003. http://jglobal.jst.go.jp/en/public/200902275803303852 (in japanese)
- J. Xiao, X. Ma, Z. Zhu, J. Zhou, and Y. Yang, “Multiobjective memetic algorithm for solving pickup and delivery problem with dynamic customer requests and traffic information,” in 2016 IEEE Congress on Evolutionary Computation (CEC), Vancouver, BC, Canada, 2016. https://doi.org/10.1109/CEC.2016.7744028
- D. D. Mueller, R. R. Bate, and J. E. White, Fundamentals of Astrodynamics, New Dover Publications, 1971.
- K. Deb, A. Pratap, S. Agarwal, and T. Meyarivan, “A fast and elitist multiobjective genetic algorithm: NSGA-II,” IEEE Transactions on Evolutionary Computation, 6(2), 182–197, 2002. https://doi.org/10.1109/4235.996017
- R. A. Becker, W. S. Cleveland, and A. R. Wilks, “Dynamic graphics for data analysis,” Statistical Science, Institute of Mathematical Statistics, 2(4), 355–383, 1987. https://www.jstor.org/stable/2245523
Citations by Dimensions
Citations by PlumX
Google Scholar
Scopus
Crossref Citations
- Laura Medioni, Yvan Gary, Myrtille Monclin, Côme Oosterhof, Gaetan Pierre, Tom Semblanet, Perrine Comte, Kévin Nocentini, "Trajectory optimization for multi-target Active Debris Removal missions." Advances in Space Research, vol. 72, no. 7, pp. 2801, 2023.
No. of Downloads Per Month
No. of Downloads Per Country
