A Novel Fair and Efficient Resource Allocation Scheduling Algorithm for Uplink in LTE-A
A Novel Fair and Efficient Resource Allocation Scheduling Algorithm for Uplink in LTE-A
Volume 3, Issue 6, Page No 222-232, 2018
Author’s Name: Havva Esra Bilisika), Radosveta Sokullu
View Affiliations
Engineering Faculty, Department of Electrical-Electronics Engineering, Ege University, 35040, İzmir, Turkey
a)Author to whom correspondence should be addressed. E-mail: bilisik.h@gmail.com
Adv. Sci. Technol. Eng. Syst. J. 3(6), 222-232 (2018); ![]() DOI: 10.25046/aj030629
DOI: 10.25046/aj030629
Keywords: Long Term Evolution – A, Uplink Transmission, Radio Resource Allocation Algorithms, Network Throughput, User Fairness

Export Citations
With the introduction of new services and new more sophisticated mobile devices the radio network operators are faced with new challanges to increase the system performance. The most recent standards introduced by 3GPP for the new architectures of the Long Term Evolution network address these issues and outline possibilities for optimizing network performance and user QoS. A major instrument in that respect is the resource scheduling and allocation procedure. So far many different algorithms have ben proposed. Uplink resource allocation however is less covered, beacsue it poses additional constraints which make it difficult to balance the optimization between channel state information, system throughput and user perceived throughput. In this paper we propose a novel algorithm for resource allocation which balances the advantages of two previously suggested ones, specifically Round Robin and Best-CQI. We also define a new parameter, the user ratio, which allows us to explicitly quantify the trade-off between fairness, system throughput and user throughput for different channel conditions.
Received: 28 August 2018, Accepted: 30 October 2018, Published Online: 10 November 2018
1. Introduction
In recent years the number of smart mobile devices as well as the number of various applications they support has increased in unprecedented proportions. In turn this has increased immensely the network traffic and has changed its characteristics posing many new challenges for the network engineers and network operators. A major instrument which regulates the relation between user demands and network traffic is the network adopted procedure for radio resource allocation, which is defined in the respective network standard.
The Long-Term Evolution (LTE) standard proposed by 3GPP and its latest version Long Term Evolution – Advanced (LTE-A) are the most recent telecommunication standards introduced to meet increasing user demands in terms of high data rates and better quality of service. LTE provides flexible deployments allowing low latency and supporting up to 300 Mbps of data transmission in downlink and up to 75 Mbps throughput for uplink. [1, 2, 3] The standard defines two separate radio access methods for the transmission in the downlink (Base Station to user) and the transmission in the uplink (user to Base Station). Orthogonal frequency division multiple access (OFDMA), selected for the downlink is not suitable for uplink transmissions mainly due to its high Peak to Average Power Ratio (PAPR). Another multiplexing method, namely single carrier-frequency division multiple access (SC-FDMA) is proposed for the uplink [1, 2].
According to the LTE-A architecture, the Base Station known as “Evolved Node B (eNodeB)”, regulates the resource allocation process in both transmission directions. [2]. Functions and algorithms for allocating network resources for the downlink and the uplink are part of the Medium Access Control (MAC) layer at the eNodeB. Since this work is focused on uplink resource allocation, from here on the discussion will concentrate on the specifics of uplink transmission and resource allocation.
In the uplink (UL) the modified, pre-coded form of the OFDMA known as SC-FDMA is adopted in order to reduce cell interference and Peak to Average Power Ratio (PAPR). It is well known that the user equipment’s (UE) battery life is quite limited so SC-FDMA fits well the major requirement for the access method used in the uplink – to be power efficient. However, despite its obvious advantages, there are some additional constraints which make it more difficult to allocate resources in the uplink than in the downlink. These constraints include above all singularity, contiguity, and transmit power constrains [5]. The constraint defined as “singularity” mandates that a given resource block (RB) can be allocated only to a single user. The constraint defined as “contiguity” implies that all RBs allocated to a given user must be contiguous. The third constrained, defined as “transmit power constraint” in its turn requires that the maximum transmit power for any user should be less than or equal to 23 dBm [5]. Regarding the transmission modes LTE-A standard defines both time division (TDD) and frequency division duplex (FDD). In the time domain, the transmissions are realized in “time domain frames”. Each frame has duration of 10 ms and is respectively divided into 10 consecutive sub-frames with durations of 1 ms each, the so called Transmission Time Interval (TTI). In its turn, a given sub-frame is subdivided into two slots with durations of 0.5 ms each, carrying 7 OFDM symbols. Regarding the frequency domain, the available system bandwidth is divided into sub-carriers of 15 kHz. Finally, the resources according to the LTE-A standard are defined both in time and frequency domain in terms of Resource Block (RBs). Each RB consists of 12 subcarriers, with a total bandwidth of 180 kHz and last for 0.5 ms in the time domain. The number of available resources (i.e. RBs) will change for different system bandwidths.
LTE is an all-IP packet-based technology. The network architecture defined for LTE and LTE-A comprises the Evolved Node B (eNodeB), the Evolved Packet System (EPS) and the User Equipment (UE) [1,2]. The eNodeB is the entity between the UE and the network. That is why the eNodeB is responsible for allocating resources to the UEs both in the downlink and uplink. In the MAC layer of the eNodeB itself resides the so-called Packet Scheduler (PS), which controls the resource scheduling and allocation process. Its major task is to allocate RBs to all the UEs for every TTI with duration of 1 ms. Every TTI, each UE sends a Sounding Reference Signal (SRS) to its serving eNodeB. Based on the received SRS the eNodeB assigns a metric, called Channel Quality Indicator (CQI), with values ranging from 1 to 15 for each UE. Using this metric, the eNodeB defines each UEs channel quality value and generates a matrix called the “channel gain matrix”. The rows in that matrix represent the UEs and the columns are the available RBs. By allocating resources to UEs using this matrix, the spectral efficiency is maximized.
In this article, a novel Fair and Efficient Resource Allocation (FERA) algorithm for the uplink resource allocation scheduling is proposed and evaluated. The rest of the paper is organized as follows. Section 2 summarizes related works on uplink scheduling algorithms. Section 3 gives details on resource allocation procedures in LTE-A uplink. In section 4, the proposed algorithm, the system model and the metrics used to evaluate and compare the proposed algorithm with other well-known scheduling algorithms are detailed. Section 5 discusses the simulation scenarios that were conducted; Section 6 presents results and discussion followed by the conclusion.
2. Related Works
Resource allocation scheduling algorithms for LTE UL have been discussed by many scientists [2, 4-11]. Due to the specific constraints of singularity, contiguity, and transmit power, the resource allocation process is more complicated in the uplink as compared to the downlink. The several most popular scheduler algorithms so far are Round Robin (RR) , Best CQI (B-CQI) and Proportional Fair (PF) .
RR is the simplest resource allocation algorithm compared to other scheduling algorithms. This algorithm is channel-unaware and aims to achieve high fairness. The assumption is that the channel conditions do not change during the transmission time, and therefore the channel conditions are not taken into account by the allocation algorithm. RBs are assigned to users one by one and fairly among all users [6]. This approach is often used because it guarantees high overall fairness in the resource allocation. Its main disadvantage is that the overall throughput is quite low compared to other algorithms. In [7] the authors define and use the RR algorithm in a time-based fashion, ensuring RB allocation sequentially to the users in a circular manner.
Unlike RR, the Best-Channel Quality Indicator (B-CQI) scheduling algorithm is an example of a channel-aware scheduling algorithm. It takes into account the current state of the channel while allocating resources to UEs [8]. B-CQI scheduling algorithm allocates RBs to any UE depending on how good the channel quality of that UE is. Any UE that has data to send transmits its CQI value to its serving eNodeB. A high CQI value reflects good channel conditions for the given UE. Therefore, the UE that has higher CQI values can be allocated more RBs as compared to UEs that has lower CQI values. Thus the B-CQI’s main objective, to increase the overall throughput, is achieved. However, because the RB allocation is done solemnly based on the CQI value of an UE, the resources might not be distributed fairly among all users. B-CQI algorithm increases the throughput of some users however some users, especially the UEs located close to the cell edge, might be left to starve.
The third most popular algorithm, known as the Proportional Fair (PF) is a combination of the above described RR and B-CQI algorithms [9]. The goal of this algorithm is to achieve sufficient throughput while maintaining fairness among users. The main idea of the PF algorithm is to determine users with relatively good channel conditions and assign resources to them.
In [7], the authors proposed a new scheduling algorithm “Modified RRBC” which is based on a different combination of RR and B-CQI algorithms. The newly proposed algorithm uses RR algorithm in the first time slot to allocate RBs to UEs, and in the second time slot allocates RBs to UEs with higher CQI value and lower RB allocation in the previous slot. The proposed algorithm has been compared to RR and B-CQI in terms of fairness, throughput and average queuing delay. Results show that the proposed algorithm performs better in terms of throughput than RR algorithm and slightly better in terms of fairness and the average delay as compared to B-CQI.
Besides these major resource allocation algorithms, there a number of other suggestions which try to balance the optimization criteria between high fairness (low throughput, low complexity) and high throughput (low fairness, complexity). The authors in [4], propose a new Mobility Aware scheduling algorithm that takes advantage of the simplicity of RR and B-CQI algorithms and aims to reduce their disadvantages taking into consideration the mobility of the users. The performance of the proposed algorithm is compared to RR and B-CQI in terms of fairness, throughput and block error rate (BLER). Results show that proposed algorithm performs similar to RR in terms of fairness and similar to B-CQI in terms of throughput for the downlink. In [9], the authors studied the throughput-fairness trade-off considering three different uplink scheduling algorithms: RR, Maximum Throughput (MT) and First Maximum Expansion (FME). The results show that considering fairness among users RR gives better performance than the other two algorithms, so with VoIP and Video flows RR is the best scheduler. On the downside however, when considering the best effort flows RR algorithm shows the worst performance.
The Approximate Maximum Throughput (AMT) algorithm was proposed by the authors in [10], aiming to solve the resource allocation problem in a more computationally efficient way than the Optimal Maximum Throughput (OMT), which was proposed before. The AMT algorithm maximizes the throughput by using a heuristic approach. AMT algorithm allocates RBs to UEs with good SNR and the UEs with low SNR value are not served at all. The authors compare the algorithm in terms of throughput and BLER with B-CQI and Kwan Maximum Throughput (KMT) algorithms. Results show that the proposed AMT algorithm performs similar to B-CQI and better than KMT in terms of throughput. BLER parameter is compared using two users and the results show that AMT and B-CQI algorithms show similar values but KMT algorithm shows lower BLER value.
In [11] the authors propose a novel resource allocation algorithm for the uplink, which they call Opportunistic Dual Metric scheduling based on Quality of service and Power Control (ODM-QPC). The algorithm aims to maximize the system throughput and Quality of Service (QoS) while keeping track of the fairness among users. The algorithm allocates the maximum number of RBs to each UE in accordance with its target QoS. Once RBs are allocated to all UEs, Power Control (PC) regulations are applied to the UE’s emission power without affecting the user’s throughput. The proposed resource allocation algorithm achieves high aggregated throughput and quite reasonable fairness while meeting the satisfaction of the user QoS and the reduction of the user’s power depending on his channel conditions. The authors compare their algorithm with B-CQI and PF in terms of throughput and fairness respectively. The results show that ODM-QPC achieves throughput close to that obtained by B-CQI for all simulated cases. In terms of fairness ODM-QPC performs similar to PF algorithm.
Excluding RR, most of the other algorithms discussed above are quite computationally demanding. Some of them require more than one-step iteration, which means that they are also time demanding. Thus, the focus of this work was to design a fast, simple algorithm that can adapt to different channel conditions and provide users with similar performance balancing between high throughput and high fairness independent of the different channel conditions.
3. Uplink Resource Allocation
In modern wireless communications the abundance and specifics of applications and devices creates differences in the traffic created in the downlink and uplink direction. These differences are adequately reflected in the LTE-A standard, where, as mentioned in section 1, two different multiple access methods are specified. Naturally these reflect on the specific resource allocation procedure, that is why in this section we first elaborate on these differences and the specifics of uplink resource allocation before proceeding with the proposed algorithm.
The first major difference is limited power and computation resources available. Compared to the eNodeB the handheld mobile device operates on limited battery life and considerably restricted computational resources. This mandates very efficient data transmission. The solution provided by the standard is the SC-OFDMA which ensures low PAPR but introduces a number of additional constraints (singularity, contingency) to the resource allocation procedure. The second originates from the abundance and variety of applications which can be initiated by the user and the difficulty to predict the number of resources a user will need to exchange data with the eNodeB. Additional constraints of contiguity and singularity also add up to make uplink resource allocation more complicated than downlink.
The goal of the network is to serve its users in accordance with their needs providing, low latency in transmission, allocating the required resources and distributing resources fairly among different UEs. The major optimization criteria for the uplink can be defined based on the requirements of the two sides involved: the user and the network. From the user point of view, the major criterion is fairness while from the network point of view throughput is the most important one. A good uplink resource allocation algorithm will provide the right balance and trade-off between these criteria. On the other hand it has to be simple and fast to execute.
The details of uplink resource definitions can be found in [2]. As explained before in Section I resources are defined in terms of frequency and duration. For the uplink, the smallest resource unit is the resource element. Each resource element corresponds to a square in the resource grid (Figure 1), and is defined by the index pair (k,l) where k and l are the indices in the frequency and time domains respectively. An uplink physical channel corresponds to a set of resource elements carrying information originating from higher layers. The transmitted signal within each slot is defined by a resource grid of subcarriers and SC-FDMA symbols. The parameter is based on the bandwidth set in cells and must satisfy the following relation:
According to the standard the smallest and the largest bandwidths supported are for the uplink are = 6 and = 110 respectively.
A physical resource block on the other hand is defined as : consecutive SC-FDMA symbols in the time domain and consecutive subcarriers in the frequency domain. Thus, the definition of a Resource Block corresponds to resource elements or equivalently to one slot in the time domain and 180 kHz in the frequency domain.
The procedures of allocating resources are part of the Radio Resource Management (RRM), located in the eNodeB’s Medium Access Layer (MAC) [14]. The specific algorithm specifying resource allocation in time and frequency domain is carried out in every TTI. During every TTI, each UE has to send the so-called Sounding Reference Signal (SRS) to the serving eNodeB, which will allow it to assign a metric for the quality of the channel between the two, the CQI as explained before [1]. The metric is used by the eNodeB to create a channel gain matrix for all UEs, where a row will correspond to a UE, and the columns define the available RBs. This channel gain matrix is used by the resource allocation algorithm and allows it to maximize the overall efficiency of the system [15].
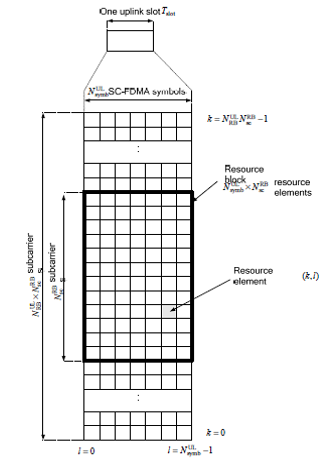 Figure 1: Uplink Resource Grid [2]
4. Proposed Algorithm and System Model
4.1. System Model
In this work, one eNodeB and varying numbers of UEs are used (10, 20 and 30). In order to clearly show the differences between examined algorithms, three different types of channel models for wireless channel between eNodeB and the UE are considered. These channel models are, Typical Urban, Rural Area and Pedestrian Channel B. The 3GPP proposes the Typical Urban channel model (TU) to represent densely populated areas with highest path loss. The Rural Area (RA) channel model is suggested for less populated areas [16]. The Pedestrian channel model (Ped) is for mobile users with low-mobility, with speed less than 30 km/h. Details of the specific parameters for these channel models are given in section 5.
The traffic model for all UEs is assumed that of full-buffer. The scenarios were conducted using different types of channel models, scheduling algorithms, system bandwidth and number of UEs.
4.2. Notations and Performance Metrics
In this section the notations and the metrics used in this article are detailed.
The number of users in the system at a given moment is defined as N. The throughput of the ith user is given as:
Ti = throughput of ith user
While the average throughput for the system is:
Tavg = average system throughput.
As the algorithms are examined in terms of varying system bandwidth the specific bandwidth for a given scenario is defined as SBW. The total simulation time is:
Dsim = total simulation time
SBW = system bandwidth.
Since the suggested algorithm takes into consideration the user data stream in terms of bits we also define:
BAi = i th users received bit.
While most available comparisons are done for throughput and fairness only in our work we introduce one more metric called ‘user ratio’. Fairness defines how fairly resources are allocated among users, while throughput defines the amount of transmitted bits. Since to compare the performance of different scheduling algorithms and to keep track of the trade-off between throughput and fairness at the same time is difficult, a new metric is proposed called ‘user ratio’. It allows us to observe and compare throughput and fairness form users’ perspective much easier. Below explicit definitions of these metrics are presented.
4.3. Fairness
This metric is the most important performance criteria in resource allocation in the uplink. This metric defines how fair the resources are allocated among users and is calculated using Jain’s Fairness Index [5]. When the available resources are going to be allocated to N users, and ith users throughput is Ti the fairness can be calculated using the formula below;
The parameter J varies between 1 and 0. When the value of the parameter is close to 1 this indicates highly fairness of resource allocation.
4.4. Throughput
Throughput is one of the important parameters in the evaluation of the system performance. Throughput is basically defined as the amount of transmitted bits. But in this work we are focusing on average throughput for each user. Average throughput, is the amount of successfully transmitted bits to the eNodeB for the given simulation time and it is calculated as:
4.5. User Ratio
In order to increase the efficiency of allocating resources the LTE/ LTE-A standards, define ‘flexible bandwidth allocation’. Also depending on the number of transmission antennas used the physical layer throughput for the downlink changes from 100 Mbps, 150 Mbps and 300 Mbps for 1, 2 and 4 antenna ports respectively. In this work we consider only the single antenna case. In terms of time without changing frame or slot, when bandwidth is changed, the number of resource blocks allocated to the user also changes. The bandwidth allocation varies between 1.4 MHz – 20 MHz. For example only 1.4 MHz can be allocated or different chunks can be merged (i.e. 1.4 MHz and 20 MHz) in order to achieve higher data rate. Therefore, not only the overall system bandwidth but also the allocated bandwidth to the users will change. Furthermore, comparing the performance of different scheduling algorithms, using different channel models makes it difficult to balance and observe the trade-off between fairness and throughput. Therefore, we propose a new performance metric so called ‘user ratio’ which is calculated as given below;
After dividing each user’s throughput to the available bandwidth, the ratio gives us the fairness of the resources allocated among users and allows us to compare the throughput of each user individually under different algorithms.
4.6. Proposed Algorithm
As mentioned in the previous section a good resource allocation algorithm has to balance between the user needs (fairness and high user throughput) and the system requirements (high average throughput). It also has to be efficient and simple to execute. The two most popular algorithms, RR and B-CQI stand at the two extremes: RR maximizes fairness, B-CQI maximizes average system throughput. RR is very simple and fast to execute, while B-CQI is quite sophisticated and computationally demanding. That is why, in our work we try to balance their advantages and reduce their disadvantages as much as possible.
The algorithm proposed in this work is called Fair and Efficient Resource Allocation (FERA). Our main idea is based on keeping track of the current channel conditions while allocating resources in accordance with user expectations. When channel conditions are good (high SNR) all users will be allocated some resources so it is important to utilize the situation to increase average throughput. On the other hand, when the channel conditions are generally bad, the algorithm should try to increase fairness in order not to eliminate users with low SNR and let them starve for service. To keep track of this sensitive balance between fairness and throughput, in the previous section we introduced the user ratio parameter and use as a switch in our proposed algorithm.
The FERA scheduling algorithm incorporates the advantages of RR and AMT scheduling algorithms. Following numerous simulations and analysis of different system bandwidth configurations the right proportions were determined. Our algorithm operation is TTI based. The allocation of resources is dependent on the channel quality in terms of user SNR. When the channel conditions are bad, reflecting in low SNR values, (up to 15 dB determined empirically) running the complex AMT algorithm does not provide any gains. Instead, trying to provide some resources to all users our proposed algorithm operates similarly to the RR ensuring increase in the fairness of resource distribution. However, for high SNR values, higher than 15 dB, FERA operates similarly to AMT with the goal to maximize average throughput. As can be seen in the pseudo code of the algorithm, presented in Figure 2 below, for each TTI, first the channel conditions are evaluated and then based on the current user ratio a decision is made for which algorithm branch to follow.
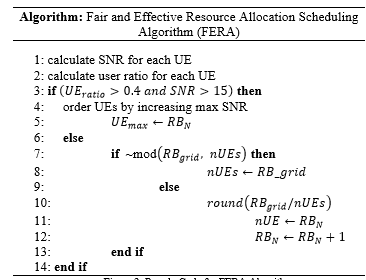 Figure 2: Pseudo Code for FERA Algorithm
5. Simulation Environment and Scenarios
In this work, MATLAB based “LTE-A Uplink Link Level Simulator” is used [17]. The simulator allows us to observe the results of different scenarios under different network related parameters, concerning UEs and eNodeB’s (eNodeB and UE numbers, channel modelling UE mobility, etc.) and scheduling algorithms.
5.1. Considered Simulation Scenarios
In this work, three scenarios are considered. All scenarios consist of a single eNodeB located in the center of the cell, and the users are randomly distributed in the cell. Their speeds are set to pedestrian (3 km/h). The antenna configuration is selected single-input-single-output (SISO), with transmitter and receiver antennas set to one. In each scenario the bandwidth of the system varies between 5 MHz and 20 MHz. The number of users varies from 10 to 30.
In the first scenario, Typical Urban (TU) channel model is considered and the input traffic model is full-buffer. The TU channel model represents the environment with high population density, towns and cities with high-rise buildings, which translates to the highest random multiple path loss. In this scenario the varying parameters are system bandwidth and the number of users. The system bandwidth is set to 5 MHz, 10 MHz, 15 MHz and 20 MHz; the number users – 10, 20 and 30. The performance metrics considered in this scenario are fairness, throughput and user ratio.
The Rural Area (RA) channel model and full-buffer input traffic model are considered in the second scenario. This channel model represents areas with low population and building density having the minimum path loss e.g. farms, forests and agricultural lands etc.
In the third scenario the Pedestrian channel model (PedB), standardized by ITU and specified as, environment for indoor and outdoor users, is adopted, where the indoor coverage is provided by the outdoor transmitter. This channel model is dominated by Doppler frequency component for a certain number of paths and path delays. Two different delay spreads are considered: low delay spread (A) and medium delay spread (B). In this work, the pedestrian model with medium delay spread (PedB) is used.
5.2. Simulation Parameters
The simulation parameters used are summarized in Table 1 below. To increase the accuracy of the results averages over simulations were repeated 5 simulation runs are presented.
Table 1: Simulation Parameters
| Parameters | Values |
| Simulation Time | 500 TTI |
| TTI Duration | 1 ms |
| System Bandwidth | 5 MHz, 10 MHz, 15 MHz, 20 MHz |
| Number of Available RBs | 25, 50, 75 and 100 |
| Number of Users | 10, 20 and 30 |
| Channel Models | TU, RA, PedB |
| Scheduling Algorithms | RR, AMT, B-CQI, FERA (Proposed Algorithm) |
6. Results and Discussion
The resource allocation algorithm that is located in the eNodeB aims at maximizing the efficiency and optimizing the use of resources by providing the necessary QoS and keeping the power consumption at a minimum level.
In Table 2, Table 3 and Table 4, the comparison of the fairness values for the well-known scheduling algorithms in LTE-A which are RR, B-CQI and AMT along with the FERA scheduling algorithm are presented. Simulations were conducted with three different channel models (TU, RA and PedB), system bandwidths of 5 MHz, 20 MHz and for 10 and 30 UE numbers. As theoretically expected the RR scheduling algorithm has the highest fairness values, regardless of the system bandwidth and the number of users. The AMT scheduling algorithm gives the second highest fairness values. On the other hand, the B-CQI scheduling algorithm gives the most varying and low fairness values. The reason for this is that the algorithm allocates resources to the users according to the CQI values so when the system bandwidth is fixed and the number users increases the users with bad conditions will increases as well. Therefore, the fairness in the allocation of resources is decreased. The proposed FERA algorithm on the other hand ensures high degree of fairness in the allocation of resources among the users. It should be noticed that in certain cases it even outperforms the AMT algorithm. For example, the fairness for the B-CQI algorithm drops for the first scenario (TU channel model) with nearly 21% when the number of users is increased from 10 to 30 for 5 MHz system bandwidth, while for the same case the fairness for the FERA drops with only 2% and for the AMT algorithm with 3%.
Table 2: Fairness Values for the TU Channel Model
| Bandwidth/ UE Number | Fairness | |||
| RR | B-CQI | AMT | FERA | |
| 5 MHz/10 UE | 0.99 | 0.88 | 0.99 | 0.99 |
| 5 MHz/30 UE | 0.99 | 0.70 | 0.97 | 0.98 |
| 20 MHz/10UE | 0.99 | 0.85 | 0.99 | 0.99 |
| 20 MHz/30UE | 0.99 | 0.69 | 0.99 | 0.99 |
Table 3: Fairness Values for the RA Channel Model
| Bandwidth/ UE Number | Fairness | |||
| RR | B-CQI | AMT | FERA | |
| 5 MHz/10 UE | 0.99 | 0.82 | 0.96 | 0.98 |
| 5 MHz/30 UE | 0.99 | 0.70 | 0.87 | 0.93 |
| 20 MHz/10UE | 0.99 | 0.82 | 0.96 | 0.98 |
| 20 MHz/30UE | 0.99 | 0.69 | 0.95 | 0.97 |
Table 4: Fairness Values for the PedB Channel Model
| Bandwidth/ UE Number | Fairness | |||
| RR | B-CQI | AMT | FERA | |
| 5 MHz/10 UE | 0.99 | 0.90 | 0.98 | 0.99 |
| 5 MHz/30 UE | 0.99 | 0.78 | 0.96 | 0.98 |
| 20 MHz/10UE | 0.99 | 0.88 | 0.99 | 0.99 |
| 20 MHz/30UE | 0.99 | 0.74 | 0.97 | 0.98 |
It is also interesting to note that there aren’t large differences between the fairness values for the TU and the PedB channel model, while all algorithms show variations in the case of the RA channel model.
The second group of results is related to the user ratio. First we present the comparative results for the 4 algorithms investigated, followed by a more detailed analysis of the user ratio values for the proposed FERA algorithm. In all the figures the x-axis gives the changing SNR values, while the y-axis gives the user ratios, i.e the performance as experienced by the individual user, resulting from the allocation in the uplink provided under the specific resource allocation algorithm.
For the FERA algorithm, the mean and the variance of the user ratio is calculated and given using the box plots below the respective graphics. These two parameters allow us to meticulously differentiate the resource allocation when large number of users is considered. As can be seen in the results, the limits that these values change are indicative of the effect of both relationships: increasing the number of users for a given bandwidth and the specific channel model used (TU, RA, PedB).
The results for the first scenario (TU channel model) for 5 MHz system bandwidth with varying number of users are given in Figure 3 through Figure 6. The comparison with RR, AMT and
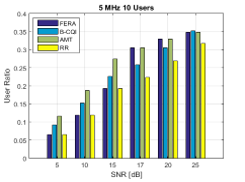 Figure 3: Scheduling Algorithms Comparison, TU Channel Model, 5 MHz system bandwidth / 10 UE
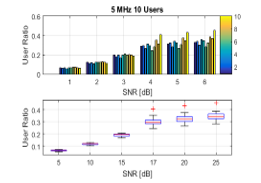 Figure 4: User Ratio, Mean and Variance for 10 UEs/Cell with TU Channel Model and 5 MHz available system bandwidth
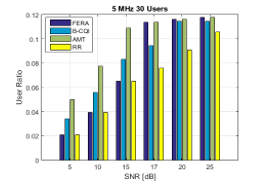 Figure 5: Scheduling Algorithms Comparison, TU Channel Model, 5 MHz system bandwidth / 30 UE
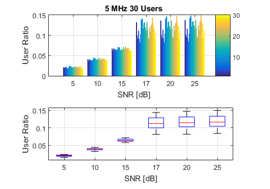 Figure 6: User Ratio, Mean and Variance for 30 UEs/Cell with TU Channel Model 5 MHz available system bandwidth
B-CQI algorithms, done based on the average user ratio, (As shown in Figure 3 and Figure 6) shows that the proposed algorithm adapts to the changing channel conditions and even though it does not outperform for all cases provides a stable average performance with changing SNR. Furthermore, by examining the mean and variance of the user ratio for different values of the SNR we evaluate the effect of the channel on the performance that the individual user experiences. It can be seen that the variance is quite small, less than 0.01 for both 10 users and 30 users (see Figure 4 and Figure 6), which also confirms the fact that despite the changing SNR value the allocation algorithm adapts and provides the users with nearly the same performance. The proposed algorithm is both simple in terms of computational resources and quite effective. Thus, using the user ratio metric defined in section 4, allows us to more clearly trace the trade-off between system efficiency and user fairness.
Similar to the case with 5 MHz system bandwidth, simulations are carried out for 20 MHz system bandwidth and 10 and 30 users per cell respectively. Both the comparative results (see Figure 7 and Figure 10) and the in-depth user ratio analysis (see Figure 8 and Figure 10) show that FERA allocation algorithm ensures a stable average performance from the user’s perspective.
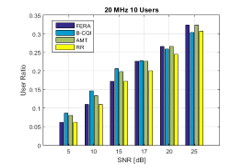 Figure 7: Scheduling Algorithms Comparison, TU Channel Model, 20 MHz system bandwidth / 10 UE
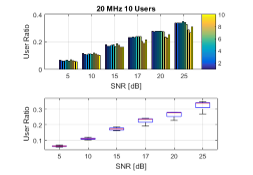 Figure 8: User Ratio, Mean and Variance for 10 UEs/Cell with TU Channel Model 20 MHz available system bandwidth
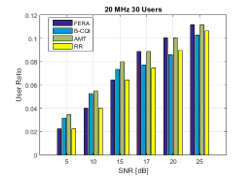 Figure 9: Scheduling Algorithms Comparison, TU Channel Model, 20 MHz system bandwidth / 30 UE
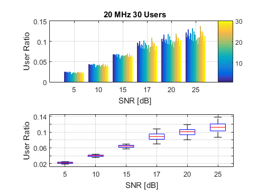 Figure 10: User Ratio, Mean and Variance for 30 UEs/Cell with TU Channel Model and 20 MHz available system bandwidth
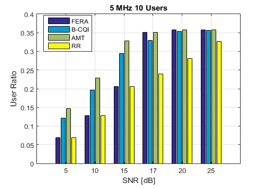 Figure 11: Scheduling Algorithms Comparison, RA Channel Model, 5 MHz system bandwidth / 10 UE
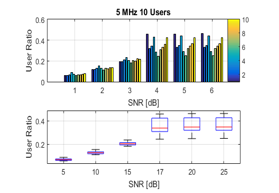 Figure 12: User Ratio, Mean and Variance for 10 UEs/Cell with RA Channel Model 5 MHz available system bandwidth
In Figure 11 through Figure 14 (for 5 MHz system bandwidth) and Figure 15 through Figure 18 (for 20 MHz system bandwidth) results from the second scenario are given, where the RA channel model is used. The simulations were conducted with system bandwidth of 5 MHz, 20 MHz with 10 UEs/cells and 30 UEs/cell respectively. The results show that, because of the bad channel conditions (low SNR values) the user ratios resulting from the FERA allocation algorithm are low, however the resource allocation among users is still fair. One important conclusion that can be made is that for bad channel conditions the variation in the user ratio is nearly negligible, while for high SNR values it is larger. (see Figure 12 and Figure 14). Yet, when the system bandwidth is increased i.e. 20 MHz instead of 5 MHz system bandwidth these variations are less expressed. On the other hand, the results show that in conditions when the SNR values are low, FERA scheduling algorithm maintains constant relation between fairness and throughput among the users. At high SNR values it is observed that the algorithms adapt to changing conditions.
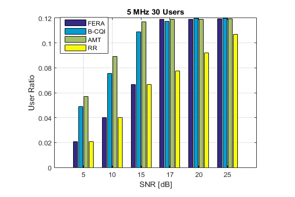 Figure 13: Scheduling Algorithms Comparison, RA Channel Model, 5 MHz system bandwidth / 30 UE
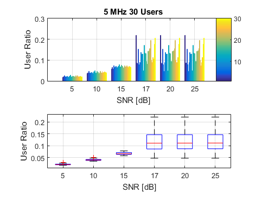 Figure 14: User Ratio, Mean and Variance for 30 UEs/Cell with RA Channel Model 5 MHz available system bandwidth
Results from the third scenario, the PedB channel model, are given in the Figure 19 through Figure 22 for the 5 MHz system bandwidth and Figure 23 through Figure 26 for the 20 MHz system bandwidth below. For low SNR values the user ratio is low because the users channel conditions are bad. But nonetheless the resource allocation among users is fair. It is observed that the user ratio drops when the system bandwidth is fixed and the number of users increase, and this drop is higher for high SNR values. The general trend that has been observed for the other scenarios is also observed here. The FERA algorithm ensures average stable performance from the user point of view.
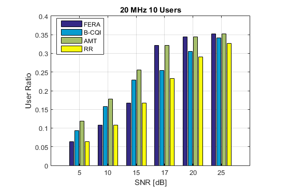 Figure 15: Scheduling Algorithms Comparison, RA Channel Model, 20 MHz system bandwidth / 10 UE
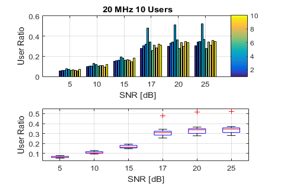 Figure 16: User Ratio, Mean and Variance for 10 UEs/Cell with RA Channel Model 20 MHz available system bandwidth
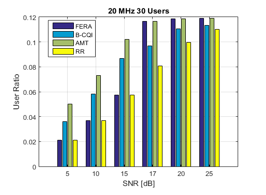 Figure 17: Scheduling Algorithms Comparison, RA Channel Model, 20 MHz system bandwidth / 30 UE
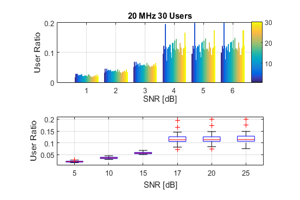 Figure 18: User Ratio, Mean and Variance for 30 UEs/Cell with RA Channel Model 20 MHz available system bandwidth
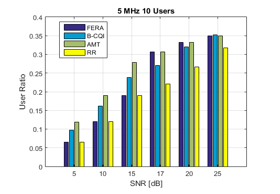 Figure 19: Scheduling Algorithms Comparison, PedB Channel Model, 5 MHz system bandwidth / 10 UE
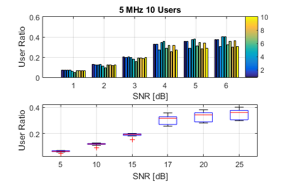 Figure 20: User Ratio, Mean and Variance for 10 UEs/Cell with PedB Channel Model 5 MHz available system bandwidth
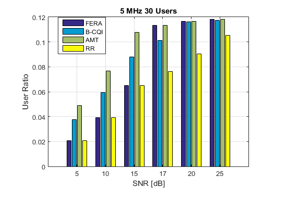 Figure 21: Scheduling Algorithms Comparison, PedB Channel Model, 5 MHz system bandwidth / 30 UE
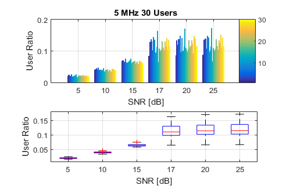 Figure 22: User Ratio, Mean and Variance for 30 UEs/Cell with PedB Channel Model 5 MHz available system bandwidth
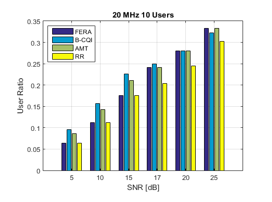 Figure 23: Scheduling Algorithms Comparison, PedB Channel Model, 20 MHz system bandwidth / 10 UE
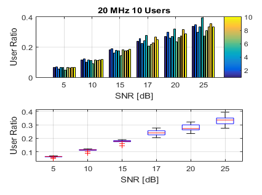 Figure 24: User Ratio, Mean and Variance for 10 UEs/Cell with PedB Channel Model 20 MHz available system bandwidth
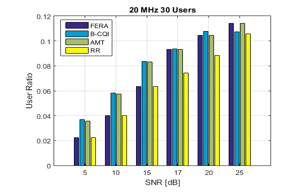 Figure 25: Scheduling Algorithms Comparison, PedB Channel Model, 20 MHz system bandwidth / 30 UE
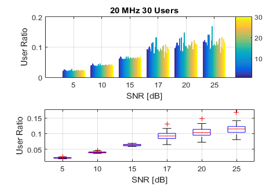 Figure 26: User Ratio, Mean and Variance for 30 UEs/Cell with PedB Channel Model 20 MHz available system bandwidth
The simulation results presented above examine the performance of the proposed FERA algorithm both in comparison with the other 3 algorithms (RR, AMT and B-CQI) and also in terms of mean and variance of the user ratio. The results show that, the variance values for all scenarios are very low, meaning that the performance experienced by the user for different channel conditions is quite stable due to the resource allocation done according to the proposed FERA algorithm.
When the simulations with TU and PedB channel models are compared, as the bandwidth increase, the simulations with PedB channel model give better results. The reason is that the TU channel model represents densely populated areas where the path loss is highest. The second important observation that can be made is that the channel model affects the variance and the mean of the user ratio. This means that the performance experienced by the user in the uplink depends on the environment and can be partially compensated by a proper resource allocation algorithm.
Conflict of Interest
The authors declare no conflict of interest.
Conclusion
In this paper we have focused on examining different resource allocation algorithms for the uplink in LTE systems. The most popular algorithms, Round Robin, Best-CQI and Approximate Maximum Throughput are simulated, and their performance is evaluated in terms of throughput and fairness and compared with the performance of the proposed novel scheduling algorithm FERA. Furthermore, a new metric is introduced, the “user ratio”, which allows us to keep track of the trade-off between increased throughput and fairness from the point of view of the user. Three different scenarios, involving different channel models (Typical Urban, Rural area and Pedestrian) are investigated. The goal of the newly proposed algorithm FERA is to be simple and efficient while providing comparable results with respect to earlier presented algorithms. Its evaluation proves that its performance in terms of throughput and fairness is good and stable under different channel conditions. Compared to the other algorithms is it less computationally demanding, simpler but at the same time sufficiently efficient and adaptable.
- H. Mousavi, Iraj S. Amiri, M.A. Mostafavi, and C.Y. Choon, “LTE physical layer: performance analysis and evaluation”, Appl. Comput. Inform., 1-11, 2017. https://doi.org/10.1016/j.aci.2017.09.008 [Online]
- 3GPP TR 36.819, 2010, 3rd Generation Partnership Project; Technical Specification Group Radio Access Network; Coordinated multi-point operation for LTE physical layer aspects (Release 11)
- N. Abu-Ali, A. M. Taha, M. Salah, and H. Hassanein, “Uplink scheduling in LTE and LTE-Advanced: tutorial, survey and evaluation framework”, IEEE Comms. Surv & Tuts., 16(3), 1239-1265, 2014. https://doi.org/ 10.1049/ic:19980218
- Ö. Yıldız and R. Sokullu, “A Novel Mobility Aware Downlink Scheduling Algorithm for LTE-A Networks”, in 9th International Conference on Ubiquitous and Future Networks, Milan Italy, 2017. https://doi.org/ 10.1109/TELFOR.2017.8249288
- A. Kanagasabai and A. Nayak, “Opportunistic Dual Metric Scheduling for LTE Uplink”, in International Conference on Communication Workshop, London England, 2015. https:/doi.org/10.1109/ICCW.2015.7247382
- R. D. Trivedi, and M. C. Patel, “Comparison of different scheduling algorithm for LTE”, Int. Jour. of Em. Tech. and Adv. Eng, 4(5), 334-339, 2014.
- M. Asvial, G. Dewandaru, and A. N. Rachman, “Modification of round robin and best CQI scheduling method for 3GPP LTE downlink”, Int. Jour. of Tech., 6(2), 130-138, 2015. https://doi.org/10.14716/ijtech.v6i2.964
- A. Marincic, and D. Simunic, “Performance Evaluation of Different Scheduling Algorithms in LTE Systems”, in 39th International Convention on Information and Communication Technology, Electronics and Microelectronics, Opatija Croatia, 2016. https://doi.org/ 10.1109/MIPRO.2016.7522211
- R. E. Ahmed, and H. M. AlMuhallabi, “Throughput-Fairness Tradeoff in LTE Uplink Scheduling Algorithms”, International Conference on Industrial Informatics and Computer Systems, Sharjah United Arab Emirates, 2016. http://doi.org/ 10.1109/ICCSII.2016.7462415
- S. Schwarz, C. Mehlführer and M. Rupp, “Low Complexity Approximate Maximum Throughput Scheduling for LTE”, in Conference Record of the Forty Fourth Asilomar Conference on Signals, Systems and Computers, Pasific Grove USA, 2010. https://doi.org/10.1109/ACSSC.2010.5757800
- L Fatma, M. Hend and K. Hend, “Opportunistic Dual Metric scheduling based on Quality of service and Power Control for LTE Uplink Network” in 13th International Wireless Communications and Mobile Computing Conference, Valencia Spain, 2017. https://doi.org/ 10.1109/IWCMC.2017.7986487
- C. Kong, Y. Chen and I. Peng, “Referential Bounds Analysis of Uplink Radio Resource Scheduling in LTE Network”, 11th Consumer Communications and Networking Conference, Las Vegas USA, 2014. htpps://doi.org/10.1109/CCNC.2014.6866620
- D. C. Dimitrova, H. van den Berg, R. Litjens and G. Heijenk “Scheduling Strategies for LTE Uplink with Flow Behavior Analysis” in 4th Ercim Workshop on E-Mobility, Lulea Sweden, 2010.
- H. Safa, W. El-Hajj, and K. Tohme, “A QoS-Aware Uplink Scheduling Paradigm for LTE Networks”, in International Conference on Advanced Information Networking and Applications, Barcelona Spain, 2013. https://doi.org/10.1109/AINA.2013.38
- A. Mukhopadhyay, G. Das, V. Reddy, “A Fair Uplink Scheduling Algorithm to Achieve Higher MAC Layer Throughput in LTE”, in International Conference on Communications, London England, 2015. https://doi.org/10.1109/ICC.2015.7248803
- D. Lekomtcev, E. Kasem and R. Marsalek, “Matlab-based Simulator of Cooperative Spectrum Sensing in Real Channel Conditions” in 25th International Conference Radioelektronika, Pardubice Czech Republic, 2015. https://doi.org/ 10.1109/RADIOELEK.2015.7129040
- [Online]. Available: http://nt.tuwien.ac.at/ltesimulator.