Medium Height Dual Buildings with Masonry and Concrete Walls in High Seismic Areas

Adv. Sci. Technol. Eng. Syst. J. 3(6), 165–172 (2018);
 DOI: 10.25046/aj030621
This is a comparative study on the behavior of a dual medium height building with different walls solutions, in a high seismic area (Bucharest, Romania). The main feature of those buildings is the placement of load bearing walls on the perimeter of the building. This is done to limit the lateral displacement when the structure is subjected to seismic loading. The walls cannot be placed inside because of architecture demands. The structure has frames on the inside. The walls may be made of confined masonry, as the medium height buildings are allowed to have, but they may also be made of reinforced concrete. The wall area on direction Y is smaller than on X. There may be high efforts on direction Y. This study will show witch walls solution ensures the best behavior for the building. It is also interesting to see the way frames, masonry and concrete walls work together. The study contains both elastic and plastic state analysis results. This study results may be used for any dual medium height building with perimeter walls, and smaller walls area on one direction.
1. Introduction
This study highlights the behavior of confined masonry walls in a medium height dual building. The walls will be used to limit the building drifts. This is an office building, 3 stories high, which will be built in Bucharest Romania. This is considered a high seismic area, the seismic acceleration is 0.30g (g is the gravity acceleration). According to the architecture demands, the building’s partitioning needs to be flexible. This is why walls will be placed on the perimeter of the building and not inside it. Walls assure lower drift values. Both masonry and reinforced concrete walls may be used in this example because this is a medium height building. However, masonry is susceptible to cracking. Dynamic loads may cause irregular deformations [1]. Load-bearing masonry walls show a complex behavior due to the load eccentricity. Walls slenderness reduces the bearing capacity [2]. Studies on masonry walls have shown that shear force capacity is reduced with the increase of bending moment [3]. Masonry walls reinforcements help the masonry to work together with the confining elements [4] and an increased number of confining columns improves the walls strength, the energy dissipation capacity, the ductility and the cracking pattern [5]. According to the model experiments, the confined masonry and concentrated reinforced masonry structures have been used for low and medium-rise buildings in seismic areas [6]. Seismic actions cause vibrations in walls that create lateral loads variable in time. The masonry walls lateral load bearing capacity depends much on its slenderness and the axial load value [7]. Masonry walls may give in to shear force by diagonal shear and sliding shear, so reinforcement is recommended for high seismic areas. There is also another failure called corner crushing, that is not considered in the masonry design [8]. For dual buildings, seismic shear failure is expected to occur in walls. The frames should show a large deformation capacity in the plastic stage [9]. Pushover analysis may give information both about the building’s failure pattern, by the plastic hinges development but also about the building’s safety when the plastic stage is reached. The pushover diagrams are created in terms of base force and top of building displacement [10]. Medium-rise reinforced concrete walls show a good seismic behavior for different earthquake patterns. Buildings with slender walls may show important ductility. Plastic hinges mostly develop at the beams ends [11]. It is interesting to see the interaction between frames in the building’s center and masonry or concrete walls both in the elastic and plastic state. It is not a usual solution to use both masonry and reinforced concrete walls for the same structure. The codes in force used to design the building are [12–19].
2. Structural Solutions
There are 3 structural solutions that may be used for this building. The first solution, seen in Figures 1 and 2, use just confined masonry walls, on the building’s perimeter, on both directions. For the second solution, seen in Figures 3 and 4, the 4 walls on direction Y are made of reinforced concrete. In the third solution, in Figures 5 and 6, on direction Y, the walls are small, made of reinforced concrete. In Figures 1 to 6 the beams are blue, columns and reinforced concrete walls are green, confined masonry walls are red and slabs are light gray. The software used for analysis is ETABS 2016.
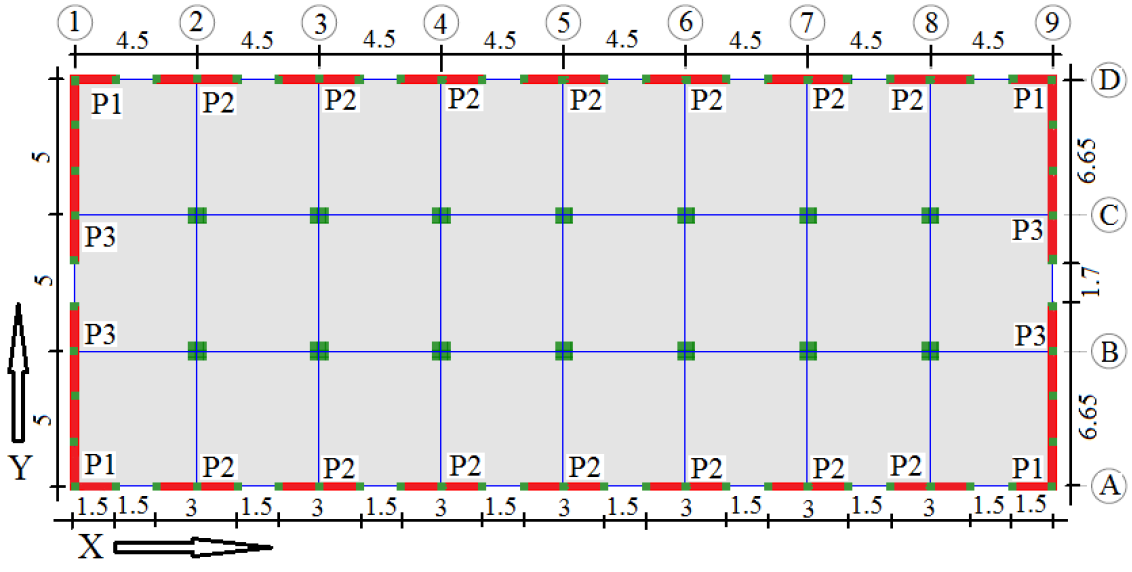 Figure 1: Story plan for solution 1
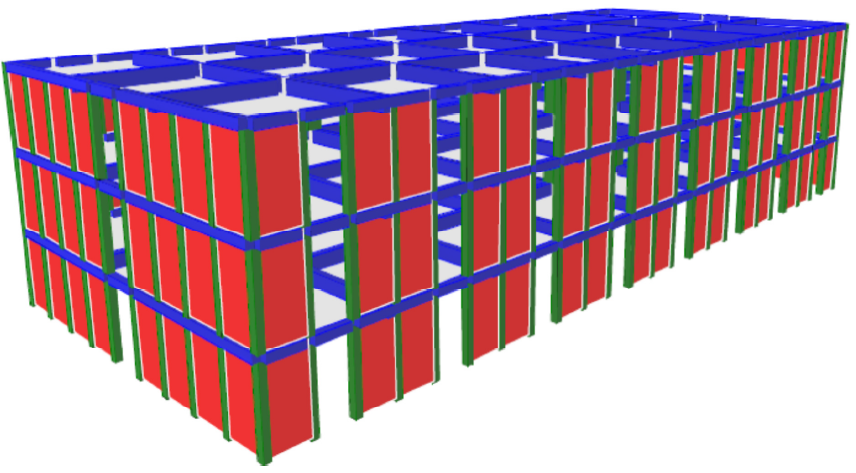 Figure 2: 3D building image for solution 1
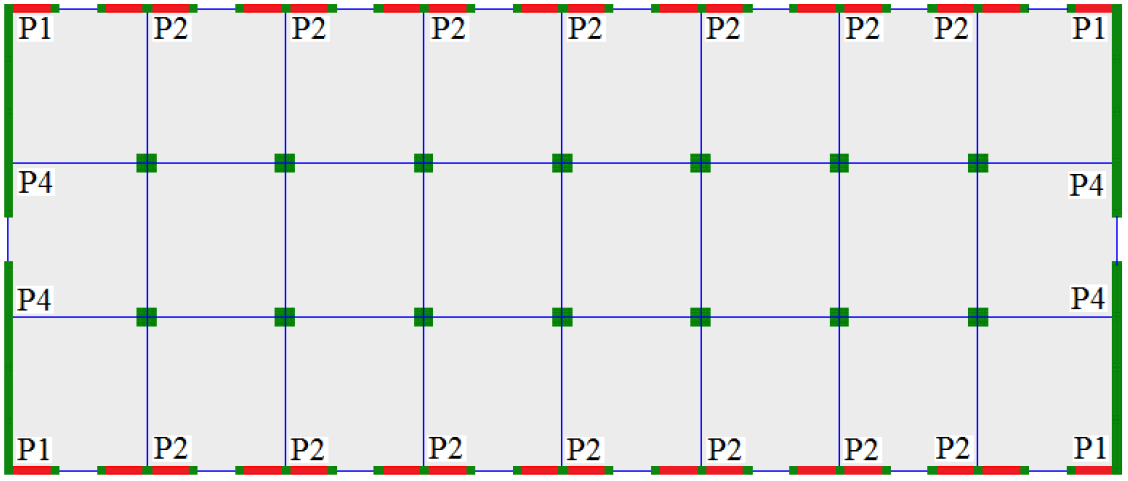 Figure 3: Story plan for solution 2
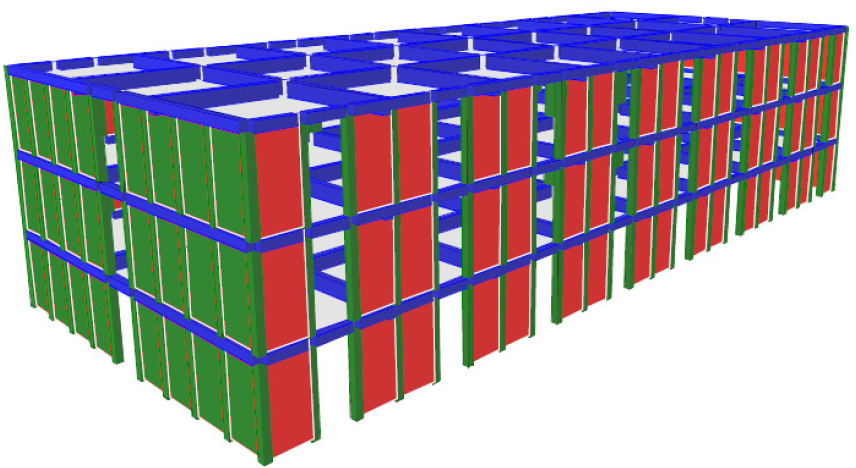 Figure 4: 3D building image for solution 2
3. Structural Elements Design
The structure design is done using the seismic loads combination that contains 1.0·permanent loads+0.4·variable loads+1.0·seismic loads.
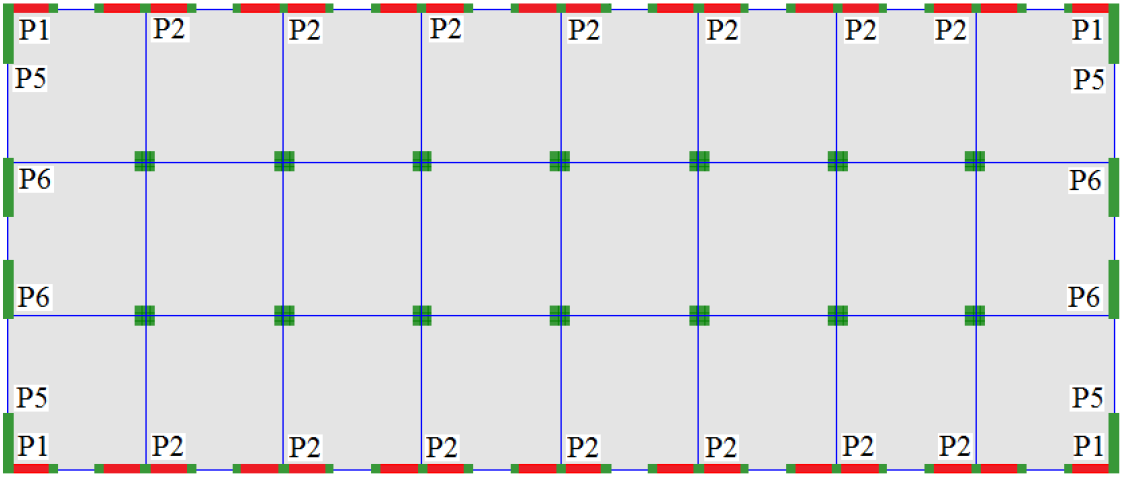 Figure 5: Story plan for solution 3
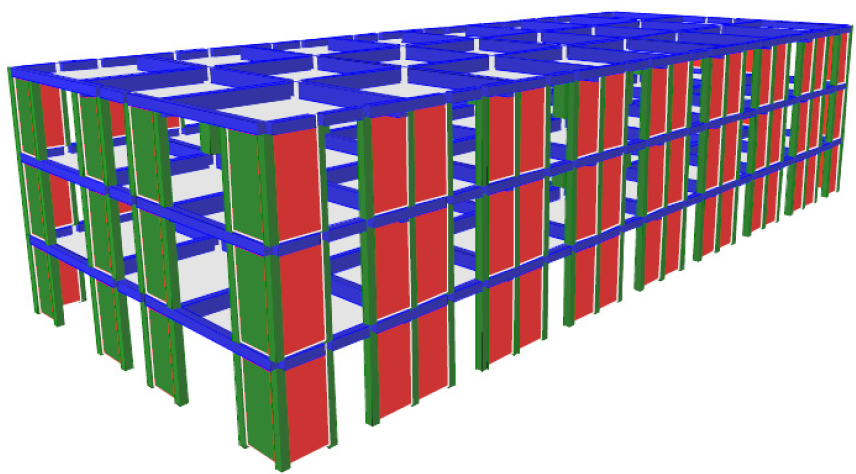 Figure 6: 3D building image for solution 3
The building is composed of a ground floor and 2 stories above it. Walls P1, P2, P3, P4, P5 and P6 horizontal sections are shown in detail in Figure 7.
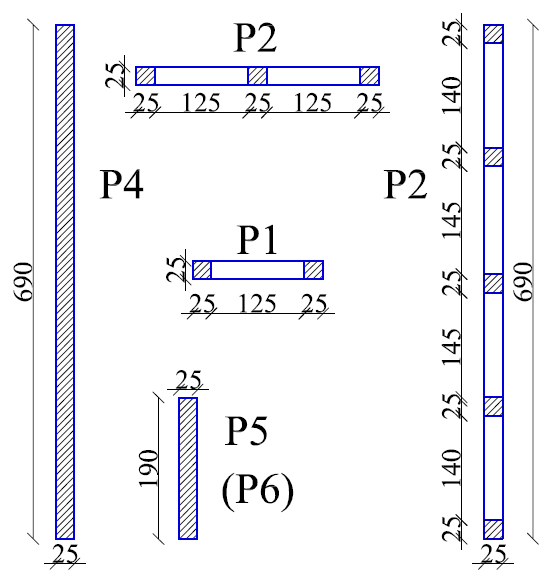 Figure 7: Walls details
Materials used here are concrete C20/25 [16], with elasticity modulus EC=30000N/mm2 and full bricks 240·115·63 (mm) with standard strength fb =10N/mm2, mortar M7.5 and elasticity modulus EM=4050N/mm2 [12]. Reinforcement bars are S355 with elasticity modulus ES=210000N/mm2 [16]. The seismic coefficient cs introduces the seismic load. The base force Fb is calculated using [17]. γI,e = 1.2 is the building’s importance-exposure coefficient, β0 = 2.5 is the maximum value of the elastic spectrum and q is the structure’s behavior factor, q=2.25·αu/α1=2.25·1.35 [17], αu/α1 = the base shear force value for the failing mechanism/the base shear force value for the first plastic hinge, m = building’s mass [17]. η = 0.88 is the reduction factor, λ = 0.85 for 3 stories buildings, ag = 0.30g [17], G = building’s weight.
Fb = γI,e · β0 · ag/q · m · η · λ = cs · G = 0.22·G [kN] (1)
3.1. Masonry Walls Design Theory
The masonry walls stresses analyzed are: σx, σz, and τxz. They are compared to the masonry design strengths [12], that are the following: horizontal compression fdh, vertical compression fd, and shear strength for horizontal direction fvd,l. Those design strengths are determined from their characteristic values: fkh, fk, and fvk,0, using the characteristic masonry strengths insurance factor γM=1.9 and the unitary vertical stress (σd) [12]. The concrete compression design strength fcd, is determined using the characteristic strength (fck) and γM=1.5, for concrete [16].
fdh = fkh/γM=1.91/1.9= 1N/mm2 (2)
fd = fk/γM=4.05/1.9= 2.13N/mm2 (3)
fvd,l =fvk,0/γM+0.4·σd =0.3/1.9+0.4·0.1= 0.2 N/mm2 (4)
fcd = fck/γM=20/1.5= 13.3N/mm2 (5)
Wall percentages are calculated on both X and Y directions. The formula used is (6), Aw is the walls area on the direction the percentage is calculated and At is the total area of the floor [12].
p%=Aw/At·100 (6)
MRd (wall’s bearing bending moment) calculated as in [12]. CA is the compressed area of the wall, MRd(M) is the bearing bending moment from the masonry area.
MRd = MRd(M) + MRd(As) [kNm] (7)
CA=NEd/(0.85·fd) [mm2] (8)
MRd(M) = NEd · yc [kNm] (9)
yc is the distance between the wall’s weight center and the compressed masonry area weight center [12]. The bearing bending moment from the slender columns reinforcement at the wall edges is MRd(As) [12].
MRd(As) =ls·As·fyd [kNm] (10)
fyd =fyk/γM=310N/mm2 is the design strength of the reinforcement bars. It is determined from the characteristic strength fyk and the safety coefficient γM=1.15 for steel [16]. ls is the distance between the slender columns at the wall margins centers. As is the horizontal reinforcement area of the slender columns.
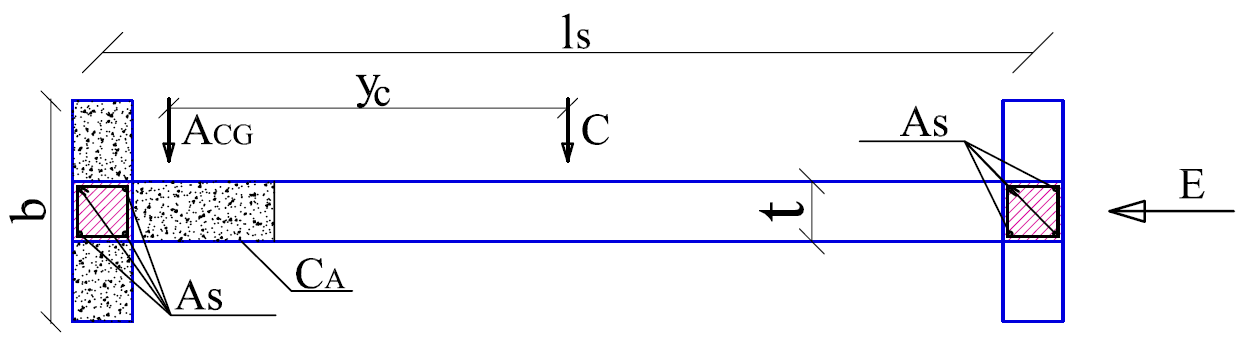 Figure 8: Confined masonry wall section
AC is the wall’s compressed area. ACG is the compressed area gravity center. C is the wall section gravity center. E is the earthquake action. In Figure 9, b=t · fcd/fd [12]. VRd is the masonry wall bearing shear force and VEd is the horizontal shear force from the seismic loads combination.
VRd = VRd1*+VRd2 +VRd3 [kN] (11)
VRd1*= 0.4 · (NEd +0.8· VEd·hpan/lpan)[kN] (12)
VEd ≤ lpan· t · fvd,0 (13)
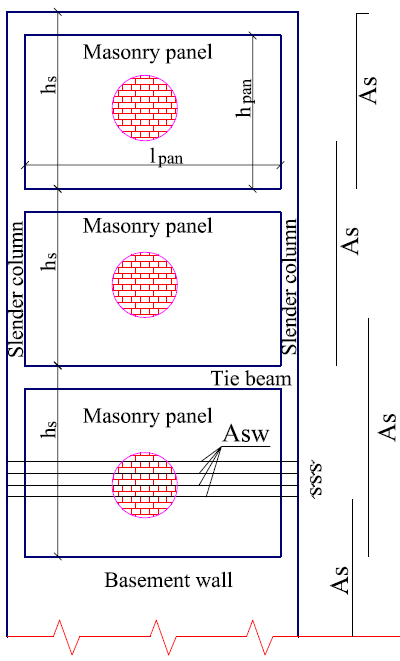 Figure 9: Confined masonry wall elevation
fvd,0=0.16N/mm2 and fvk,0=0.30N/mm2 are the design and characteristic initial shear strengths for no axial stress [12], hpan and lpan are the height and length of the masonry area panel. VRd2 is the bearing horizontal shear force from the reinforcement in the slender column at walls compressed edge [12]. As is the reinforcement area of the slender column at the walls compressed edge. λc is the reinforcement participation factor. Here, λc=0.25, for longitudinal reinforcement Φ16 .
VRd2 = λc · As · fyd [kN] (14)
VRd3 = 0.8 ·lw· Asw ·fyd/s [kN] (15)
VRd3 is the bearing shear force taken by the horizontal reinforcement area in the bricks joints Asw. s is the vertical distance between two horizontal reinforced joints. Here, the masonry walls have tie beams at each story level, as well as at each landing. The reinforcement in those tie beams can create VRd3, even if there are no horizontal reinforcement bars in the masonry wall. The load combination used to design the structure is 1.0·permanent loads+0.4·variable loads+1.0·seismic loads.
3.2. Reinforced Concrete Walls Design Theory
MEd,0 and MEd,s are the ground floor and upper floors design bending moments and MRd is the wall’s bearing bending moment. M’Ed is the bending moment from the moment diagram given by the seismic loads combination for any story [19].
MEd,0 = M’Ed (16)
MEd,s = kM ·Ω· MEd’ ≤ Ω· M’Ed (17)
Ω=MRd,0/M’Ed,0 (18)
VRd,ww=0.18·bw0·lw·fcd (19)
VRd,h=ΣAs,h·fyd (20)
VRd,h=ΣAs,h·fyd +VRd,c (21)
VRd,c =0.5·σcp·bw0·lw (22)
σcp=NEd/(lw·bw0) (23)
kM =1.15 for DCM (medium ductility buildings). VEd and VRd are the design and bearing shear forces. There are 3 VRd values that must surpass VEd [19]. Wall web VRd (VRd ww), horizontal reinforcement VRd (VRd,h) and casting joint VRd (VRd,s). Equation (20) is used for the ground floor and (21) is for the upper floors. As,h is the sum of horizontal reinforcement bars intersected by a 45° angle crack, VRd,c is the shear force taken by the concrete wall area and σcp is the medium compression stress on the wall web.
VRd,s=μf · [Σ(As,v+As)·fyd+NEd] (24)
As,v is the sum of vertical reinforcement bars and μf=0.7 is the friction coefficient [19]. Equations (16) to (24) are taken from [19]. Figure 10 is drawn according to [19].
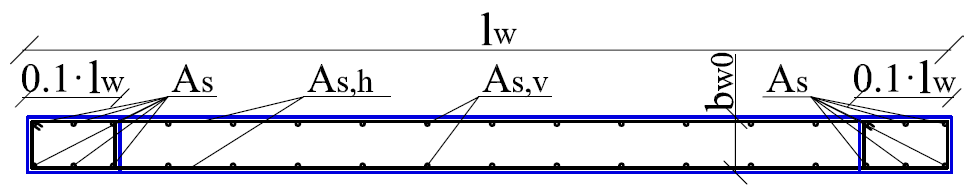 Figure 10: Reinforced concrete wall section
3.3. Reinforced Concrete Beams and Columns Design Theory
Bending reinforcement of beams is designed according to MEd according to [13– 18].
MEd=b·λx·fcd·(d-λx/2)= As·fyd·z [kNm] (25)
m=MEd/(b·d2·fcd) (26)
z=d-λx/2=d-d·(1-(1-2m)0.5)/2 [mm] (27)
As,min = min{0.26·fctm/fyk·b·d; 0.0013·b·d} (28)
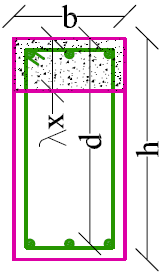 Figure 11: Reinforced concrete beam section
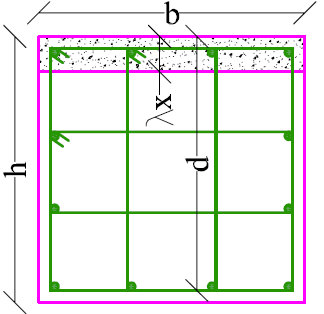 Figure 12: Reinforced concrete column section
As is the minimum reinforcement area for beams. λx is the beam section compressed area height [16]. fctm =2.6N/mm2 is the medium value of the concrete tensile strength. Columns bending moment is calculated using according to [18]. γRd =1.2 is the steel stiffening factor for DCM (medium ductility buildings) [18], ΣMRc and ΣMRb are the sums of bearing bending moments of columns and beams near a frame joint. The longitudinal reinforcement percent for columns minimum value is pmin = 1% and the maximum is pmax = 4% [18]. If λx<2·as, AS will be determined from (32), and from (33), if λx≥2·as. NEd is the axial force in the calculated columns [16]. Here as=45mm.
ΣMRc ≥ γRd ·ΣMRb [kNm] (29)
p=As/(b·d)·100 (30)
x=NEd/(b·λ·fcd) [mm] (31)
As=[MEd-NEd(d-as)/2]/[fyd·(d-as)] [mm2] (32)
As=[MEd+NEd(d-as)/2-b·λx·fcd(d- λx/2)]/[fyd(d-as)] (33)
4. Results for the Elastic Stage Analysis
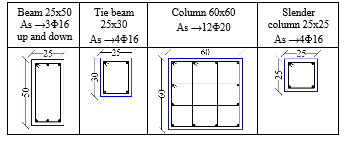
For all 3 solutions, element dimensions and longitudinal reinforcement in beams, tie beams, columns and slender columns are seen in Table 1. As is the longitudinal reinforcement area. The bars are seen as black discs and the diameter (Φ) of bars (in mm) is written for each element.
Table 1: Element dimensions and longitudinal reinforcement in beams, tie beams, columns and slender columns
 4.1. Results for Walls for Solution 1
Efforts in confined masonry walls are seen in Table 2. P1, P2 and P3 are the wall labels from Figure 1. For walls P3 it is necessary to place horizontal reinforcement bars. In Table 2, Asw : 2Φ (8)10/15 means 2 bars of (8mm)10mm diameter placed at every 15cm in the masonry wall and S1, S2 and S3 mean story 1, 2 and 3.
Table 2: Confined masonry walls efforts
| P1 | P2 | P3 | |||||||
| NEd [kN] | MEd [kNm] | MRd [kNm] | NEd [kN] | MEd [kNm] | MRd [kNm] | NEd [kN] | MEd [kNm] | MRd [kNm] | |
| S3 | 207 | 19 | 529 | 178 | 165 | 1406 | 271 | 795 | 3409 |
| S2 | 482 | 124 | 734 | 355 | 541 | 1689 | 542 | 2547 | 4309 |
| S1 | 730 | 312 | 912 | 532 | 1063 | 1918 | 812 | 4640 | 5192 |
| VEd [kN] | VRd [kN] | Asw [] | VEd [kN] | VRd [kN] | Asw | VEd [kN] | VRd [kN] | Asw | |
| S3 | 17 | 179 | 0 | 102 | 167 | 0 | 486 | 749 | 2Φ8/
150 |
| S2 | 78 | 289 | 0 | 201 | 238 | 0 | 859 | 945 | 2Φ10/
150 |
| S1 | 97 | 388 | 0 | 230 | 309 | 0 | 904 | 1053 | 2Φ10/
150 |
4.2. Results for Walls for Solutions 2 and 3
For solution 2 and 3, the elastic stage design results for the reinforced concrete walls are seen in Table 3. Walls P4, P5 and P6 are mainly subjected to bending moments. The minimum horizontal reinforcement required by the code is enough to bear the shear forces. P5 and P6 have the same dimensions, so they are both calculated with the same sectional efforts.
Table 3: Elastic stage design results for the reinforced concrete walls
| P4 | P5 and P6 | |||||||
| NEd [kN] | MEd [kNm] | MRd [kNm] | AS
|
NEd [kN] | MEd [kNm] | MRd [kNm] | AS
|
|
| S3 | 335 | 1183 | 2815 | 6Φ12 | 138 | 242 | 536 | 8Φ25 |
| S2 | 667 | 3587 | 4771 | 6Φ12 | 278 | 1131 | 1154 | 8Φ25 |
| S1 | 984 | 6676 | 7297 | 6Φ25 | 418 | 2021 | 2136 | 8Φ25 |
| lw | t | As,v | As,h | lw | t | As,v | As,h | |
| 6.9m | 0.25m | 2Φ14/
350 |
2Φ12/
250 |
1.9m | 0.25m | 2Φ14/
350 |
2Φ12/
250 |
|
| VEd [kN] | VRd,ww [kN] | VRd,h [kN] | VEd,s [kN] | VEd [kN] | VRd,ww [kN] | VRd,h [kN] | VEd,s [kN] | |
| S3 | 501 | 4139 | 863 | 2054 | 151 | 1139 | 628 | 1178 |
| S2 | 933 | 4139 | 1728 | 2745 | 340 | 1139 | 627 | 2096 |
| S1 | 1123 | 4139 | 1541 | 5118 | 438 | 1139 | 490 | 2194 |
5. Nonlinear Analysis Results
5.1. Nonlinear Analysis Results for Solution 1
The two pushover cases used for the building’s nonlinear analysis for the first solution are PX and PY. The plastic hinges development for both nonlinear cases are seen in Figures 13 and 14. The color code is the following: B (green) means the plastic hinge is formed, C (light blue) means the plastic hinge reaches the limit and the element gives out, D (pink) means the load was redistributed and E (red) means collapse. Those colors seen in Figures 13 and 14 show the pushover analysis last steps. For case PX, at step 70, the plastic hinges reach collapse stage at the bottoms of all columns in the center and slender columns in walls on both directions. The same stage is reached by the hinges in the short beams connecting walls on direction X at the top stories. There are hinges developed to stages D in the long beams close to the building edges on X.
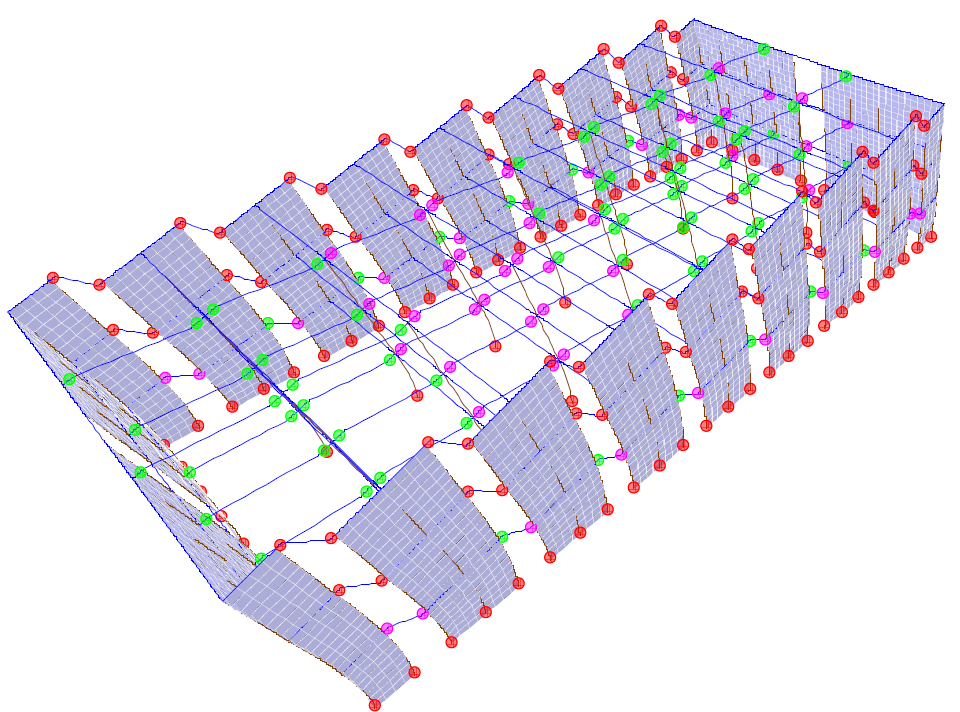 Figure 13: Plastic hinges: PX step 70
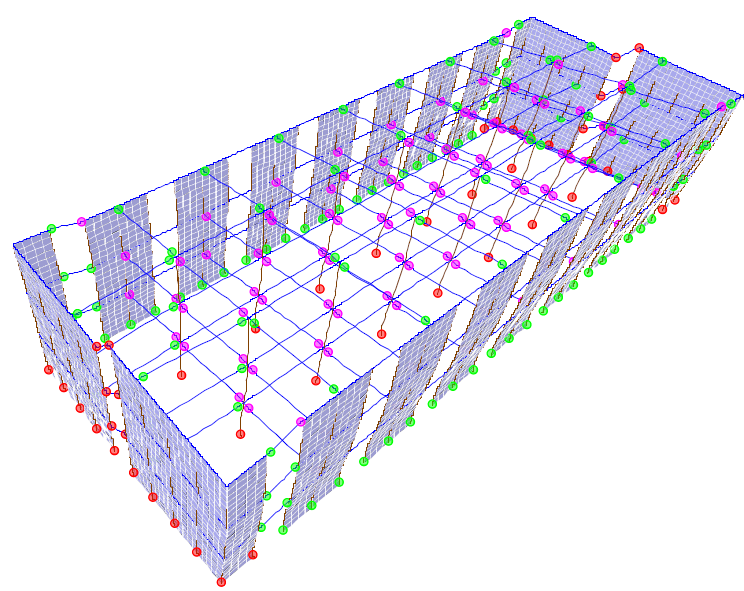 Figure 14: Plastic hinges: PY step 72
Plastic hinges in stage B are seen in all the other beams and columns. On direction Y, at step 72, plastic hinges reach stage E at the bottoms of slender columns in walls on Y and in the beams that connect these walls.
Also hinges in stage E appear at the bottoms of walls close to those on Y and at the bottoms of columns in the center. Hinges in stage D are seen in beams on direction Y. It is important to notice that for case PY, the walls on X are bended as they are slender, so no plastic hinges develop to stage E at their bottoms. For case PX, on the other hand, walls on direction Y do develop plastic hinges, as they are stiff. In both cases, plastic hinges reach collapse in the walls on the same direction as the nonlinear case. The same stage is reached in the beams that connect these walls, and not in the long beams. Efforts are always higher in the beams connecting walls than in frame ones, because walls are stiffer than columns. Stresses in each confined masonry wall are shown in Figures 15 – 20.
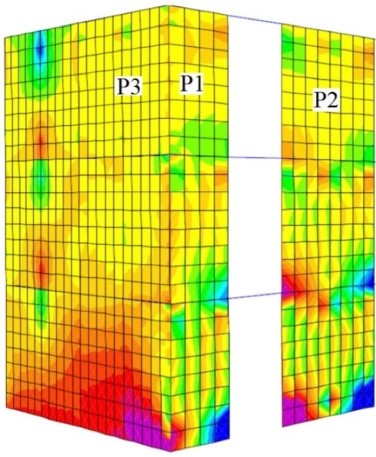 Figure 15: PX step 2 σx =1.5N/mm2
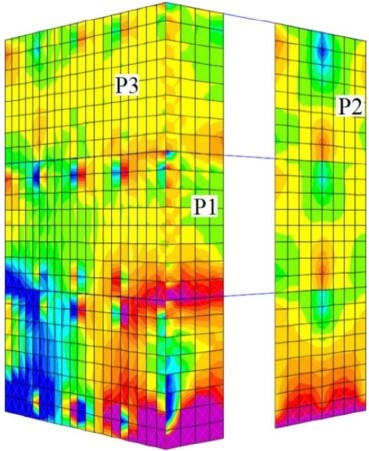 Figure 16 PY step 2 σx=1.5N/mm2
Stresses σx show increased values near the walls base and near the tie beams. The stresses show opposite signs from one side of the walls to the other. This means one side of each wall is stretched and the other is squashed. This is due to the horizontal direction of the stress. Beams and tie beams bring high stress values to the walls. They are stiffer than masonry walls and they transmit both vertical and horizontal efforts to the walls. The highest stress values are seen in P3, those walls are subjected to higher seismic loads because they are stiffer and fewer.
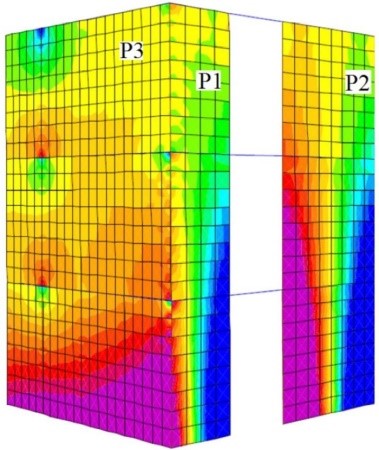 Figure 17: PX step 2 σz=3N/mm2
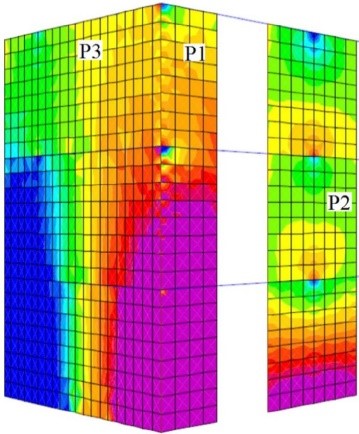 Figure 18: PY step 2 σz=3N/mm2
Stress σz reaches important values at the walls base. At the bottom edges of walls on the same direction as the nonlinear case there are opposite sign stresses. This is because the walls are subjected to axial stress but also horizontal loads from the nonlinear load cases.
Stress values reach comparable values at the same walls height. In the walls perpendicular to the load case direction there are high stress values at the bottoms. Slender walls on X are completely cracked at the bottom. Stresses τxz reach the highest values in the masonry walls panels at the walls lowest stories, as the walls are designed as fixed at the bottoms. Near the tie beams or slender columns, the stresses are taken less by the masonry and more by the confining elements. The highest stress values are reached in walls on direction Y.
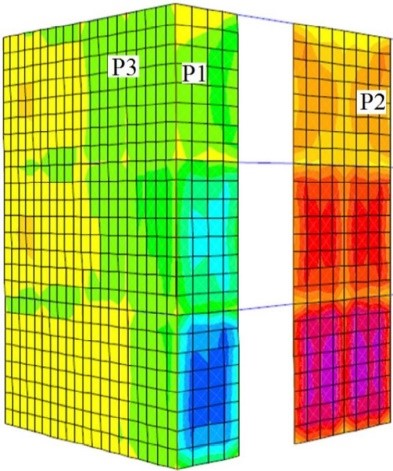 Figure 19: PX step 2 τxz=0.5N/mm2
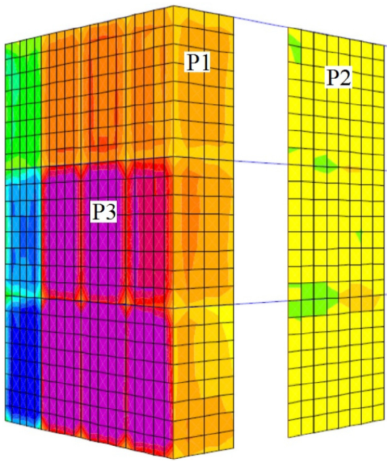 Figure 20: PY step 2 τxz=0.5N/mm2
All stresses surpass the strength values from step 2 of the analysis. The masonry is cracked before the full plastic mechanism is formed. It is clear that walls on direction Y have higher loads to bear compared to those on X.
5.2. Nonlinear Analysis Results for Solutions 2 and 3
For the second solution, the plastic hinges stages and distributions when the plastic mechanism is reached are seen in Figures 21 and 22. PX C1 and PY C1 are the static nonlinear load cases for the structure in witch walls labeled P3 are made of reinforced concrete and renamed P4, for the second solution. Cases PX C2 and PY C2 are used for the third structure solution, where wall P4 is replaced by 2 small reinforced concrete walls P5 and P6, connected by beams.
For the second solution, the plastic mechanism is formed in very much the same way as for the first one.
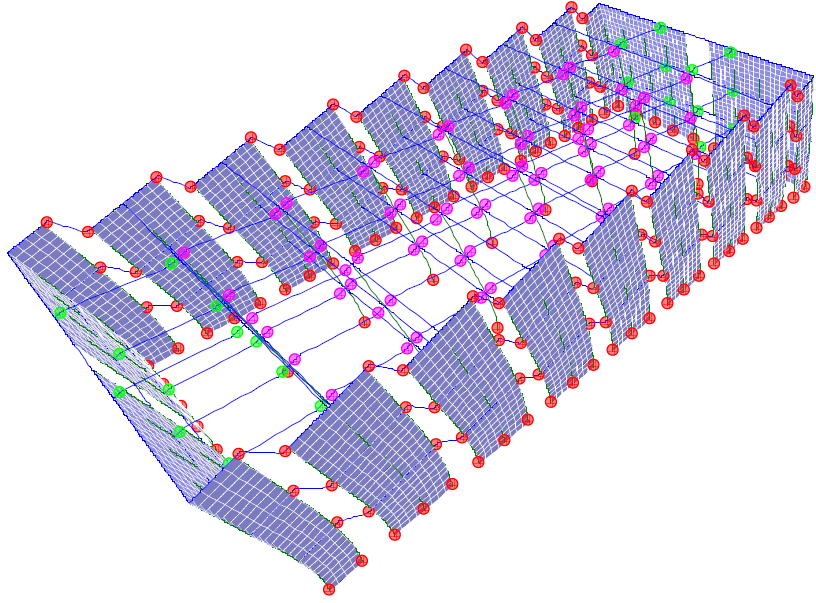 Figure 21: Plastic hinges: PX C1 step 30
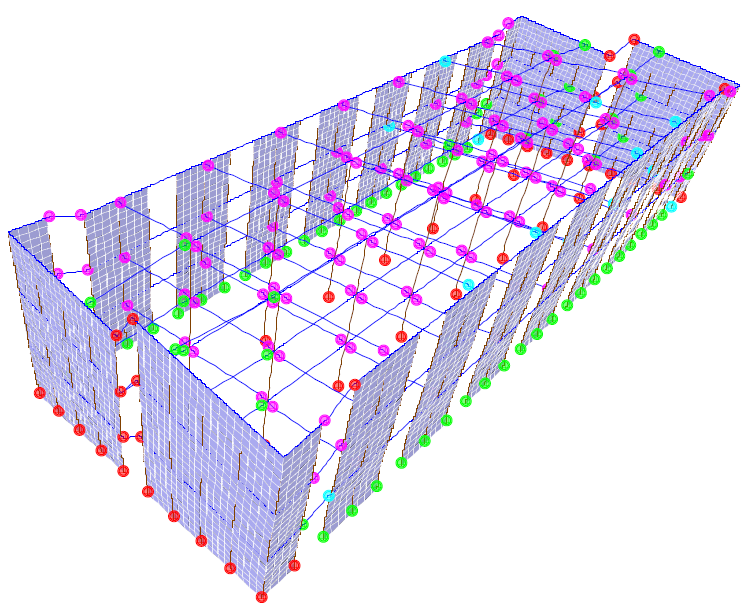 Figure 22: Plastic hinges: PY C1 step 22
There are fewer steps for the nonlinear analysis for both directions. Reinforced concrete walls labeled P4, are subjected to higher stresses, especially for case PY C1. This is because they are the main load bearing elements on direction Y.
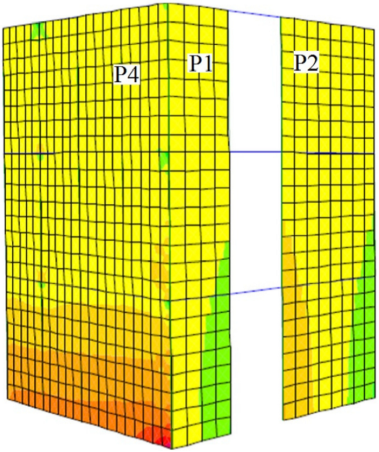 Figure 23: PY C1 step 2 σz=50N/mm2
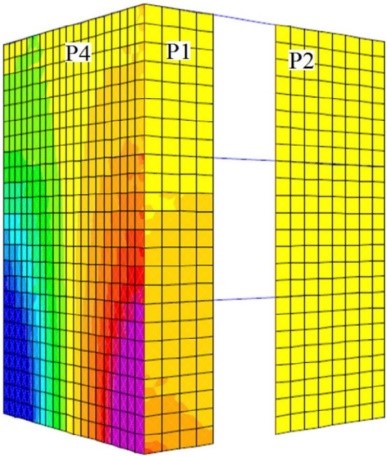 Figure 24: PY C1 step 2 σz=50N/mm2
On this direction, at step 2 of the analysis, the reinforced concrete design compression strength fcd is surpassed up to the third story. At base, the concrete walls are completely cracked. The damaged area was not as extended if confined masonry walls P3 were used. Although the masonry strengths are much lower than that of concrete, the stresses are much smaller and more evenly distributed among the masonry walls. This behavior is not the same for direction X, because stresses on this direction are taken mostly by the confined masonry walls on X. Concrete walls are corner cracked early in the analysis.
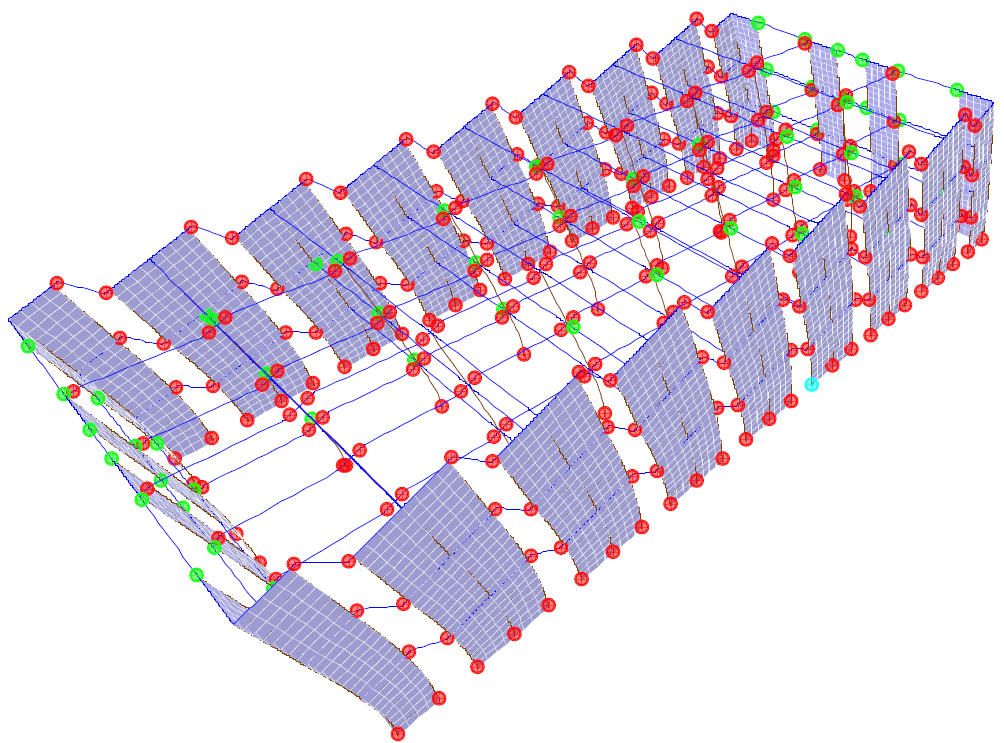 Figure 25: Plastic hinges: PX C2 step 29
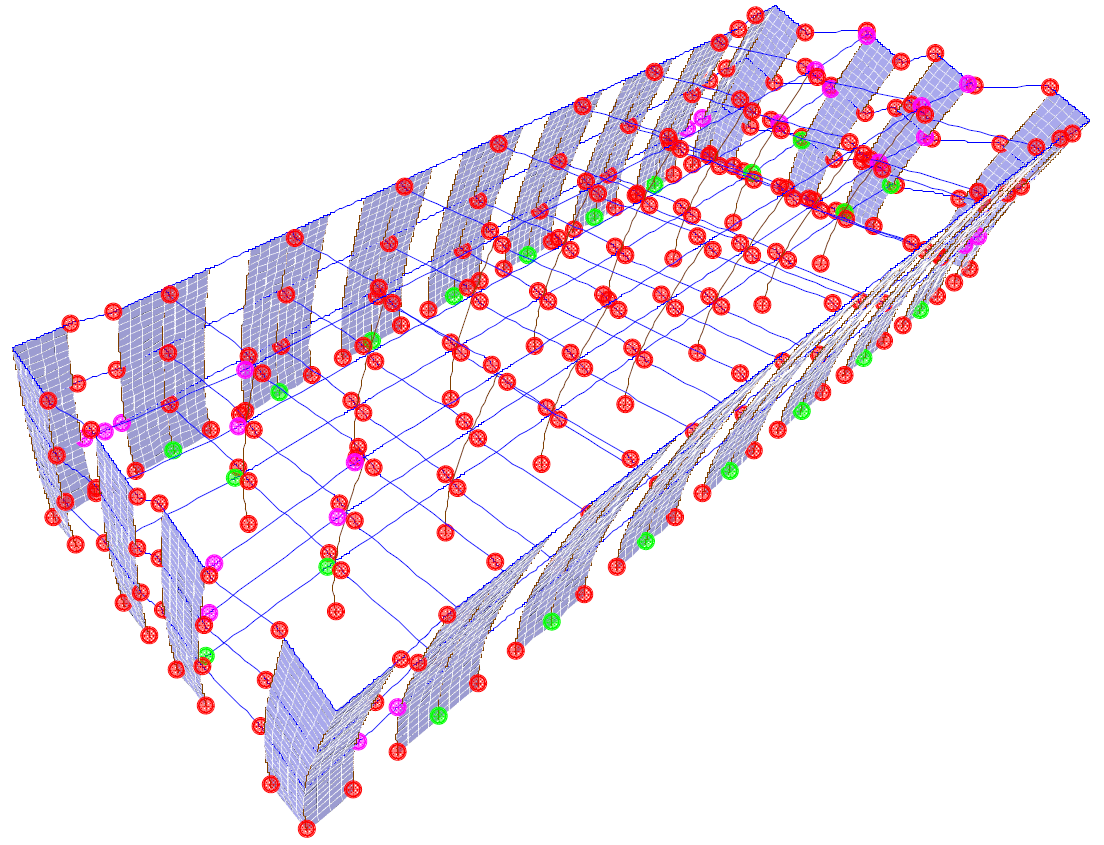 Figure 26: Plastic hinges: PY C2 step 93
The third solution uses 2 reinforced concrete walls instead of wall P4, as seen in Figure 5. This will assure a less stiff behavior on direction Y, as the 2 concrete walls are slender but they can bear the loads they are subjected to. Of course, the new concrete walls are designed according to the sectional efforts from the load combination. This solution is also studied in the plastic state, by using the nonlinear cases PX C2 and PY C2. Hinges development at the final stage is seen in Figures 25 and 26. Most hinges are in stage E when the maximum displacement considered (100 cm) is reached. These hinges are equally distributed, at the beams ends and at the walls bottoms on each direction. For both cases PX C2 and PY C2 concrete walls reach greater stresses than the masonry ones. The differences in values are seen particularly for direction Y, because concrete walls are on that direction. It is seen that for this third solution, the use of more concrete walls makes the corner cracking area much smaller than for the second solution. This is expected, because walls are less stiff and attract smaller effort values.
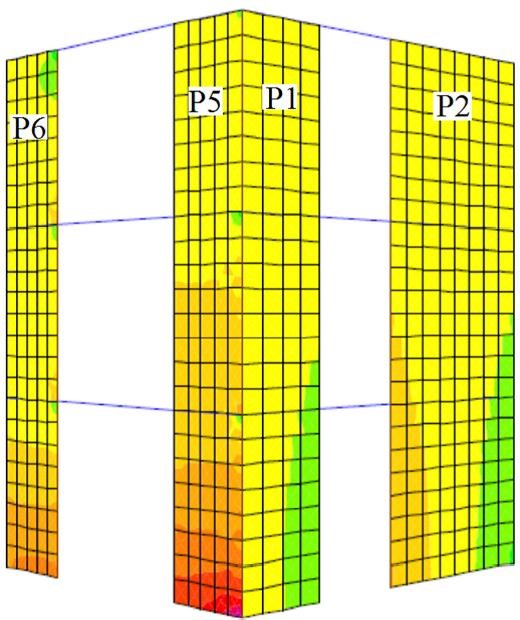 Figure 27: PX C2 step 2 σz=50N/mm2
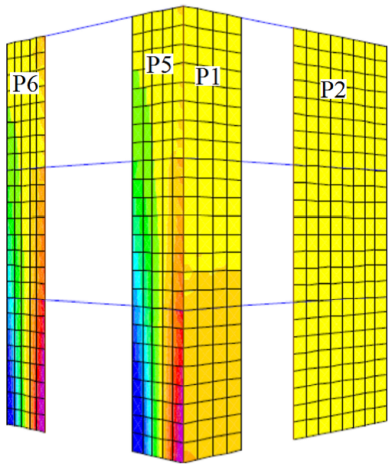 Figure 28: PY C2 step 2 σz=50N/mm2
5.3. Pushover Diagrams
The pushover diagrams for the 6 pushover cases are shown in Figure 30. The analysis is preformed until the displacement 100cm. This is enough for the structures to reach the plastic stages for all pushover cases.
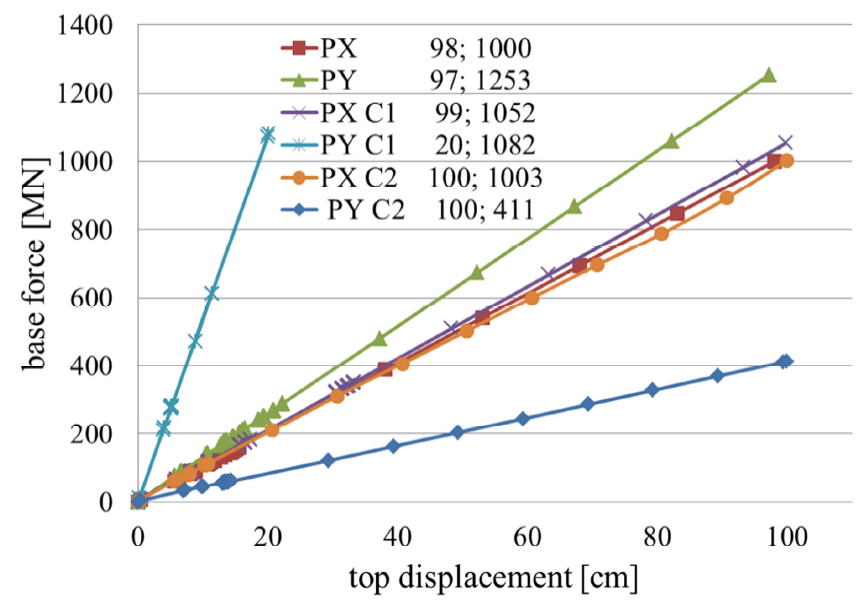 Figure 29: Pushover diagrams for all 3 structural solutions
In figure 29, the displacement values are 98, 97, 99, 20 and 100 cm. They are followed by the base force values. In the first case, when only confined masonry walls are used, there are a lot of small steps for both PX and PY diagrams at the beginning of the analysis. This means a lot of nonlinear hinges are formed in the structure, or hinges already formed advance to the next stage. However, the building’s rigidity is maintained the same, the pushover diagrams are straight lines. Towards the end of the analysis, the steps are widely spaced. This means that more base force and displacement increase is necessary to advance the plastic hinges to the next stages. The structure is stiffer for case PY, because there are 4 long walls (P3) on direction Y. These walls are stiffer than the 18 short walls on X. The walls stiffness is created not by the sum of walls areas but mostly by each walls length on that direction. The building rigidities are 10.2MN/m for PX and 12.9MN/m PY. They are calculated as base force/displacement. For solution 2, when reinforced concrete walls (P4) are used on direction Y, the impact of these walls is less seen on direction X in pushover curve PX C1. This diagram shows the building is capable of large displacement, the same as in the previous case. The analysis steps are spaced differently. There are some groups of steps very close to each other, and there are some steps spaced apart. The structure’s rigidity is maintained, as the pushover curve is a straight line. It is seen that for PX C1 the building is slightly stiffer than for PX. Rigidity for PX C1 is 10.6NM/m. The reinforced concrete walls do have an effect, although they are placed on the other direction. For case PY C1 the building behaves completely different than in all other cases. The plastic mechanism is reached for a much lower displacement. The stiffness is very high: 54,1MN/m. The long reinforced concrete walls have a huge impact on the building’s behavior.
For solution 3, when 2 small reinforced concrete walls (P5 and P6) are used instead of P4, PX C2 shows the same behavior pattern as PX. For PY C2, the building shows a very low rigidity (4.11MN/m), compared to PY. This means that P5 and P6, although they are reinforced concrete, they are less stiff than confined masonry wall P3.
6. Conclusions
The building behaves well both in the elastic and plastic state if all walls are made of confined masonry and also if 2 reinforced concrete walls are used instead of each long confined masonry wall on direction Y. For the first solution, masonry walls on direction Y have greater efforts as they are stiffer and the walls area on Y is half the one on X. They need horizontal reinforcement to bear shear forces, while no such reinforcement is needed for walls on X. The failure mechanism allows great lateral displacements for both directions. For the second solution, when there are 4 long reinforced concrete walls on Y, the building behaves stiffer. Walls P4 are subjected to high efforts and important damage at smaller displacements in case PY C1. Both first and third solutions are good, but the first solution is recommended. This is because all walls are made of confined masonry and they behave similarly.
Conflict of Interest
The author declares no conflict of interest.
- M. Kaluza, “Analysis of in plane deformation of walls made using AAC blocks strengthen by GFRP mesh” International Conference on Analytical Models and New Concepts and Masonry Structures (AMCM) 2017 Elsevier Procedia Engineering Vol 14. p 393-400, 2017. doi:10/1016/j.proceng.2017.06.229
- C. Cornado, J.R. Rosell, J. Leiva, C. Diaz, “ Experimental study of brick masonry walls subjected to eccentric and axial load” International RILEM Conference on Materials, Systems and Structures in Civil Engineering Conference segment on Historical Masonry Technical University of Denmark, Lyngby, Denmark p 33- 40, 2016. www.rilem.net/publications/ proceedings-500218
- J. J. Perez-Gavilan, L. E. Flores, A. A. Mazano, “New Shear Strength Design Formula for Confined Masonry Walls: Proposal to the Mexican Code” tenth U.S. National Conference on Earthquake Engineering, Frontiers of Earthquake Engineering (10 NCEE) Anchorage Alaska, 2014. https://www.eeri.org/products-page/national-conference-on-earthquake-engineering/10th-u-s-national-conference-on-earthquake-engineering-frontiers-of-earthquake-engineering-proceedings-thumb-drive/
- K. Yoshimura, K. Kikuchi, M. Kuroki, H. Nokana, K. Tae Kim , R. Wangdi, A. Oshikata, “Experimental study for developing higher seismic performance of brick masonry walls” 13th World Conference on Earthquake Engineering Vancouver, B.C., Canada; 2004 paper No. 1597, 2004. https://www.iitk.ac.in/nicee/wcee/thirteenth_conf_Canada/
- A. Marinilli, E. Castilla,” Experimental evaluation of confined masonry walls with several confining columns” 13th World Conference on Earthquake Engineering Vancouver 2004, B.C., Canada; paper No. 2129, 2004. https://www.iitk.ac.in/nicee/wcee/thirteenth_conf_Canada/
- D. H. Liu, M. Z. Wang, “Masonry structures with beams and columns” 12 World Conference on Earthquake Engineering (WCEE) Auckland, New Zeland paper 2720, 2000. http:// www.worldcat.org/title/12wcee-2000-12th-world-conference-on-earthquake-engineering-auckland-new-zealand-sunday-30-january-friday-4-february-2000
- A. T. Vermeltfoort, D.R.W. Martens, “Preliminary Tests on the Lateral Load-bearing Capacity of Slender Masonry Walls 13th Canadian Masonry Symposium Halifax, Canada, 2017. https:// www.canadamasonrydesigncentre.com/symposiums/13th-canadian-masonry-symposium/13th-cms/
- M. Dhanasekar, “Shear in Reinforced and unreinforced masonry: response, design and construction. The 12th East Asia-Pacific Conference on Structural Engineering and Construction. Elsevier Procedia Engineering 14 2069-2076, 2011 doi:10.1016/j.proceng.2011.07.260
- K. Leng, C. Chintanapakdee, T. Hayashikawa “Seismic Shear Forces in Shear Walls of a medium Rise Building By Response Spectrum Analysis” Engineering Journal Volume 18 Issue 4, 2014. http://dx.doi.org/10.4186/ej.2014.18.4.73
- PNaik, S. Annigeri, Performance evaluation of 9 story RC building located in North Goa. 11th International Symposium on plasticity and Impact Mechanics, Implast 2016 Elsevier Procedia Engineering 173 (2017) 1841 -1846 doi:10.1016/j.proceng.2016.12.231
- H. Akiyama, M. Teshigawara, H. Kuramoto, F. Kumazawa, Y. Inoue, K. Watanabe “Development and structural design guideline for medium/high rise RC wall-frame structures with flat beams” 13th World Conference on Earthquake Engineering Vancouver, B.C., Canada; 2004, paper No. 2354, 2004. https://www.iitk.ac.in/nicee/wcee/thirteenth_conf_Canada/
- CEN EN 1996-1-1-2006 Eurocode 6: Design of masonry structures – Part 1-1: General rules for reinforced and unreinforced masonry structures, 2006.
- CEN EN 1991-1-1-2004 Eurocode 1: Actions on structures – Part 1-1: General actions- Densities, self-weight, imposed loads for buildings, 2004.
- CEN EN 1990-2004 Eurocode 0: Basics of structural design, 2004
- CEN EN 1991-1-3-2005 Eurocode 1: Actions on structures – Part 1-3: General actions- Snow loads, 2005
- CEN EN 1992-1-1-2004 Eurocode 2: Design of concrete structures – Part 1-1: General rules and rules for buildings, 2004.
- CEN EN 1998-1-2004 Eurocode 8: Design of structures for earthquake resistance. Part 1: General rules, seismic actions and rules for buildings, 2004.
- P100-1/2013 Seismic design code – Part 1- General rules for buildings, 2013
- CR 2-1-1.1/2013 Reinforced concrete walls buildings design code, 2013