cv4sensorhub – A Multi-Domain Framework for Semi-Automatic Image Processing

Adv. Sci. Technol. Eng. Syst. J. 3(6), 159–164 (2018);
 DOI: 10.25046/aj030620
Although there are many research domains with very good software support and workflow automation, there are even more which do not have it: software development is too expensive to create domain specific applications for every research topic. This leaves many domain experts to work for example with general purpose image processing and statistics tools. Many research ideas get even omitted as requiring unfeasible much manual work. This paper presents a multi-disciplinary image processing software framework called cv4s (cv4sensorhub). Its aim is to create an environment where reusable components make development of domain specific image processing software solutions easier, and thus, more feasible. The paper presents the basic architecture of the framework and two example applications: GrainAutLine which is for analysis of microscopy images of marble, sandstone and schist thin sections, and ChemoTracker which is designed for the motion analysis of white blood cells. As many image processing operations are relatively domain independent, the possible application areas are not limited to petrographic and medical images processing.
1. Introduction
Image processing is an area of computer science with a very wide range of possible application areas. Beside the classic directions there are lots of interdisciplinary application areas where the software supported workflow automation is much less common and the domain specific software development is too expensive to be feasible. In order to apply state-of-the-art image processing in these areas, a software framework with the following properties is needed:
- The framework has to provide reusable software components, so that domain specific software solutions can be created much faster and thus cheaper, than by starting from scratch. It has to provide the necessary elements for the rapid integration of state-of-the-art image processing methods, and an environment for convenient R&D experimentations.
- It has to provide a user interface to allow professionals with less IT related skills to test and use the resulting techniques. As we cannot expect these professionals to get used to a scientific computing environment and its user interface, we need to provide a state-of-the-art user interface similar to common applications.
- The framework needs to emphasize the support for semi-automatic image processing which involves significant user interaction into the image processing operations. This is essential in many application domains where either very high accuracy is required, or the users simply do not necessarily trust a fully automatic solution. This means that many operations have to be designed so that the user has full control over the results: all automatic suggestions can be overridden by the user before finalizing it.
- Both the underlying techniques and the user interface has to be highly customizable, so that they can be accommodated to the application domain. This includes for example hiding irrelevant functions, or to adapt visualization and color schemes to other well-known expert systems.
There are interdisciplinary areas with enough resources for large-scale software development projects like many medical image processing tasks and geo-information (GIS) systems. But there are lot more which do not have. The goal of our cv4s project (http://bmeaut.github.io/cv4sensorhub/) is (1) to create a framework meeting the requirements mentioned above, and (2) to create domain specific applications for interdisciplinary areas where the software-based process automation could have very significant impact.
In this paper we present the core architecture and features of the framework, and two domain specific applications built over it. The first application is GrainAutLine aiming for the semi-automatic segmentation and analysis of marble, sandstone, and schist thin section images. The second is ChemoTracker aiming for the semi-automatic tracking of white blood cells in microscopy image sequences.
Both applications emphasize the high accuracy requirements mentioned before: the results of the automatic operations are only suggestions which can always be checked, and if necessary, modified by the user. During the research and development of the application, it shows a smooth transition from the initially almost fully manual operation to a very high level of automation needing very few user interaction. But the user still has the option to fall back to the manual operation if necessary, for example due to bad imaging conditions.
The research questions this paper focuses to answer are the following:
- Is the proposed data model suitable for creating software support for multiple domains? If it is, it allows creating a set of reusable software components which are easy (and thus fast) to build upon, making the process automation feasible.
- How far can the involvement of software engineers improve the workflow in terms of speed, result quality and reliability. This question is also important from a research planning and management point of view, as many research topics located far from software engineering could significantly benefit from it.
In the remaining parts of the paper, after an overview of related work, first we present the core functionality and architecture of the framework. Then we show the way GrainAutLine and Chemo Tracker was created by customizing and extending it, and finally, conclusions are summarized.
2. Related work, levels of software support
Previous work related to this project can be observed from two directions: the theoretical research results related to the tasks the GrainAutLine and ChemoTracker applications aim for, and the already existing software solutions available for these problems.
From the theoretical side, both of these applications perform image segmentation which is a very rich and well researched topic [1]. GrainAutLine extends this with shape recognition [2] and ChemoTracker applies motion tracking [3].
Starting from the application side, the options are much more limited: if a researcher who’s domain is far from information technology needs image processing, the most common option is to use a general purpose image manipulation program like PhotoShop and Gimp. As these software are not specialized in research domains like material or medical technology, their applicability is limited. It often needs time consuming manual steps and corrections in the workflow, even if some important steps are automated.
The next level is achieved if one can use a more domain specific software package, like the one of some microscope manufacturers who provide software solutions with their devices. In this case, many steps can be automated, except the ones too specific to the current research. For example if someone needs to count the number of neighbors for every grain, and that is not supported by the software, the solution gets problematic.
The next step is achieved if the researcher can use the scripting features of highly customizable (or programmable) tools like ImageJ (https://imagej.net/). In these cases, significant part of the process can be customized and the required amount of programming skills can be learnt relatively fast. It should be noted that ImageJ’s manual tracking plugin was used before Chemo Tracker has been developed.
The level of software support we are investigating in our research is the result of the integration of two teams: the one of the target domain and a software engineering team. Although learning to speak the language of the other and cooperate smoothly takes time, the two sides will learn what is easy, hard, important or useless for the other side. If it works, the domain experts can tell what they need, and the software engineers make the software support it as much as possible. End-to-end workflow support means for example from downloading the images from the microscope to generating the reports and diagrams ready for publication. This goal is what the eScience Center in the Netherlands is also aiming for
3. Core functionality
The cv4s framework is a .NET based system using the OpenCV [4] computer vision library, a stand-alone component of the SensorHUB [5] data collection and processing system. The architecture of the system is visualized in Fig. 1. The core data model is modified by the operations and visualized by common user interface (UI) functions. Derived data is a cache of information derived from the core data model and frequently used by operations. The communication and persistence component is responsible for supporting several input and output, various reporting formats. The topmost layer is the domain specific application built over the reusable components.
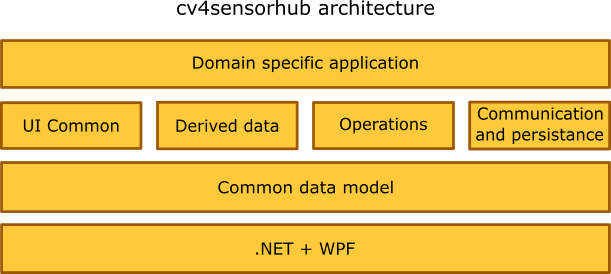 Figure 1: Layers of the cv4sensorhub framework.
3.1. Data model
The data model is organized around a set of entities with the following subtypes: polygons, polylines, single points, and raster images. Raster images are usually used as the original input, and the result usually consists of a combination of polygons and further information attached to them as tags. The tagging system allows adding key-value pairs to any entity. A simple tag like “selected” may have irrelevant value, but tags like “ID”, “groupID”, or “parentID” utilize the value of the key-value pair as well. As the tags are heavily used by the operations, the system provides a tag based indexing to accelerate the search for entities with given tags or tag-value pairs.
Based on our experiences, this data model is sufficient to describe all necessary information we had to manage so far. Beside the input as raster images and the segmentation results as polygons, the tagging system allows for the representation of the following:
- Simple selection of entities either by the user or by an operation via adding the “selected” tag.
- Hierarchies using unique “ID” tag values for every entity and “parentID” tags to store the relationships. This is a way for example to match the occurrences of the same cell in a sequence of microscopy images.
- Entity groups by using “groupID” tags, like grains with same type, or cells with similar motion speed.
3.2. Derived data
There are several information which can be derived from an entity and may be often needed by the operations. Derived data are data collections associated with entities which are cached and kept up-to-date whenever the corresponding entity changes. For example a derived data set contains the up-to-date bounding box for every entity. The most important features are the following:
- Bounding boxes
- Bounding box distances: Manhattan distance between the bounding boxes of every entity pair. This can be used to quickly retrieve all entities in the proximity of a given one.
- Distance maps: the distance transform results for the image of the corresponding entity. This allows very fast retrieval of the Euclidean distance between a given point and the nearest point of the entity.
- Exact distances: Euclidean distance between the nearest points of every two entities. This can be used to retrieve all neighbors of a polygon within a given distance limit.
- Neighbors: the list of direct neighbors for all entities. This can be used for example to retrieve the number of grain neighbors.
3.3. Operations
A significant set of operations is related to directly manipulating the entities from the user interface, while the remaining ones offer more complex operations. The most important operations for editing the entities:
- Polygon and polyline drawer and modifier operations allowing direct modifications. They are designed for easy and fast usage: a single mouse stroke across polygons allows merging or slicing them. If the automatic image processing can guess most boundaries correctly, there is no need to manually mark them, the user only needs to quickly spot the mistakes and give the software a hint to fix that.
- Mover operation allows the movement of a whole entity, for example an inaccurate detection of a blood cell.
- A generic tool to change the tags of a given entity. In a customized application, this can be used for example as a grain selection tool by manipulating a “selected” tag.
- Z-Index modifier: as described later, the visualization uses the “ZIndex” tag to decide which polygons are above the others. This tools allows moving a polygon to the front or to the back.
These were the most common user interface tools. Some more complex ones are the following:
- Edge detector: an image segmentation tool using the Canny[6] edge detector to create new polygons.
- Polygon simplifier: simplifies the boundary of the selected polygons by removing noise.
- Color detection based on the histogram of some manually marked areas. This can be used for example to detect painted porosities in sandstones or concrete sections.
- Smart region growing to extend polygons to cover whole grains, even in the presence of textures.
- Thresholding and adaptive thresholding functions.
- Superpixel segmentation to locate small areas with homogeneous color.
- Stitching and other automatic alignment tools to handle series of images and automatically fix their displacements or other alignment errors.
Beside these, the load and save persistence functions are also implemented as operations. For convenient integration with other software solutions, vector image (SVG) export is also available and Shapefile (SHP) export for GIS systems is under development. The latter is implemented because many geosciences use GIS systems and if the image analysis can export its results into such Shapefiles, those can be imported into GIS systems opening up their wide range of shape and topology analysis tools.
The above mentioned operations are provided by the framework as general purpose operations. Customizations for given application domains can define their own tags and additional operations as needed.
3.4. Common user interface functions
Beside the common data model, the cv4s framework provides user interface components which can be used as the central element of customized user interfaces.
The most important user interface element is the viewer which takes care of the visualization of the whole data model. It is meant to be the central editor area of the applications. It allows the operations to capture mouse and keyboard events, and features a customizable visualization of the entities based on their assigned tags, in terms of the appearance engine.
The appearance engine maintains a list of appearance commands which can modify the appearance of an entity like fill color, stroke color and thickness, opacity etc. For example an appearance command can instruct the viewer to set the fill color of every entity having the “selected” tag green. From that point on, as soon as an entity gets this tag as a result of any operation, it immediately turns green. (Appearance commands have priorities to resolve contradicting instructions.) Using the appearance commands, customizations can modify the appearance of entities according to any tags or tag-value pairs, like changing the fill color based on the number of neighbors, marking concave grains, or distinguishing fast moving cells.
Beside the viewer, the framework provides two additional user interface components: one to select and configure the operations to be applied, and one to configure the appearance commands.
If the proposed data model is suitable for a specific domain, then with these components, the developer of a new domain specific application does not have to care about several user interface functions like visualization and manual corrections. They can focus on the special requirements of the domain which makes the development much easier and faster.
3.5. Customization
The primary objective of the framework is reusability and flexibility. The main steps required when creating a new, domain specific application are the following:
- The new applications user interface is built around the viewer control. The operation selection and configuration control is often replaced by a menu bar or ribbon, and the appearance command editor is rarely required as these settings are hardwired in a domain specific setup designed for the end users.
- Used tag names and the corresponding appearance commands are created.
- Domain specific operations not provided by the framework are created. This is the biggest part of the development.
- As the output format of the applications is very different, the framework provides a basic support for statistics and data exporting, but most of these functions should be implemented in the domain specific customizations, usually also in the form of operations.
The plug-in architecture of the operations allows the developers to enhance and experiment with the operations in a very flexible way. Operations created for a given domain but having potential in other domains as well are often merged into the framework as reusable components, so that later projects are even faster to implement.
4. Domain specific customizations and extensions
After introducing the cv4s framework, in this section we present two domain specific applications as customizations and extensions of the functions mentioned before. These applications are now ready to be used by end users which allows us to provide preliminary results obtained using them.
4.1. GrainAutLine
Marble provenancing is an important task in archaeometry: identifying the mine a marble sample originates from is used both in archeology and during the genuinity check of historic artifacts as well [7]. One of the most commonly used features of marbles is the distribution of the grain diameters, or at least its maximum called the Maximal Grain Size (MGS). This is a typical image segmentation task which is especially hard with marble thin section images: a geomorphological process called crystal twinning creates grains with many straight lines inside them as shown in Fig. 2. This phenomena prohibits the convenient use of standard segmentation methods based on edges. In order to achieve a high quality result, we decided to create an application for semi-automatic marble thin section segmentation.
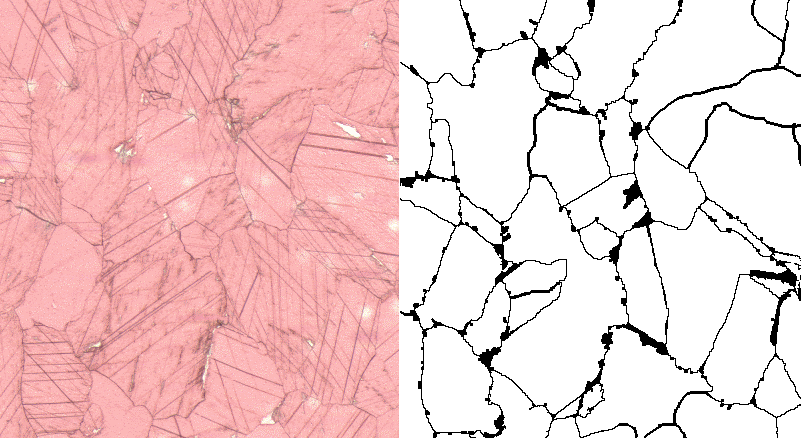 Figure 2: Marble thin section with twin crystals, sample taken from the MissMarble data set [8].
The workflow usually starts with a general purpose image segmentation to retrieve boundary suggestions. Among these, the software tries to identify the twin crystal lines and presents a suggestion for merging several pieces of grains. At this point, the user can review all the suggestions, add further ones or slice some grains into pieces. When finished, the merge and slice operations are performed and the final reports with the grain size histograms can be generated.
The intermediate manual review has two purposes: on one hand it is required to fix the mistakes the automatic methods may have left. On the other hand, this allows the system to gain trust among the users: they still have full control and there is no need to hope that the automatic process will detect everything correctly. With the human help, the results can be free of mistakes.
Even if the still experimental twin crystal detection methods are not sufficiently reliable, the cv4s frameworks merge and slice operations allow the user to work very fast after the initial segmentation.
During the development of GrainAutLine, an additional task came across us regarding sandstones: we need to count how many neighbors a quartz grain has, and create a histogram from these neighbor counts. This is required during the material selection of restoration works as a key indicator of porosity. If the grains have less than 3.45 neighbors in average, the domain experts consider it unsuitable for replacing missing parts of buildings for example. Fig. 3. shows the original image, the retrieved neighborhood graph, and the resulting histogram.
To achieve this, the following operations were added to the GrainAutLine application:
- We use seeded watershed segmentation which needs a marker in every grain. We added an operation to mark the center of large clear areas, but the user gets the possibility to add further ones or modify existing suggestions as needed.
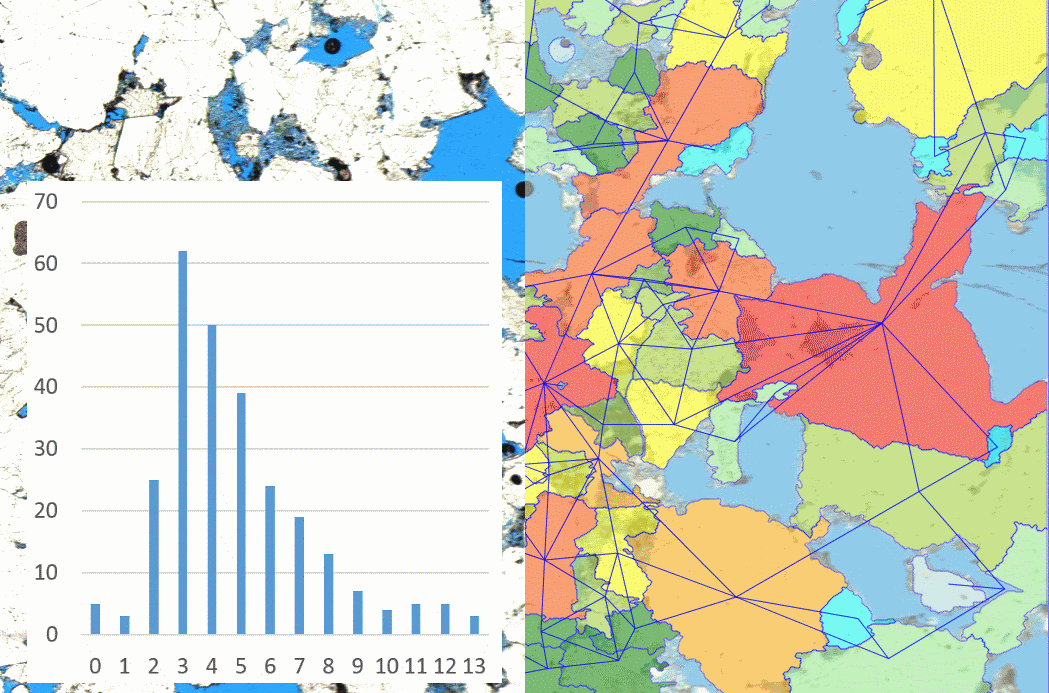 Figure 3: Sandstone image with painted porosities (left background), identified grains with neighborhood graph and neighbor count histogram.
- The watershed segmentation operation is a wrapper of the OpenCV implementation.
- The color marker operation is used to remove the porosity areas. It takes selected polygons as input, learns their color and covers all areas with these colors with additional polygons. These porosity polygons can be subtracted from all other polygons using the subtraction operation of the framework.
- The “neighbors” derived data was already in the framework, we only added an operation showing the graph as an image overlay as seen in Fig. 3. It is only a set of polylines which have the “decorator” tag marking them not to be included in further operations.
- The neighborhood counter operation stores the neighbor number for every polygon in a dedicated tag. This value will also control the color of the corresponding polygons.
- An exporting operation reads the neighbor count tag from every polygon and exports the histogram with a chart into an Excel table for convenience.
The GrainAutLine application is not yet finished, further operations are being developed to reduce the amount of manual work, but it is already suitable for production use. Evaluating the GrainAutLine system in terms of our research goals is not easy. A quantitative analysis would need the monitoring of several users while they use the system. Our experiences until now show that the work can be accelerated even by a factor of 10, but this depends highly on the complexity of the images to process. But even if the automatic tools are less effective, guiding a software with simple mouse strokes is much more convenient and less tiresome than to carefully draw the boundary lines one-by-one.
4.2. Chemo Tracker
The white blood cell tracking application called Chemo Tracker is used for immunology related medical research, in collaboration with the Semmelweis University. Since the accumulation of white blood cells is critical for the development of inflammation, it is important to understand the molecular mechanism of white blood cell migration. This is tested by time-lapse microscopic recording of migration of neutrophils (one type of white blood cells) towards an inflammatory compound [9,10], followed by automated analysis of the movement path of individual cells in microscopy image sequences. This requires the segmentation of a series of images distinguishing between white blood cells and other visual anomalies, and the tracking of the individual cells.
The customization and extension of the framework required the following steps:
- The user interface needs to show the available operations as a convenient ribbon.
- A specialized image segmentation operation was added which can recognize the white blood cells properly. It tries to distinguish them even if they are stuck together.
- As the robotic microscope is observing several samples periodically, its slight positioning errors have to be compensated, so that steady objects in consecutive images do not move.
- The tracking operation takes the polygons of all the images and assigns them to cells, one polygon for every cell from every image which is stored in the data model as a dedicated “CellID” tag. Further operations are available for the ergonomic manual modification of these assignments. If the user sets a polygon to be the successor of another one in the previous frame, the “manual” tag is added to prevent further tracking to override this. The user can achieve the correct tracking by iteratively running the tracking and applying corrections to the results.
- The visualized motion trails of the cells are polylines which get their opacity from a tag value. This tag value is updated whenever the current image index changes.
It should be noted that the main challenges of the tracking are caused by two factors: (1) when the microscope is taking pictures of many samples after each other, the time gap between images is long and the faster cells may move far away from their previous location, sometimes with sharp turns. And (2) the shape of the white blood cells changes significantly between images, so that shape and appearance based identification is near to useless. Fig. 4. shows the user interface of Chemo Tracker.
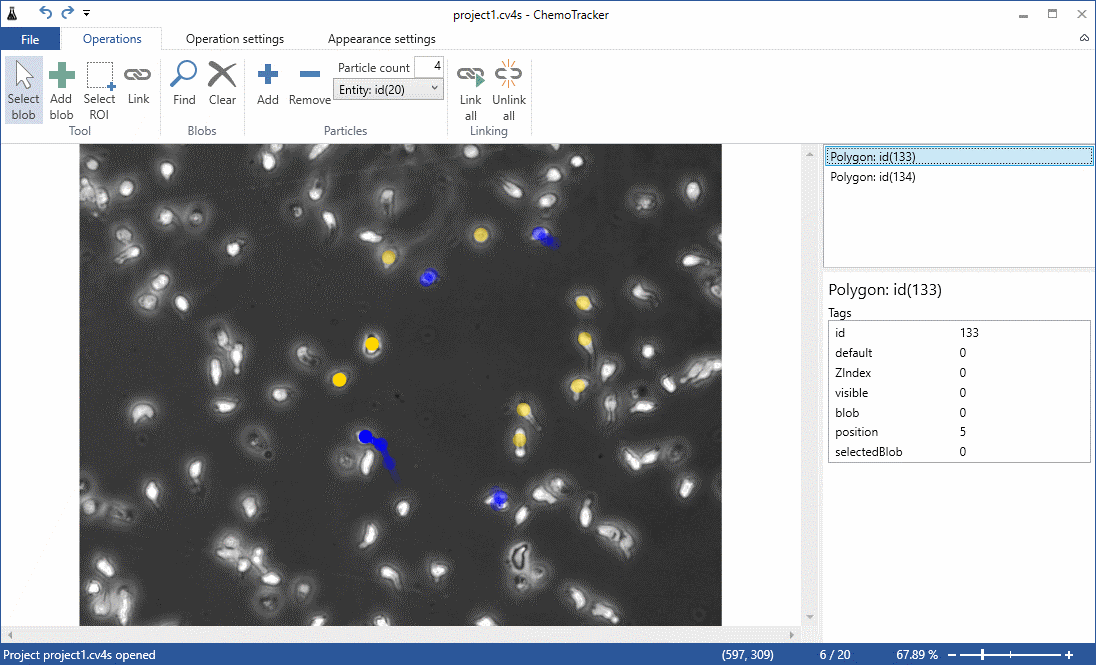 Figure 4: User interface for cell motion tracking in Chemo Tracker
The visualization of the cell motions required a semi-transparent trail. As that one could be added to the data model as a polyline, every required function of Chemo Tracker could fit into the common data model. During evaluation tests, using the ChemoTracker proved to be better than having to click on all cells on all images all day. Although the best way for visualization is still an open question, we estimate a 5-10 factor acceleration. Even if the system is unable to track the fast (and relative unpredictably moving) cells, the manual tracking is much more convenient and less tiresome after the software has marked the cells which it is unsure about.
5. Conclusions
This paper presented the cv4s framework as an environment for creating software solutions to support several research domains utilizing image processing. Beside the core capabilities of the system, two software solutions have been presented which were built over the framework: GrainAutLine and ChemoTracker. Demonstrating the high domain independence of the project, we are investigating collaborations with experts in archaeometry, petrography, construction material analysis, and road fracture evaluation. The basic data representation and plug-in like architecture of the framework proves to be an efficient foundation for these kinds of tasks.
The research questions raised in the introduction were challenging the applicability of the general data model for very different domains which we have proven to be true: both applications could use it without extensions. The second question asked the advantage a combination of domain specific researchers and IT engineers can achieve. We believe that it is significant and collaborations of this kind can open up research directions which have been flagged “unfeasible” until now.
Conflict of Interest
The authors declare no conflict of interest.
Acknowledgment
The authors would like to express their special thanks to Anna Váry, Márton Sebők, and Zsolt Dudás for their software development efforts, Anikó Bere, Zsuzsanna Pató, and Attila Mócsai for the Chemo Tracker cooperation, Zsófia Koma, Balázs Székely, and Judit Zöldföldi for the GrainAutLine cooperation.
This work was performed in the frame of FIEK_16-1-2016-0007 project, implemented with the support provided from the National Research, Development and Innovation Fund of Hungary, financed under the FIEK_16 funding scheme.
- Rafael C. Gonzalez, Richard E. Woods, “Digital Image Processing”, 4th Edition. Pearson, 2017.
- Mark Nixon, “Feature Extraction and Image Processing for Computer Vision”, 3rd Edition, Academic Press; 3 edition, 2012.
- S. Ojha and S. Sakhare, “Image processing techniques for object tracking in video surveillance- A survey” in International Conference on Pervasive Computing (ICPC), Pune, 2015, pp. 1-6.
- G. Bradski: The OpenCV Library. Dr. Dobb’s Journal of Software Tools, 2000.
- L. Lengyel, P. Ekler, T. Ujj, T. Balogh, H. Charaf, “SensorHUB – An IoT Driver Framework for Supporting Sensor Networks and Data Analysis” in International Journal of Distributed Sensor Networks, Vol. 2015, Article ID 454379, 12 pages, 2015.
- J. F. Canny. A computational approach to edge detection. IEEE Trans. Pattern Analysis and Machine Intelligence, pages 679-698, 1986.
- J. Zöldföldi, M. Satir, “Provenance of the White Marble Building Stones in the Monuments of Ancient Troia” in G. A. Wagner, E. Pernicka, E. H. P. Uerpmann (eds.) Troia and the Troad. Springer, Berlin, 2003.
- J. Zöldföldi, P. Hegedűs, B. Székely, “MissMarble, an Interdisciplinary Data Base of Marble for Archaeometric, Art History and Restoration Use” in I. Turbanti-Memmi (ed.), Proceedings of the 37th International Symposium on Archaeometry, Springer-Verlag, Berlin, Heidelberg, 355-361., 2011.
- K. Futosi, T. Németh, R. Pick, T. Vántus, B. Walzog, A. Mócsai, “Dasatinib inhibits proinflammatory functions of mature human neutrophils”, Blood. 2012 May 24;119(21):4981-91. doi: 10.1182/blood-2011-07-369041. Epub 2012 Mar 12., PMID: 22411867
- T. Németh, K. Futosi, C. Hably, MR Brouns, SM Jakob, M. Kovács, Z. Kertész, B. Walzog, J. Settleman, A. Mócsai, “Neutrophil functions and autoimmune arthritis in the absence of p190RhoGAP: generation and analysis of a novel null mutation in mice.”, J Immunol. 2010 Sep 1;185(5):3064-75. doi: 10.4049/jimmunol.0904163. Epub 2010 Jul 30., PMID: 20675588.