Management Tool for the “Nephele” Data Center Communication Agent
Volume 3, Issue 6, Page No 144-150, 2018
Author’s Name: Angelos Kyriakos1,2,a), Thomas Tsavalos1, Dionysios Reisis1,2
View Affiliations
1National and Kapodistrian University of Athens, Electronics Lab, Physics Dpt, GR-15784, Zografos Greece
2Institute for Communication and Computers (ICCS), National Technical University of Athens, Greece
a)Author to whom correspondence should be addressed. E-mail: dreisis@phys.uoa.gr
Adv. Sci. Technol. Eng. Syst. J. 3(6), 144-150 (2018); ![]() DOI: 10.25046/aj030618
DOI: 10.25046/aj030618
Keywords: Graphical User Interface, Data Center, Agent
Export Citations
Optical switching provided the means for the development of Data Centers with high throughput interconnection networks. A significant contribution to the advanced optical Data Centers designs is the Nephele architecture that employs optical data planes, optical Points of Delivery (PoD) switches and Top of Rack (ToR) switches equipped with 10 Gbps connections to the PoDs and the servers. Nephele follows the Software Defined Network (SDN) paradigm based on the OpenFlow protocol and it employs an Agent communicating the protocol commands to the data plane. The current paper presents a management tool for the Agent. The Agent’s management tool is utilized to configure the Agent, create commands, perform step operations and monitor the results and the status. Moreover, as a testing and validation tool, it plays a significant role in the improvement of the Agent’s design as well as in the upgrade of the entire data center’s organization and performance.
Received: 23 July 2018, Accepted: 04 October 2018, Published Online: 04 November 2018
1. Introduction
Currently, the integration of Information Technology (IT) activities and applications takes place in data centers, which also include the necessary devices for communication, high performance computing and data storage. Data centers play an important role in organizations based on IT services, as they provide the means for fast responses to business demands, they facilitate the IT operations and their utilization leads to the reduction of the capital expenditures and the operating costs. Targeting the improvement of data centers, researchers and engineers focus on the use of optical switching due to the bandwidth capabilities that it provides. A significant contribution to this design effort features optical links connected through optical Point of Delivery (PoD) switches to the Top of Rack (ToR) switches, SDN with OpenFlow organization, an Agent connecting the SDN controller and the data plane and an enhanced agent management tool [1], which all integrate in the Nephele [2] data center.
The Nephele is based on a dynamic optical network infrastructure for scale-out, disaggregated datacenters that leverages optical switching with SDN control and orchestration to overcome current datacenter limitations. The Nephele design follows vertical end-to-end development approach extending from the data center architecture to the overlaying control plane and its interface to the application, in order to deliver a fully-functional networking solution, extending network virtualization to the optical layer. The Nephele design achieves dynamic reconfiguration by utilizing the slotted operation of the network based on the Time-Division Multiple Access (TDMA). Moreover, the SDN control can effectively manage the data plane elements. The OpenFlow protocol communicates the SDN control’s messages to the data plane [3]. Nephele uses an Agent to realize the communication between the SDN controller and the data plane. The Agent includes functions filtering the control plane (SDN controller and the Agent) instructions that are transmitted through the OpenFlow messages; the Agent translates these messages and forwards them to the corresponding ToR switch. Although, the Agent can be classified as a back-end process, there is a need for an interactive management tool that allows the interaction of the designers and the future users with the Agent. The need for the above tool appeared in the course of the data center’s design and implementation phase, it became more emphatic during the integration and finally the validation and testing phases. Similar interactive tools are reported in the literature as important tools for the management, testing and evaluation of networks [4], [5], [6].
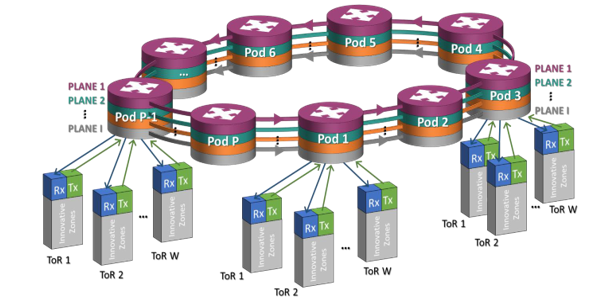 Figure 1: Nepela Data Center Network Architecture
Focusing on providing an effective tool mainly for advancing, testing and monitoring the Agent’s functionality and performance [7], the current work presents a management tool for the Nephele Agent. The proposed Agent’s tool is able to access all the information that it is directed to the data plane. Moreover, it can be used to create the commands for the data plane, monitor the commands transmission to the devices and also, the corresponding responses of the devices to the Agent. Furthermore, it provides the ability to request all the information with respect to the status of the devices. The use of the proposed management tool contributed significantly to the development of the entire Nephele data center and consequently the testing phase. Additionally, it benefits the entire system because it will still be most suitable for effectively monitoring the Agent’s performance during normal operation and also it provides the means for realizing scenarios in the cases of demonstrations and presentations [7].
The paper is organized as follows: Section II highlights the Nepela data center architecture. Section III presents the Agent’s management tool and Section IV concludes the paper.
2. The Nepela Data Center
The Nephele data center involves a slotted hybrid electrical/optical interconnection network that is advantageous with respect to the dynamic allocation of resources. The network includes PoDs of racks that communicate with the so-called innovation zones, which are the devices dedicated for the disaggregated computing, storage and memory resources. The innovation zones are connected to ToR switches [8]. Each innovation zone can communicate to other innovation zones through an all optical or an electro-optical channel. The architecture of the Nephele data center is depicted in Figure 1.
The Nephele data center is designed for an operation that includes dynamic and efficient sharing of the optical resources and a collision free network operation by using Time Division Multiplexing Access (TDMA). The control plane is based on a Software Defined Network (SDN). The SDN controller is divided in two distinct interfaces, namely the Northbound Interface and the Southbound Interface. A high-level view of the Nephele control plane architecture is presented on Figure 2.
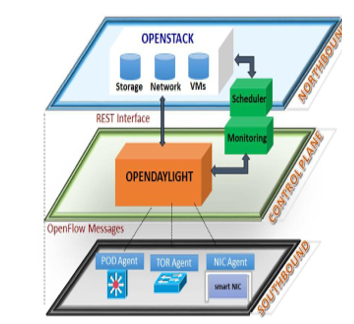 Figure 2: Nephele SDN Control Plane
The Application to Controller Plane Interface defined by ONF (Open Networking Foundation) in the SDN architecture is realized by the Northbound Interface of the Nephele SDN controller. This interface allows the interaction between the core services of the Nephele SDN controller and the upper layer network applications, which implement the logic of the network resource allocation in the data center. The Nephele’s design follows the approach of an overall centralized architecture. For this purpose, all the scheduling plans are carried out according to the algorithms that are performed by the central controller’s Traffic Offline Scheduling Engine [9]. Considering the optimization of the utilization of the entire network the Offline Scheduling Engine is equipped with mechanisms able to allocate resources of the data center network in the long term.
The data-controller plane interface defined by ONF in the SDN architecture is realized by the Southbound Interface of the Nephele SDN controller. The commonly used in these cases OpenFlow has been chosen as a standardized communication channel for this interface. It executes two main tasks: to command and configure the data plane devices via the device specific Agents. A device specific Agent performs as a proxy for the data plane switching devices. Consequently, the Agent should have two communication interfaces the Agent-Controller interface and the Agent-FPGA interface. The Nephele Agent’s is mainly devoted to filter the control plane instructions, that are included in the OpenFlow messages. Additionally, the Agent translates these instructions and then, it forwards them to the corresponding FPGA via a PCI Express interconnection. The Agent is a back-end process. It is activated at the beginning of each Nephele scheduling period and it will communicate the new schedule instructions in order to configure the data plane switches. The instructions come in the form of scheduling tables; the format of these scheduling tables is presented by Figure 3.
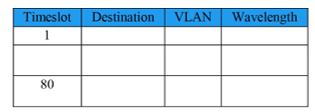 Figure 3: The Format of the Schedule Table
3. The Management Tool of the Agent
The present section describes first the graphical user interface (GUI) architecture of the management tool of the Agent; second, the tool’s usability and third, the back-end of the management tool.
3.1. The GUI Architecture
The Agent’s management tool is implemented by using the JavaFX software platform of the Java programming language; JavaFX consists of a set of graphics and media packages, which provide the means to the developers for the design, creation, testing, debugging, and deployment of rich client applications that operate consistently across diverse platforms. The management tool includes a GUI that presents to the user a Nephele network of smaller size as an image-map. This image-map includes clickable areas, which are illustrated graphics created on a raster graphics editor and enhanced with interactive attributes. This design has led to the implementation of a graphic environment, which, considering the interaction of the user with the management tool, ensures both, optimized usability and user experience, compared to an environment using the standard widgets, provided by JavaFX.
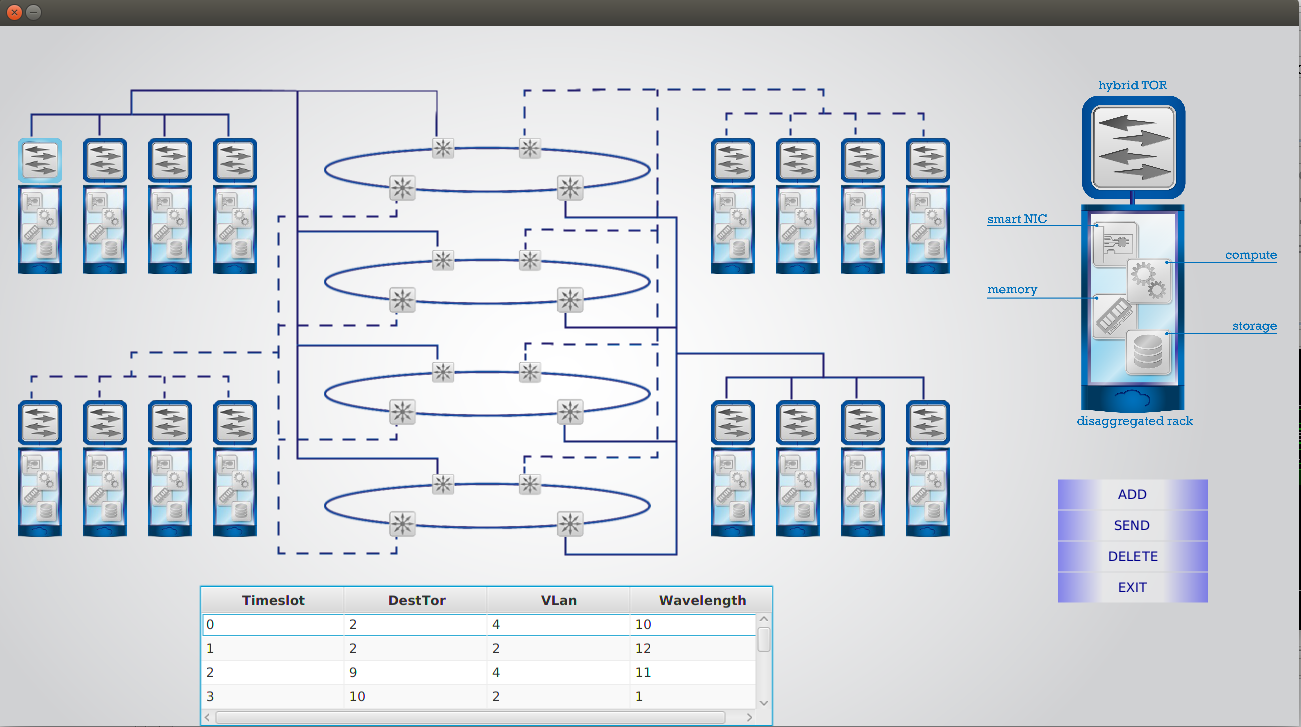
The user of the management tool sees the data center network, the scheduling table, an explanatory image and a menu, which are brought to her/him as the main scene of the GUI. This main scene is shown in Figure 4. The smaller scale network includes four PoDs residing in the network and connected via four WDM (Wavelength Division Multiplexing) rings. Each of the PoDs includes four PoD elements; these are divided into the disaggregated rack and the ToR switch.
The GUI includes an explanatory image, that is located over the menu in the right top corner. The image presents an enlargement of a PoD element in higher resolution and it is augmented with annotations, so that the user is able to understand what the image portrays.
In order to present the graphic display of the PoD elements three objects of the ImageView class were stacked in a StackPane object [10]. This design has been implemented as follows: they were aligned three image layers one over another (depicted by Figure 5), so that they appear as a single solid object and at the same time the developer can handle each one independently. The ImageView object is a type of Node object in the JavaFX Scene Graph that is used for painting a view; the painting is carried out by using data contained in an Image object. The StackPane is also a type of Node object acting as the layout container and it contains the ImageView objects. The three ImageView objects include the images that represent the ToR switch, the disaggregated rack and a visual effect.
In the GUI, the ToR switches are the interactive parts of the management tool: the user can select by clicking on them and she/he can create the scheduling table of the data center. Each ToR is a clickable area and it can be used by the user as the source and/or the destination in the scheduling table entry. In our case the upper left ToR is chosen by default as the host Agent PC scheduling engine. This is the source ToR and the remaining ToRs are the destinations. The interactive feature is accomplished by registering an event handler on the ImageView object that includes the ToR image. An event handler is an implementation of the EventHandler interface. The handle() method of this interface will let the code filling the entries in the scheduling table to perform if the ToR image is clicked. Upon the cursor click event, all the necessary code is executed to fill in the required fields of a scheduling table’s entry. The management tool fills the Destination field with the identity (id) of the ToR switch where the event occurred. The Timeslot field takes the value of the time sequence of the event, which is calculated based on a counter. The Wavelength field is filled with a value selected from a closed interval of integer values. Finally, the VLΑΝ (Virtual LAN) field entry represents the identification number that is assigned to the WDM ring, through which the data transmission will occur. Furthermore, when the ToR is clicked, as depicted in Figure 5, it
will trigger the effect displaying that it is the selected ToR. The effect is represented by a brighter image enclosing the ToR switch. The effect is set not to be visible at first, it will be set to full opacity if the ToR is selected and it will return to zero opacity with a two seconds lasting fade transition. The fade transition is an instance of the FadeTransition class, which is a subclass of the JavaFX Animation class and it changes the opacity of a node over a given time. The same effect has been implemented similarly to the WDM rings and it indicates graphically what WDM ring is chosen based on the VLAN field in the scheduling table entry.
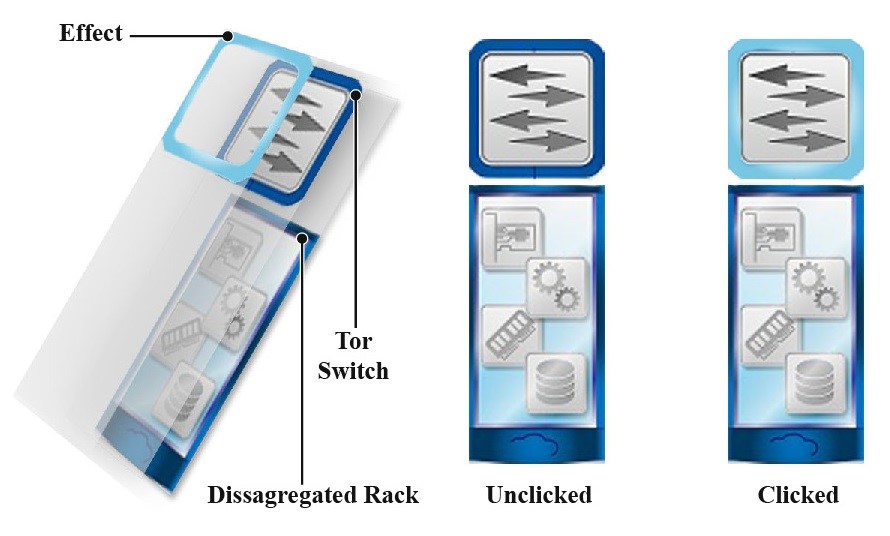 Figure 5: Effect of clicking the ToR
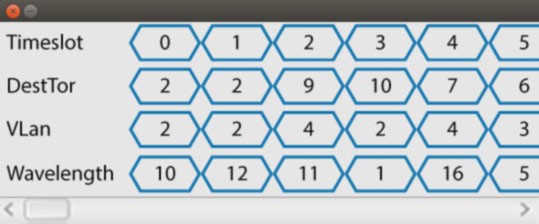 Figure 6: Pop-up Window with the Values sent to FPGA
All the aforementioned elements of the tool’s design let the user to construct the scheduling table and provide the option of editing it; this operation can be carried out by the use of the menu. The menu consists of four buttons and inherits its attributes from the Vbox class, which is a container that sorts its contents into a single vertical column. The menu buttons were created as a separate class. It is distinct from the Button class of JavaFX and is created by stacking a TextField object over a filled Rectangle object. This object’s filling is colored by an instance of the LinearGradient class, in order to apply effects that are suitable to the entire design of the GUI and preserve the uniformity to the user eye. These effects are triggered by the events originating from the mouse cursor and their implementation is based on switching the order of the colors in the gradient fill. Each time the user clicks the Add menu button she/he will start a new session of constructing a scheduling table and the source ToR will be automatically selected and indicated. A scheduling period of the Nephele network can accommodate up to eighty entries, as the corresponding allowed time slots. If the user exceeds that ceiling,
 Figure 7: Output of the Logic Analyzer
a pop-up dialog box will emerge with the corresponding message, prompting her/him to stop importing entries. The dialog box prevents the user from interacting with the main application window but it keeps the window visible in the background. When the user has completed the creation of the scheduling table, she/he is able to review it and delete any misplacing entries by using the delete button from the menu. If the key is pressed and no entry is selected or the scheduling table is empty, a pop-up window will be called informing the user of the corresponding case. As a final step the user presses the send button, an action which transmits the scheduling table to the FPGA data plane devices.
The conclusion of the transaction is marked by the appearance of a pop-up window that it will be shown to the user. The window includes all the values that were sent to the FPGA in a format that resembles that of a logic analyzer. The pop-up window is shown in Figure 6 and the corresponding output of the logic analyzer is depicted in Figure 7. The logic analyzer exports the output as a CSV file (Comma-Separated Values); this file can be processed by the management tool and in this case, the file’s values will be forwarded to the pop-up window. The pop-up window incorporates the graphical theme of the management tool and is designed to model the layout of the logic analyzer.
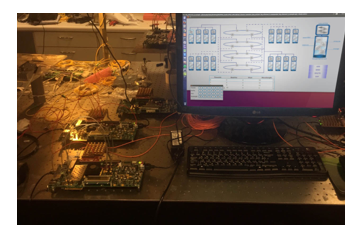 Figure 8: Nephele Data Plane Development
3.2. Usability of the Agent’s Management Tool
The use of the management tool is of great importance to the development and operation of the data center, since the users can create their own traffic schedule and then transfer that schedule to the data plane ToR switch. The engineers are able to control the data plane switches, during the development and testing phase of the physical layer of the data center network as shown in Fig 8. The tool’s GUI allows to construct the commands directly in the format of the scheduling tables of the FPGAs (instead of using the OpenFlow protocol). Additionally, it is straightforward to extent the management tool for creating the scheduling tables of a PoD switch in the Nephele network. Given the fact that there is a ToR Agent PC for each ToR switch in the network, the tool is executed on the Agent computer and it provides to the user the means for the scheduling of the network from the view point of the specific ToR switch. The user can control graphically and more importantly in real time the transmission of Nephele frames originating at the ToR switch (that is controlled by the Agent computer) to the other Nephele ToRs in the data center network [11].
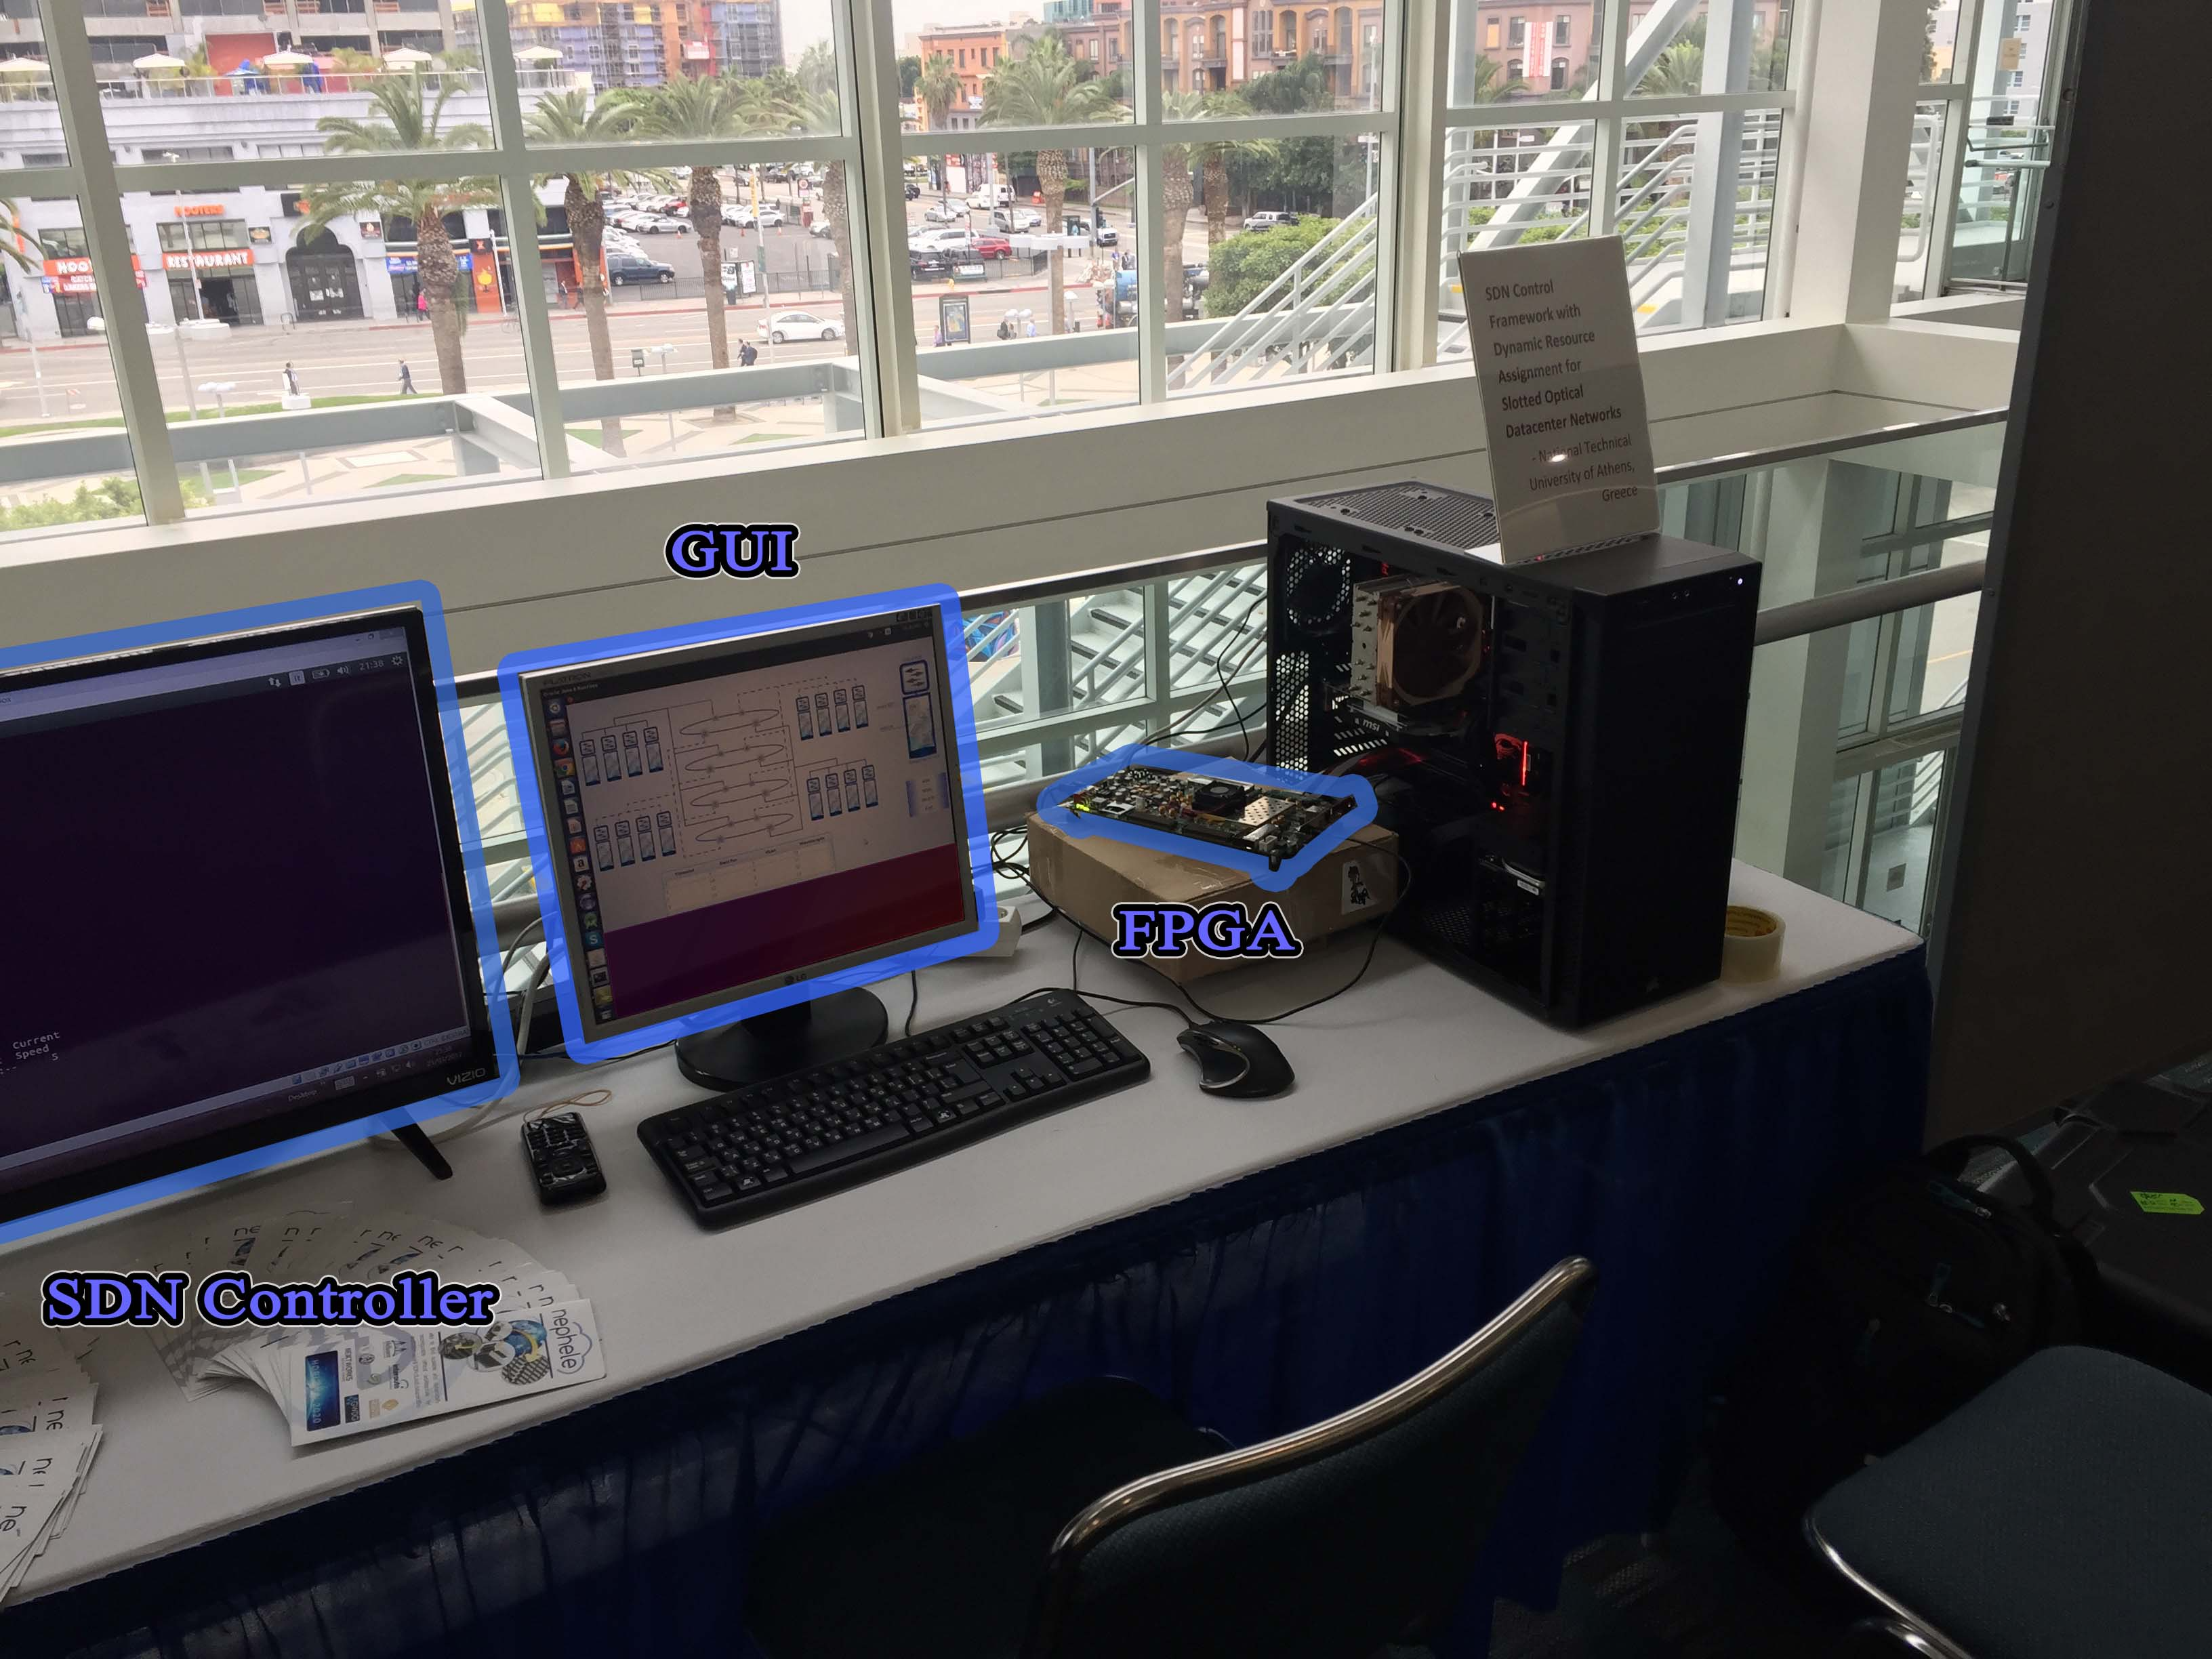 Figure 9: Live Demo of the Management Tool
The benefit of designing, developing and effectively using the proposed management tool has been already proven during test procedures and demonstrations. An illustrious example is the application, which has been shown during a presentation of the control plane of the Nephele data center. The scenario for this demonstration has as follows: the control plane includes parts of the FPGA’s implementations of the data plane, the Agent, and the SDN controller. Given that a functional data center Agent was not available, we presented the control plane by dividing it into two experiments. The first experiment demonstrates the SDN controller and the second the FPGA’s operation controlled by the management tool. The management tool has successfully imitated the functions of the Agent; the majority of the people that interacted with the management tool understood the concepts behind the architecture of the Nephele network and the function of the Agent in the Nephele data center. The demonstration as shown in Figure 9 consists of the SDN controller software presentation, the FPGA that represents the ToR switch, and the Desktop PC that executes the management tool, which is connected to the FPGA board via PCI Express. The user can interact with the management tool and give his/her own commands to the demonstration system.
3.3. Back-End of the Agent’s Management Tool
In the Nephele data center the ToR switch design includes multiple FPGAs; all the FPGAs that belong to a single ToR implementation use PCI Express to communicate with the host ToR Agent computer. The management tool divides the scheduling information to distinct parts, so that each part corresponds to the scheduling information concerning the corresponding FPGA; then it creates distinct threads to complete the entire operation. We use a single thread to communicate with a single FPGA and transfer the respective part of the ToR switch traffic schedule. Note here that, the communication is performed in parallel for all the FPGAs belonging to the same ToR switch.
In order to develop the PCI Express interface of the FPGAs we used the Xilinx IP Core for PCI Express and the RIFFA (Reusable Integration Framework for FPGA Accelerators) framework [12]. The framework consists of an API (Application Programming Interface), a driver/kernel module and an IP core for the FPGAs. All the above parts are open-source. It is designed to perform with the Xilinx IP core that handles the physical layer of the PCI Express interface. The API is designed to support multiple languages like C/C++, Java and Python. Moreover, it includes the necessary function/methods that the management tool needs to invoke, in order to communicate with the FPGA. The entire API is designed to be executed by threads and the design of the management tool takes full advantage of this capability.
The communication that is directed from the Agent PC to a FPGA operates according to the following steps. In the first, the application initiates the transaction by calling the fpga_send method. Then, the thread invokes the operation of the kernel driver, which writes to the FPGA configuration registers the necessary information to begin the transaction. The FPGA uses DMA (Direct Memory Access) to read the scatter gather elements [12] that the driver instructed. At the time that the transaction will be completed the driver will read the final count of the data passed, the amount of the data is then returned to the management tool as the return value of the fpga_send method.
In the design of the tool special attention was payed to the operation of the RIFFA API, because the RIFFA’s driver requires all the data in contiguous memory locations (in an array). Note here that, the Java’s Array object can’t be used in this case. An attractive solution to this problem is the employment of the ByteBuffer Class of Java, which is a class that is created to handle a stream of raw data. The operations on the buffer can be carried out byte by byte, but casting is also supported for the user to be able to write a whole Java data type, like an integer.
Finally, the endian of the data has been tackled as follows. The JVM (Java Virtual Machine) stores class files in big endian byte order, where the high byte comes first. Multibyte data items are always stored in big-endian order. Given that the Xilinx FPGAs operate in little-endian byte order, the change of the endianness could be arranged either during the construction of the ByteBuffer or at the receiving buffer in the FPGA. The latter choice has been proven more efficient and gave us the advantage of the ByteBuffer casting, which would not be useful in the case of changing the order of the byte inside the ByteBuffer in the Java application.
4. Conclusion
The current paper presented a management tool for the Agent of the Nephele data center. The advantage of creating and using the proposed management tool is that the data center designers and engineers can create their own schedule as the tool’s GUI users and then transfer that schedule to each data plane ToR switch. The user can control graphically in real time the transmission of Nephele frames originating at the ToR switch to the other Nephele ToRs in the data center network. Moreover, the management tool can be of even further use if it will be extended to create the scheduling tables of a PoD switch in the Nephele network.
Conflict of Interest
The authors declare no conflict of interest.
Acknowledgment
This work has been funded by the European Union’s Horizon 2020 research and innovation programme under grant agreement No 645212 (NEPHELE).
- A. Kyriakos, T. Tsavalos and D. Reisis , “GUI for the communication agent of the “Nephele” data center,” 2017 South Eastern European Design Automation, Computer Engineering, Computer Networks and Social Media Conference (SEEDA-CECNSM), Kastoria, 2017, pp. 1-5. doi: 10.23919/SEEDA-CECNSM.2017.8088237
- P. Bakopoulos, K. Christodoulopoulos, G. Landi, M. Aziz, E. Zahavi, D. Gallico, R. Pitwon, K. Tokas, I. Patronas, M. Capitani, C. Spatharakis, K. Yiannopoulos, K. Wang, K. Kontodimas, I. Lazarou, P. Wieder, D. Reisis, E. Varvarigos, M. Biancani, H. Avramopoulos, “NEPHELE: an end-to-end scalable and dynamically reconfigurable optical architecture for application-aware SDN cloud datacenters”, IEEE Communications Magazine, 2018
- Nick McKeown, Tom Anderson, Hari Balakrishnan, Guru Parulkar, Larry Peterson, Jennifer Rexford, Scott Shenker, and Jonathan Turner. 2008. “OpenFlow: enabling innovation in campus networks.” SIGCOMM Comput. Commun. Rev. 38, 2 (March 2008), 69-74.
- Yi-Bing Lin , Joe Geigel, “A graphical user interface design for network simulation,” Journal of Systems and Software, Volume 36, Issue 2, Pages 181-190, February 1997.
- M. Turon. 2005. “MOTE-VIEW: a sensor network monitoring and management tool.” In Proceedings of the 2nd IEEE workshop on Embedded Networked Sensors (EmNets ’05). IEEE Computer Society, Washington, DC, USA, 11-17.
- S. Corazza, S. Reale, “Network management system graphical interface”, published in Eighth International Conference on Software Engineering for Telecommunication Systems and Services, 1992.
- G. Landi, I. Patronas, K. Kontodimas, M. Aziz, K. Christodoulopoulos, A. Kyriakos, M. Capitani, A. Hamedani(, D. Reisis, E. Varvarigos, P. Bakopoulos, H. Avramopoulos,“SDN control framework with dynamic resource assignment for slotted optical datacenter networks,” 2017 Optical Fiber Communication Conference, Los Angeles, California, USA, March 2017.
- Ioannis Patronas, Angelos Kyriakos, Dionysios Reisis, “Switching functions of a data center Top-of-Rack (ToR),” 23rd IEEE International Conference on Electronics Circuits and Systems, Monte Carlo Monaco, Dec. 2016.
- K. Christodoulopoulos, K. Kontodimas, K. Yiannopoulos, E. Varvarigos, “Bandwidth Allocation in the NEPHELE Hybrid Optical Interconnect”, 2016 18th International Conference on Transparent Optical Networks (ICTON), July 2016.
- Johan Vos, Weiqi Gao, Stephen Chin, Dean Iverson, James Weaver Pro ,JavaFX 8: A Definitive Guide to Building Desktop, Mobile, and Embedded Java Clients [1 ed.] 2014 p.206-208.
- Chen J-W, Zhang J., “Comparing text-based and graphic user interfaces for novice and expert users,” AMIA Annual Symposium Proceedings. 2007;2007:125-129.
- Matthew Jacobsen, Dustin Richmond, Matthew Hogains, and Ryan Kastner. 2015 RIFFA 2.1: A Reusable Integration Framework for FPGA Accelerators. ACM Trans. Reconfigurable Technol. Syst. 8, 4, Article 22 (September 2015), 23 pages. Available: http://dx.doi.org/10.1145/2815631

