Masonry Walls Behavior in Predominant Frames Structures

Adv. Sci. Technol. Eng. Syst. J. 3(6), 124–130 (2018);
 DOI: 10.25046/aj030614
This was a study on the behavior of a confined masonry bearing wall in a medium height dual building. This wall had to be placed at one corner of the building. It had to be a masonry wall, not to be too stiff and drag the rigidity center too far from the building’s center. The structure’s stiffness was also to be analyzed by using a concrete wall instead of the masonry one, as an alternative solution. This showed the importance of using a masonry wall. The dual structure contained only one other wall, made of reinforced concrete. The 2 bearing walls bore most of the shear force from seismic loads, because they were the stiffest load bearing elements in the structure. It was interesting to see if the masonry wall could bear these loads. The structure was unusual, as it contained frames, a concrete and a masonry wall. These elements behave differently. The structure was analyzed for both the elastic and plastic stage. The loadbearing elements stiffness, the stresses development and structure failure mechanism were studied for both solutions. The results showed it is appropriate to use a masonry wall at the corner. This wall can bear the loads it is subjected to.
1. Introduction
The present paper studies the behavior of a dual medium height building. It will be built in Bucharest, Romania. This structure contains mainly frames. There are also two bearing walls. One in placed close to the center and the other is in one corner. The first is a reinforced concrete wall, while the latter can either be made of confined masonry or reinforced concrete. The first solution has the advantage of keeping the center of rigidity closer to the building’s center. A confined masonry wall does not have such a great rigidity. Although it is placed in a corner, it can’t drag the rigidity center too far from the reinforced concrete wall. The second solution has the advantage of having two reinforced concrete walls that can bear the horizontal loads easier, but it is possible for the stiffness center to be shifted more towards the corner. Both solutions will be studied here. If both walls and frames are present, the lateral-force resisting system is normally provided by the walls, since they are much stiffer than the column frames [1]. Load bearing capacity of masonry panels is determined mainly by the stress distribution shape. The load-deformation pattern depends on the material properties of masonry bricks and mortar [2] and also masonry strength increases as the bricks dimensions decrease [3]. Laboratory tests prove that both confined masonry walls and masonry infill panels show diagonal cracks when subjected to horizontal loads. For confined masonry, the cracks are more evenly distributed on the masonry panel [4]. Confined masonry, known to have performed well in moderate earthquakes, can be regarded as a form a partially reinforced masonry. Masonry walls are thought to fail trough diagonal shear [5]. Confined masonry structures show greater lateral strength and ductility compared to plain masonry structures. In these systems the majority of gravity and shear loads are taken by the masonry panels [6]. If masonry walls reinforcement is used, it helps the masonry to work together with the confining elements [7]. The stiffness for columns and walls will be calculated to see the difference between them. It is interesting to see if the masonry walls, that are only 0.3% of the building area can bear the loads, particularly the lateral loads they are subjected to. It is also important to see how the structure’s failing mechanism occurs. Medium rise reinforced concrete walls show a good seismic behavior for different earthquake patterns. Buildings with slender walls may also show important ductility. Plastic hinges mostly develop at the beams ends [8]. Lack of symmetry may cause undesired seismic behavior for a structure [9]. For framed buildings, the beams and columns bending provides the resistance to lateral forces. Nonlinear static pushover analysis is useful to evaluate the real strength for buildings [10]. It is important to study a building’s global seismic response in terms of capacity curve and plastic hinges location and development [11]. The codes in force used to design the building are [12–18].
2. Structure Description
The floor plan is presented in Figure 1. The 3D building image is seen in Figure 2. The beams are blue, columns are green, reinforced concrete walls are dark gray, confined masonry walls are red and slabs are light gray. The concrete wall is composed of 2 piers (walls) on direction X (P4 and P6) and one on direction Y (P5).
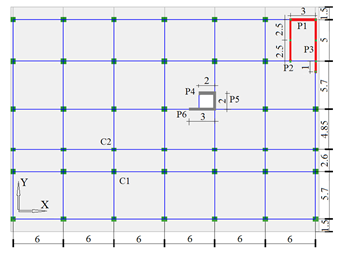 Figure 1 Story plan (all dimensions are in m)
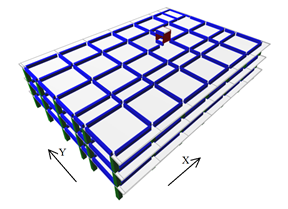 Figure 2 Building 3D image
The confined masonry wall contains one pier (wall) (P1) developed on direction X and 2 piers (walls) developed on direction Y (P2 and P3). The bearing capacity and stresses will be evaluated for all 3 piers (P1, P2 and P3) separately, for the plastic state. The confined masonry wall has a greater stiffness compared to the columns, so it will bear a higher amount of seismic force. Confined masonry walls can be designed with more confining slender columns and more vertical and horizontal reinforcement, so that they can bear higher loads. This can be done up to a point, as the slender columns reinforcement can’t surpass a certain limit, and the horizontal bars can only be placed in the horizontal gaps between the brick rows. It is not desired to use too many slender columns as this would make the masonry wall behave more like a concrete wall and move the mass and stiffness center too close to the building’s edge. Walls P1, P2, P3, P4, P5 and P6 are seen in Figure 3. The hatched areas are slender columns for P1, P2 and P3. P4, P5 and P6 are completely hatched because they are made of reinforced concrete. The walls are 3 stories high (9m). The dimensions in Figure 3 are in cm.
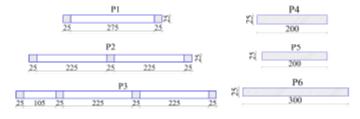 Figure 3 Cross sections for walls P1, P2, P3, P4, P5 and P6
The building will have an important seismic load to bear, as it is built in a high seismic area (ag=0.30g, g is the gravity acceleration). The software used for analysis is ETABS 2016.
3. Theory Elements Used in Paper
3.1. General Material Characteristics
To study the behavior of the confined masonry walls, they will have to be designed to bear the vertical and horizontal loads they are subjected to. This design will be done using the seismic load combination: 1.0·permanent loads +0.4·variable loads+ 1.0·seismic loads. The concrete used is C20/25, with elasticity modulus EC=30000N/mm2 and reinforcement bars are S355 with elasticity modulus ES=210000N/mm2 [16]. The bricks for the masonry wall are full bricks 240·115·63 (mm) with EM=4400N/mm2, standard strength fb =10N/mm2 and mortar M10 [12]. The walls stresses analyzed are: σx, σz, τxz, τxy and τyz. They are compared to the design masonry strengths that are as follows: design horizontal (fdh) and vertical (fd) compression strengths, design shear strength for horizontal direction (fvd,l) and design strengths for horizontal and vertical stresses perpendicular to the wall (fxd1 and fxd2) [12]. They are calculated using their corresponding characteristic masonry strengths fkh, fk, fvk,0, fxk1 and fxk2, the insurance factor γM and the unitary vertical stress σd [12]. Concrete design compression strength is fcd, calculated using the characteristic strength fck and steel design strength fyd is calculated from the characteristic value fyk [16].
fdh = fkh/γM=2.09/1.9=1.1 N/mm2 (1)
fd = fk/γM=4.4/1.9=2.31 N/mm2 (2)
fvd,l =fvk,0/γM+0.4·σd = 0.3/1.9+ 0.4 · 0.1= 0.2 N/mm2 (3)
fxd1= fxk1/γM=0.24/1.9=0.126 N/mm2 (4)
fxd2= fxk2/γM=0.48/1.9=0.252 N/mm2 (5)
fcd = fck/γM=20/1.5=13.3 N/mm2 (6)
fyd = fyk/γM=355/1.15=308 N/mm2 (7)
3.2. Seismic Force Evaluation
The seismic action is introduced by the seismic coefficient cs. The base force Fb is evaluated according to [17, 18]. γI,e = 1.2 is the building’s importance-exposure coefficient, β0 = 2.5 is the maximum value of the elastic spectrum and q is the structure’s behavior factor, q=3.5·αu/α1=3.5·1.35, αu/α1 = the base shear force value for the failing mechanism/the base shear force value for the first plastic hinge, m = building’s mass. λ = 0.85 as this is a 3 stories building, ag = 0.30g (because of the building’s location), G = building’s weight.
Fb = γI,e · β0 · ag/q · m · λ = cs · G = 0.17·G [kN] (8)
3.3. Confined Masonry Wall Design Theory Elements
MRd associated to NEd is the walls bearing bending moment associated to design axial force NEd. MRd is calculated using [12]. Wall’s cross section compressed area is named AC. ls is the distance between the edge slender columns centers. yC is the distance between the wall’s weight center and AC weight center. As is the reinforcement area in the slender columns. b= t·fcd/fd. t =25cm is the wall’s thickness.
MRd = MRd(M) + MRd(As) [kNm] (9)
AC = NEd/(0.85·fd) [mm2] (10)
MRd = NEd·yC + As·ls [kNm] (11)
The confined masonry walls bearing shear force is named VRd. It is calculated using [12]. VRd1* is the bearing shear force taken by the masonry panels. VRd2 is the bearing horizontal shear force taken by the slender column at the compressed wall edge. VRd3 is the shear bearing force taken by the horizontal reinforcement bars Asw.
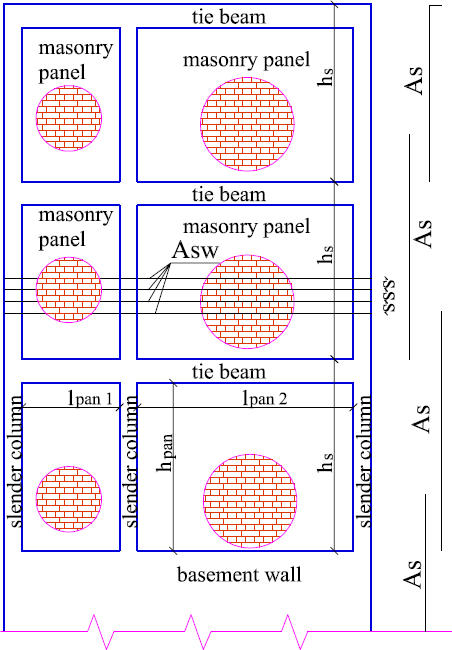 Figure 4 Confined masonry wall view
VRd = VRd1*+VRd2 +VRd3 [kN] (12)
VRd1*= 0.4 · NEd + 0.8·VEd·hpan/lpan [kN] (13)
fvd,0 =fvk,0/γM =0.30/1.9=0.158 N/mm2 (14)
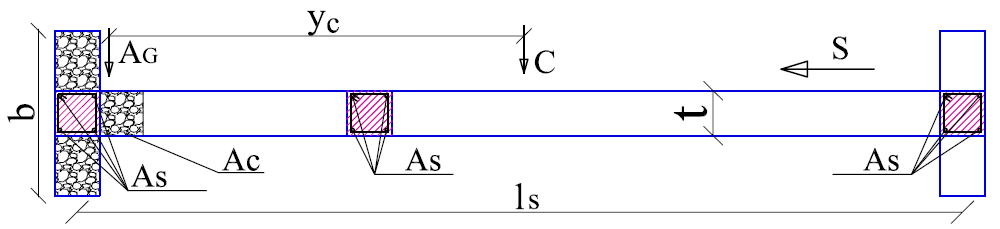 Figure 5 Confined masonry wall horizontal cross section
Figures 4 and 5 show a confined masonry wall’s view and cross section. S shows the seismic action direction. ls is the distance between the edge slender columns centers.
VRd2 = λc · As · fyd [kN] (15)
VRd3 = 0.8 ·lw· Asw ·fyd/s [kN] (16)
Asw is the reinforcement area in the horizontal bricks joints. s is the vertical distance between two horizontal reinforced joints. λc is the reinforcement participation factor.
3.4. Frames Design Theory Elements
Bending reinforcement in beams is designed according to MEd (bending moment from the seismic load combination) [16, 18].
MEd=b·λx·fcd·(d-λx/2) [kNm] (17)
MEd=As·fyd·z [kNm] (18)
m=MEd/(b·d2·fcd) (19)
z=d-λx/2=d-d·(1-(1-2m)0.5)/2 [mm] (20)
As,min = min{0.26·fctm/fyk·b·d; 0.0013·b·d} (21)
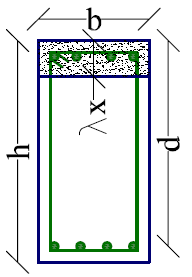 Figure 6 Beam section
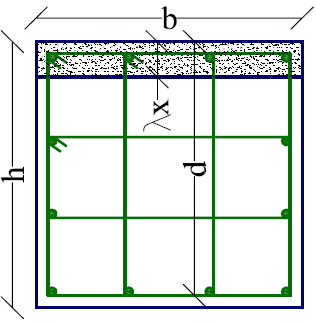 Figure 7 Column section
λx is the beam section compressed area height [16, 18]. d is the distance seen in Figures 6 and 7. The minimum reinforcement area As for beams is As,min. fctm =2.6N/mm2 is the concrete tensile strength medium value for C20/25. MRc is the bearing bending moment in columns. It is calculated according to [16, 18]. γRd =1.2 is the steel stiffening factor for DCM (medium ductility buildings), ΣMRc and ΣMRb are the sums of bearing bending moments in columns and beams near a frame joint. For columns, the longitudinal reinforcement coefficient minimum value is ρmin = 0.01 and the maximum value is ρmax = 0.04. NEd is the axial force in columns. AS will be determined from (25) if λx<2·as, and from (26), if λx≥2·as. Here as =45mm.
ΣMRc ≥ γRd ·ΣMRb [kNm] (22)
ρ=As/(b·d) (23)
x=NEd/(b·λ·fcd) [mm] (24)
As=[MEd-NEd(d-as)/2]/[fyd·(d-as)] [mm2] (25)
As=[MEd+NEd(d-as)/2-b·λx·fcd(d- λx/2)]/[fyd(d-as)] (26)
4. Elastic Analysis Results
4.1. Walls and Frames Efforts
For direction X, the bending moments in columns show increased values at the base on the structural lines where no walls are present and at the upper stories on the lines where there are walls. The effect is increased if they are reinforced concrete walls. The high bending moments at the columns base are generated by the seismic force that is to be taken by the frames only. The high bending moments at the upper stories are created by the energy dissipation mechanism that is done by the frames. On direction Y, bending moments visibly reach the highest values in columns farthest from the walls. This happens because in those areas frames have to withstand the horizontal loads without help from the walls. These observations are made according to Figures 8 and 9.
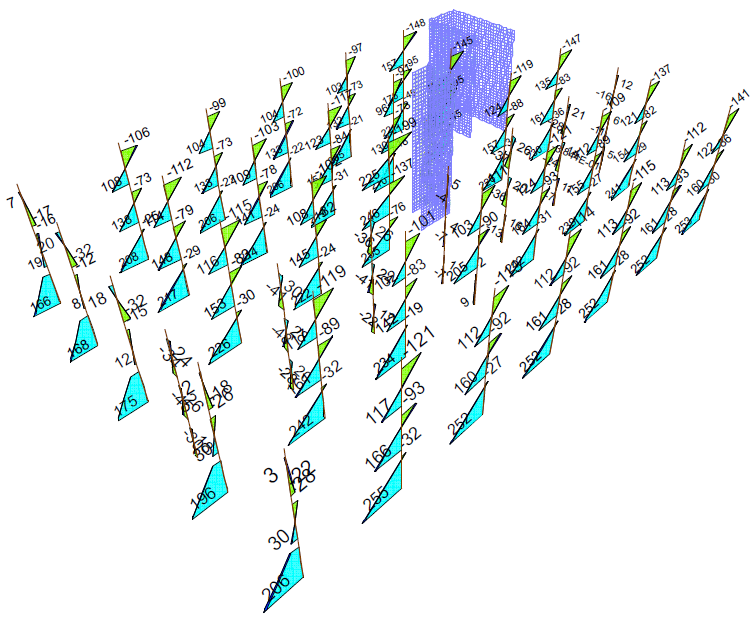 Figure 8 MEd from the seismic load combination on X direction
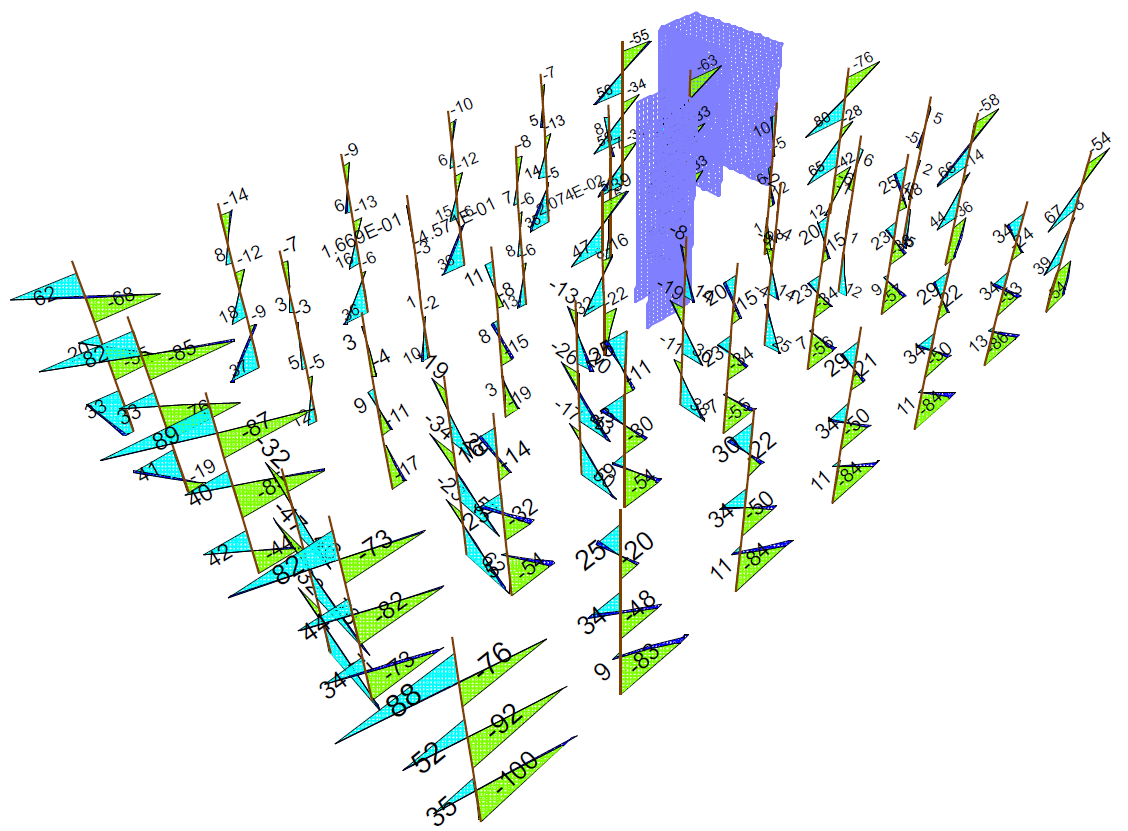 Figure 9 MEd from the seismic load combination on Y direction
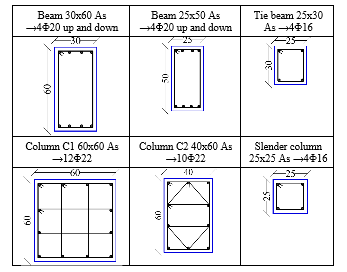
According to the design results, the reinforced concrete elements dimensions and reinforcements are described in Table 1. As is the longitudinal reinforcement area. The bars are seen in each figure as black discs and the diameter (Φ) of bars is in mm. Walls P1, P2, P3, P4 P5 and P6 are seen in detail in Figure 3. For the bearing efforts analysis, P1, P2 and P3 will be considered working separately. P1 is working on X direction, while P2 and P3 are working on Y direction.
When determining the walls rigidities, P1, P2 and P3 are considered working together as one wall. This wall is developed on both X and Y directions. This wall is named P1-3.
Table 1 Concrete elements dimensions (in cm) and reinforcements
 The efforts in masonry walls are written in Table 2. P3 does not need horizontal reinforcement in the masonry panels. P1 behaves like a slender wall, as the design shear force is greater at the second story.
Table 2 Masonry walls efforts
| P1 | |||
| NEd [kN] | MEd [kNm] | MRd [kNm] | |
| story 3 | 170 | 307 | 997 |
| story 2 | 424 | 977 | 1332 |
| story 1 | 718 | 1676 | 1679 |
| VEd [kN] | VRd [kN] | Asw [] | |
| story 3 | 383 | 464 | 2Φ8/30 |
| story 2 | 563 | 675 | 2Φ10/30 |
| story 1 | 471 | 683 | 2Φ8/30 |
| P2 | |||
| NEd [kN] | MEd [kNm] | MRd [kNm] | |
| story 3 | 326 | 572 | 1915 |
| story 2 | 673 | 1539 | 1246 |
| story 1 | 1021 | 2555 | 3072 |
| VEd [kN] | VRd [kN] | Asw [] | |
| story 3 | 511 | 526 | 2Φ8/30 |
| story 2 | 902 | 914 | 2Φ8/15 |
| story 1 | 944 | 1130 | 2Φ8/15 |
| P3 | |||
| NEd [kN] | MEd [kNm] | MRd [kNm] | |
| story 3 | 360 | 676 | 2757 |
| story 2 | 710 | 2267 | 4575 |
| story 1 | 1038 | 4364 | 5228 |
| VEd [kN] | VRd [kN] | Asw [] | |
| story 3 | 265 | 340 | – |
| story 2 | 406 | 480 | – |
| story 1 | 580 | 611 | – |
4.2. Walls Rigidities Values and Structure’s Rigidity Center
The building’s rigidity center will be determined according to the rigidities of all vertical load bearing elements. When determining the walls rigidities, P1, P2 and P3 are considered working together as one wall. This wall is developed on both X and Y directions. This wall is named P1-3, seen in Figure 10. The rigidity center for wall P1-3 is named RC P1-3 in Figure 12. When determining the walls rigidities, P4, P5 and P6 are considered working together as one wall. This wall is developed on both X and Y directions. This wall is named P4-6, seen in Figure 11. The rigidity center for wall P4-6 is named RC P4-6 in Figure 12. If P1-3 is a masonry wall, the building’s rigidity center is RC1, seen in Figure 12. If P1-3 is a concrete wall, the building’s rigidity center is RC2, seen in Figure 12. Equation (27) is used to calculate walls rigidities [12].
R=1/[H3/(3·ECM·I)+k·H/(GCM·A)] [kN/cm] (27)
GCM=0.4·ECM (28)
ECM=(EM·IM+EC·IC)/(IM+IC) [kN/m2] (29)
R is the wall’s rigidity, H=9m is the total wall height, k=1.2 is a coefficient according to the wall’s horizontal cross section shape. ECM and GCM are the longitudinal and respectively transversal elasticity modulus for confined masonry walls [12]. I is the wall’s cross section moment of inertia and A is the wall’s cross section area. IM and IC are the moments of inertia for the masonry cross section areas (white in Figure 10) and respectively concrete cross section areas (hatched in Figures 10 and 11). EM and EC are the longitudinal elasticity modulus for masonry and respectively concrete [12].
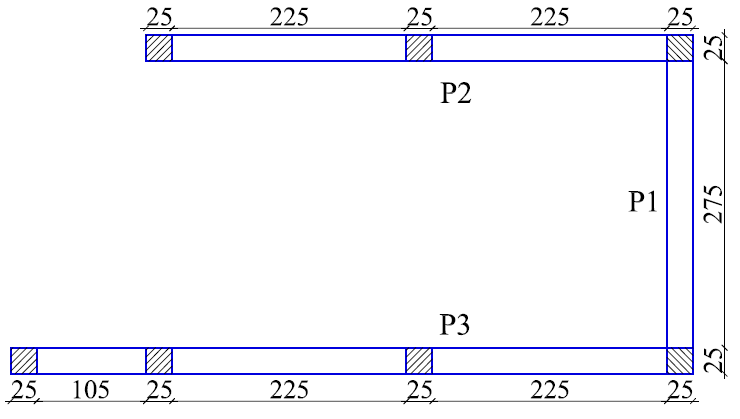 Figure 10 Confined masonry wall P1-3 (cross section)
Both reinforced concrete and masonry walls are 25cm thick, and their lengths are seen in Figure 10 for wall P1-3 made of confined masonry (M), and in Figure 11 for wall P4-6 made of reinforced concrete. Dimensions in Figures 10 and 11 are in cm.
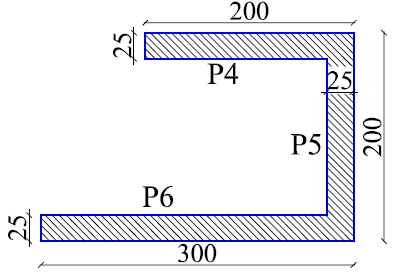 Figure 11 Reinforced concrete wall P4-6 (cross section)
Figure 12 shows the elements used in determining the structure’s rigidity. The distances from the origin (0;0) to each center of the load bearing vertical element are drawn with blue arrows for direction X and red for Y. RC 1 is the structure’s rigidity center if P1-3 is a confined masonry wall. RC 2 is the structure’s rigidity center if P1-3 is a reinforced concrete wall. It is shown the way the rigidity center is shifted to the corner for the second case. There is an important impact on the rigidity center position given by the material used for P1-3. The rigidity center for the whole building is calculated with (30) for both orthogonal directions X and Y. In (30), i is the load bearing element number in the sum and di is the distance from the origin (0;0) to the element’s rigidity center. Those distances are shown in Figure 12 (blue for direction X and red for direction Y).
Rb=(ΣRi·di)/ΣRi [kN/cm] (30)
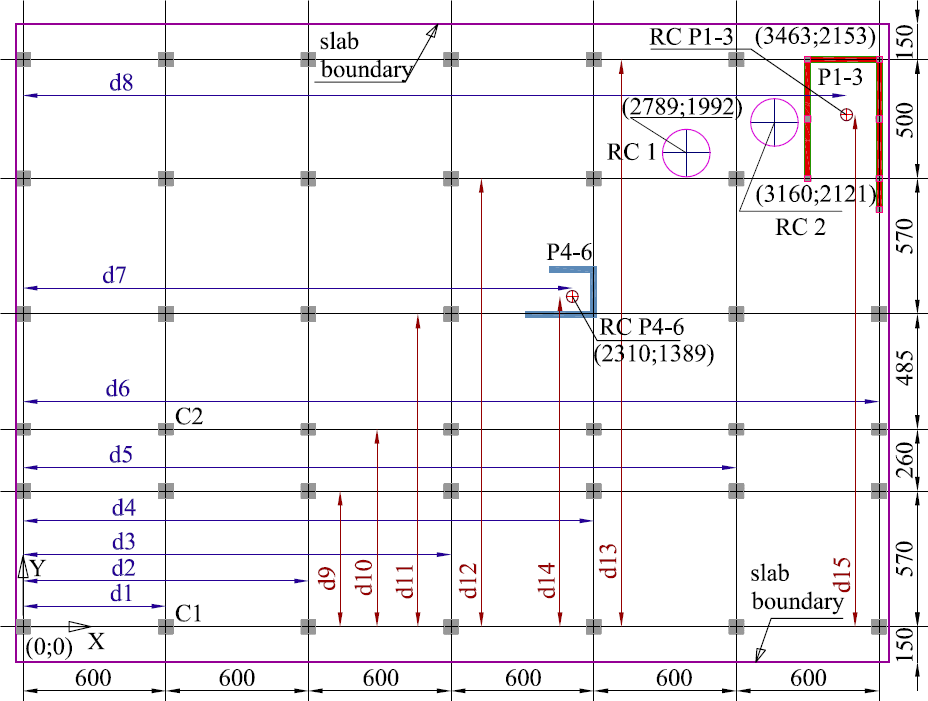 Figure 12 Building rigidity centers (dimensions are in cm)
The building’s rigidity values on X and Y are comparable if wall P1-3 is made of confined masonry. If P1-3 is a reinforced concrete wall, the building’s rigidity is increased less on X and more on Y. This is explainable because P1-3 is more developed on Y. This is valid only for the elastic stage.
Table 3 Walls and columns rigidities values
| Wall | P1-3 on X (M) | P1-3 on Y (M) | P1-3 on X (C) | P1-3 on Y (C) | P4-6 on X | P4-6 on Y |
| R [kN/cm] | 1887.93 | 3656.49 | 7137.6 | 11938.97 | 1971.6 | 654.5 |
| Column | C1 60×60 on X and Y | C2 40×60 on X | C2 40×60 on Y | |||
| R [kN/cm] | 13.289 | 8.859 | 3.945 | |||
| ΣR on X [kN/cm] | 4271 if P1-3 is M | 9520 if P1-3 is C | ||||
| ΣR on Y [kN/cm] | 4670 if P1-3 is M | 12953 if P1-3 is C | ||||
In Table 3 P1-3(M) means P1-3 made of confined masonry. P1-3(C) means P1-3 made of reinforced concrete. ΣR on X is the whole building’s rigidity on direction X. ΣR on Y is the whole building’s rigidity on direction Y.
5. Elastic Stage Results
5.1. Pushover Diagrams
The 4 pushover cases used for the building’s nonlinear analysis are PX, PY, PXC and PYC. PX and PY are used for the first solution (a concrete and a masonry wall), while PXC and PYC are used for the second solution (2 concrete walls). The pushover diagrams in Figure 13 are drawn for each case. The maximum base force reached is greater for PX. The maximum displacement values reached are close. The building is stiffer on direction X. This can be explained by the reinforced concrete wall extended more on direction X. Diagrams for cases PY and PXC overlap each other up to a point. This means the building has the same rigidity for those cases. Displacements reached for cases PXC and PYC are smaller than those for PX and PY. This is because the building becomes stiffer if 2 concrete walls are used.
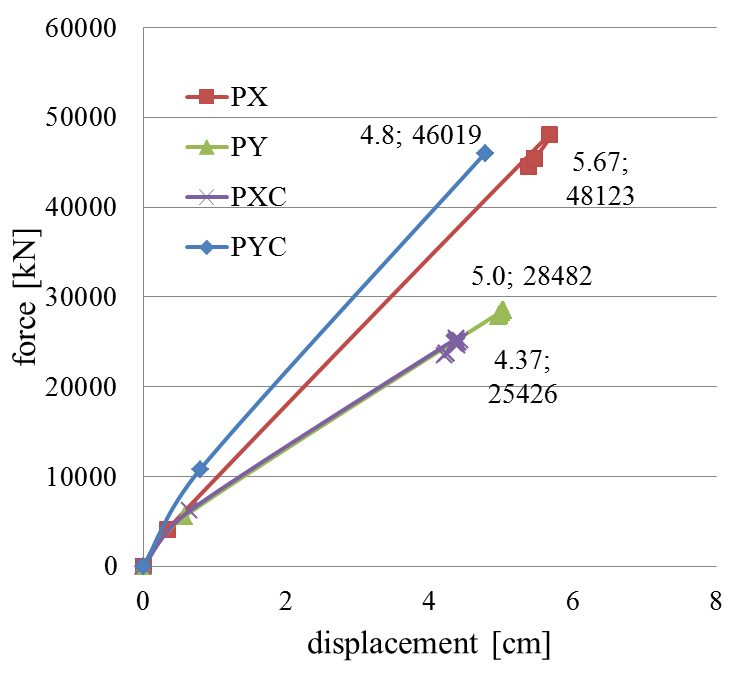 Figure 13 Pushover diagrams
5.2. Plastic Mechanism
Figures 14 and 15 show the final stages of plastic hinges development on both directions. For both cases, the last steps show the collapse of plastic hinges at columns bottoms.
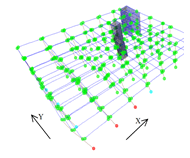 Figure 14 PX step 9
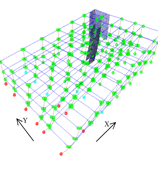 Figure 15 PY step 16
There are also hinges formed at the beams ends. Most developed hinges are present in columns placed farther from the walls area, particularly the hinges that reach the collapse stage. Columns closer to the walls have less horizontal loads to bear, as they are taken mostly by the stiffer elements. For case PY there are more plastic hinges that reach collapse and a large buckling phenomenon for the edge columns and the reinforced concrete wall. The structure has a lower stiffness for case PY in the plastic stage, as it is seen in Figure 13. The color code in Figures 14 and 15 is the following: green means the plastic hinge is formed, light blue means the plastic hinge reaches the limit and the element gives out, pink means the load was redistributed and red means collapse.
5.3. Masonry walls stresses
Walls P1, P2 and P3 are shown separately, to see the stress patterns more clearly. Stresses in each wall are shown for the case that creates the highest values. The case names are written in brackets. For P1 stresses σx show increased and alternating values at the intersections with beams, as seen in Figure 16.
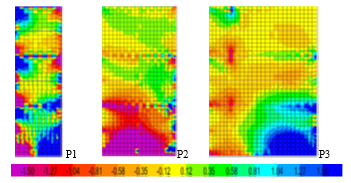 Figure 16 σx values at step 2 (case PX for P1 and case PY for P2 and P3)
This means the masonry is stretched below the tie beams (blue areas) and crushed above them and at the wall’s bottom.
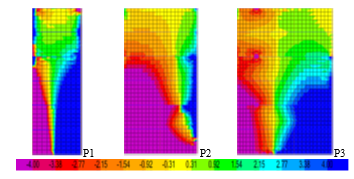 Figure 17 σz values at step 2 (case PX for P1 and case PY for P2 and P3)
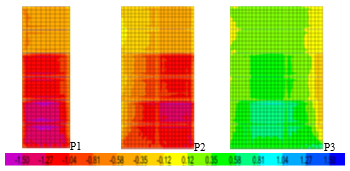 Figure 18 τxz values at step 1 (case PX for P1 and case PY for P2 and P3)
For P2 and P3 those stresses show increased values at the wall’s bottoms, as seen in Figure 16. Also, for walls, the stresses increase around the tie beams, where the floors connect to the walls. Floors may transmit horizontal stresses to walls. Stresses σz reach the highest values at the walls bottoms and at the walls corners, as this is a vertical stress, but the walls are also subjected to horizontal loads. In Figure 17 it is seen that one corner is crushed and the other is stretched. Stress τxz surpass the masonry strengths from the first step of the analysis as seen in Figure 18. Stress values in walls P1 and P2 are smaller than in P3. Another observation is that the maximum stresses have different signs for P2 and P3. P2 is crushed and P3 is stretched. P3 is less affected, as it is longer.
Stresses τxy, in Figure 19, and τyz, in Figure 20, surpass the strengths from the second step of the analysis. The values are higher at the walls intersections, as these areas are stiffer. Stress values also increase at the beams and tie beams intersections with perpendicular walls. This is particularly seen for P3.
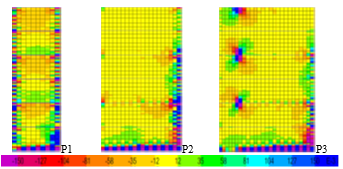 Figure 19 τxy values at step 2 (case PY for P1, P2 and P3)
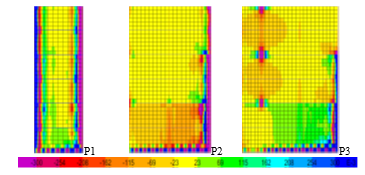 Figure 20 τyz values at step 2 (case PX for P1 and case PY for P2 and P3)
6. Conclusions
The confined masonry wall can bear the loads it is subjected to. The building’s rigidity center is moved closer to the corner if a concrete wall is used instead of the masonry one. The failure mechanism is reached when plastic hinges reach the collapse stage at the columns bottoms. This solution is suitable for medium height buildings with dual structure, when it is necessary to place walls at one corner. It is mandatory, to check if the masonry walls can bear the loads they are subjected to.
Conflict of Interest
The author declares no conflict of interest.
- K. Leng, C. Chintanapakdee, T. Hayashikawa, “Seismic Shear Forces in Shear Walls of a medium Rise Building By Response Spectrum Analysis”. Engineering Journal Volume 18 Issue 4, 2014. http://dx.doi.org/10.4186/ej.2014.18.4.73
- C. Glock, C. A. Graubner, “Design of slender unreinforced masonry walls” 13th International Brick and Block Masonry Conference Amsterdam, 2004. www.hms.civil.uminho.pt/ibmac/2004/
- A. Jaber, “Effect of Masonry Units Type and Concrete Grouting on Compressive Strength of Prisms” Eng. & Tech Journal.2010; Vol.28, No.13, 2010. https://www.iasj.net/https://www.iasj.net/iasj?func=fulltext&aId=277 74
- L. M. Abel-Hafez, A. E.Y. Abouelezz, E.F, Elzefeary, “Behavior of masonry strengthened infilled reinforced concrete frames under in-plane load.” HBRC Journal production and hosting by Elsevier 2015 11, p 213-223, 2015. http://dx.doi.org/10.1016/j.hbrcj.2014.06.005
- M. Dhanasekar, “Shear in reinforced and unreinforced masonry: response, design and construction” in The 12th East Asia-Pacific Conference on Structural Engineering and Construction. Elsevier Procedia Engineering 14 p 2069-2076, 2011. doi:10.1016/j.proceng.2011.07.260
- Y. Ouyang, H, J. Pam, S. H. Lo, Y. L. Wong, J. Li, “Preliminary study of Masonry –RC Hybrid Strucuture Behavior under Earthquake Loading” 15 World Conferences on Earthquake Engineering (WCEE) Lisboa, 2012. https://www.iitk.ac.in/nicee/wcee/fifteenth_conf_purtgal/
- K. Yoshimura, K. Kikuchi, M. Kuroki, H. Nokana, K. Tae Kim , R. Wangdi, A. Oshikata, “Experimental study for developing higher seismic performance of brick masonry walls” in 13th World Conference on Earthquake Engineering Vancouver, B.C., Canada, paper No. 1597, 2004. https://www.iitk.ac.in/nicee/wcee/thirteenth_conf_Canada/
- H. Akiyama, M. Teshigawara, H. Kuramoto, F. Kumazawa, Y. Inoue, K. Watanabe, “Development and structural design guideline for medium/high rise RC wall-frame structures with flat beams” in 13th World Conference on Earthquake Engineering Vancouver, B.C., Canada, paper No. 2354, 2004. https://www.iitk.ac.in/nicee/wcee/thirteenth_conf_Canada/
- A. W. Hameed, “Failure modes for different structural types during an earthquake” IJCE Vol. 2, Issue 1, p47-56, 2013file:///C:/Users/User1/ Documents/Articol/New%20folder/2-11-1360748911-6.%20IJCE%20-%20Failures%20Modes%20-%20 Alaa%20W.%20Hameed.pdf
- S. A. El-Betar, “Seismic performance of existing R.C. framed buildings” Elsevier Housing and Building National research center (HBRC) 13, p 171-180, 2015. http://dx.doi/org/10.1016/j.hbrcj.2015.06.001
- P. Naik, S. Annigeri, “Performance evaluation of 9 story RC building located in North Goa” 11th International Symposium on plasticity and Impact Mechanics, Implast 2016 Elsevier Procedia Engineering 173, p 1841 -1846, 2016. doi:10.1016/j.proceng.2016.12.231
- CEN EN 1996-1-1-2006 Eurocode 6: Design of masonry structures – Part 1-1: General rules for reinforced and unreinforced masonry structures, 2006.
- CEN EN 1991-1-1-2004 Eurocode 1: Actions on structures – Part 1-1: General actions- Densities, self-weight, imposed loads for buildings, 2004.
- CEN EN 1990-2004 Eurocode 0: Basics of structural design, 2004
- CEN EN 1991-1-3-2005 Eurocode 1: Actions on structures – Part 1-3: General actions- Snow loads, 2005
- CEN EN 1992-1-1-2004 Eurocode 2: Design of concrete structures – Part 1-1: General rules and rules for buildings, 2004.
- CEN EN 1998-1-2004 Eurocode 8: Design of structures for earthquake resistance. Part 1: General rules, seismic actions and rules for buildings, 2004.
- P100-1/2013 Seismic design code – Part 1- General rules for buildings, 2013.