Slender Confined Masonry Buildings in High Seismic Areas

Adv. Sci. Technol. Eng. Syst. J. 3(6), 118–123 (2018);
 DOI: 10.25046/aj030613
This is a study on a confined masonry slender walls building in a high seismic area. The structure also contains frames, but the walls bear most of the gravity and seismic loads. The building will be used as a school. It will be built in Bucharest, Romania. It contains a ground floor and 2 stories above it. Story height is 4m. The structure is interesting as it is not common practice to use slender masonry walls for buildings with large bays. Such a structure is allowed by the design codes in force but this solution is not often used. The building will be studied in the elastic state, as the structure bears important gravity and seismic loads, then in the plastic state to establish the walls stresses development and the failure mechanism. It is interesting to see how the walls behave in the nonlinear stage, as they are slender, but masonry is a stiff material.
1. Introduction
The paper presents the behavior of slender walls confined masonry buildings, in high seismic areas. The literature points out that slender masonry walls may experience buckling [1] and the axial bearing capacity may be calculated on the deformed shape [2]. Slender walls have less shear force bearing capacity [3]. Confined masonry walls behave well under seismic loading, [4], as the concrete elements increase the energy dissipation, ductility and cracking pattern [5]. Reinforcement bars connecting tie columns to the masonry panels help them work together better [6]. Confining clamps at tie columns tops and bottoms are very important for preventing their shear failure [7]. Masonry walls can behave well in the nonlinear state, as their ductility may be improved by using proper confining reinforced concrete elements [8]. Three dimensional analyses are important as they are able to capture the collapse mechanisms well [9]. Laboratory tests show that confined masonry walls main failing mechanism is diagonal cracking, sliding on the bed joint of brick mortar [10]. It is adequate to analyze a structure’s behavior in the plastic stage, to predict its possible failure mechanism, and the maximum base force it can bear. The moment-curvature diagram may show the ductility or stiffness of the building in study [11]. The structure analyzed here is mostly composed of confined masonry walls, but there are also frames due to the illumination condition. Confined masonry walls are the main bearing elements. The building in study is composed of a ground floor and 2 stories above it. Story height is 4m, and the bays spans are up to 9m, so the masonry walls are very slender. This is a special structure, as nowadays it is most common to use masonry structures with bays up to 5m and story heights up to 3.2m, because masonry is a fragile material and does not behave well under seismic loading. The design codes in force used to design the structure are: [12–18]. The building is a school. It will be built in Bucharest, Romania. This is considered a high seismic area according to the seismic code in force, as the seismic acceleration is 0.30g (g is the gravity acceleration) [18]. The building’s behavior is studied for both elastic and plastic state.
2. Building Description
The structure in study is composed of 3 stories: a ground floor and 2 floors above it. The bays are up to 9m and the story height is 4m. This is regarded as a large bay confined masonry walls building. Confined masonry means that the brick walls are framed by reinforced concrete elements: tie beams (belts) at each story level, placed horizontally and slender columns placed vertically. Those reinforced concrete elements work together with the brick panels. Walls are 30cm thick so the slender columns and the belts need to be 30cm wide. It is allowed to design such buildings in high seismic areas [18]. For confined masonry buildings, in the design code it is recommended to use less strong concrete, class C12/15 or C16/20 [12, 16], because it interacts better with masonry. In Figures 1 and 2 the walls are red, slender columns are green, belts and beams are blue, short beams are white and slabs are grey. This building measures 35m on direction X and 22.25m on Y. Distances between load bearing elements are given in meters. The software used for analysis is ETABS 2016.
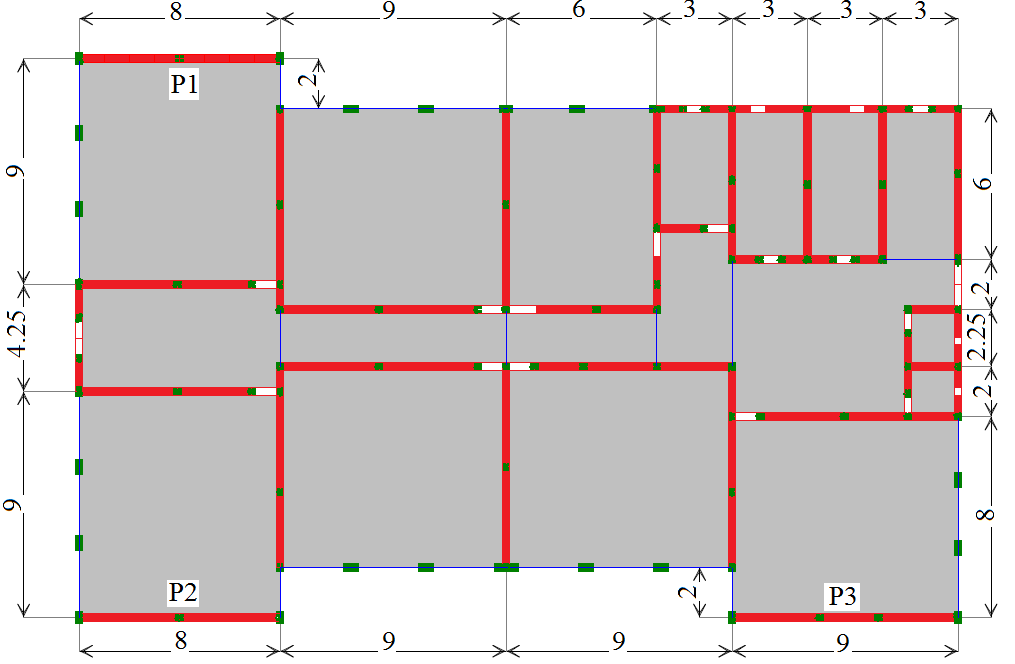 Figure 1 Floor plan
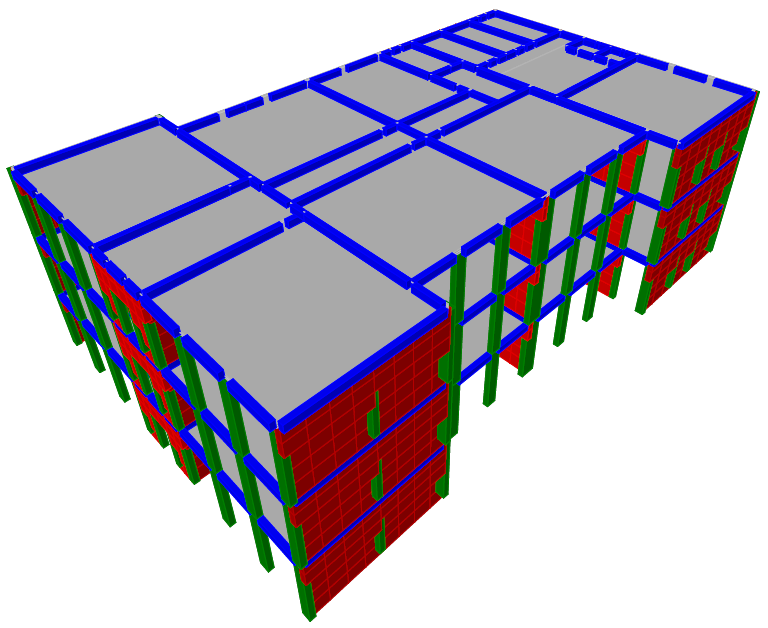 Figure 2 Building in 3D
3. Structure Design Theory
3.1. Materials Used
Materials used here are: concrete C16/20 with EC=29000N/mm2 (E is elasticity modulus) [16] and vertical perforated bricks 290·140·88 (mm) with EM=4500N/mm2 [12] with standard strength fb =10N/mm2 and mortar M10 [12]. Reinforcement bars are S345 ES=210000N/mm2 [16]. The walls stresses analyzed are: σx, σz, τxz, τxy and τyz. They are compared to the masonry strengths (1), (2), (3), (4) and (5) [12]. Horizontal design compression strength is fhd and the vertical one is fd.
fhd = fhk/γM=0.98/2.2=0.445 N/mm2 (1)
fd = fk/γM=4.5/2.2=2.04 N/mm2 (2)
fhk and fk are the characteristic masonry compression strengths. γM is the insurance factor [12]. Design shear strength for horizontal direction fvd,l (3) is calculated by using the characteristic strength (fvk,0) and the unitary vertical stress (σd) [12].
fvd,l =fvk,0/γM+0.4·σd =0.3/2.2+0.4·0.1= 0.18 N/mm2 (3)
Design strength for horizontal and vertical stresses perpendicular to the wall (fxd1 and fxd2) are calculated in (4) and (5) using the characteristic strengths (fxk1 and fxk2) [12]. Concrete and steel reinforcement bars design strengths are determined in (6) and (7) using the characteristic values (fck and fyk) [16].
fxd1= fxk1/γM=0.24/2.2=0.11 N/mm2 (4)
fxd2= fxk2/γM=0.48/2.2=0.22 N/mm2 (5)
fcd=fck/γM=16/1.5= 10.6N/mm2 (6)
fyd=fyk/γM=345/1.15=300 N/mm2 (7)
3.2. Seismic Action Evaluation
The coefficient cs is calculated using the base force Fb in (8) according to [18]. γI,e = 1.2 is the building’s importance-exposure coefficient, β0 = 2.5 is the elastic spectrum maximum value, q is the structure’s behavior factor, q=2.25·αu/α1= =2.25·1.25 [18], αu/α1 = the base shear force value for the failing mechanism/the base shear force value for the first plastic hinge, m = building’s mass, η = 0.88 is the reduction factor according to ξ (damping ratio for masonry) = 8% [16]. λ = 0.85 for 3 stories buildings, ag = 0.30g [18] and G = building’s weight.
Fb=γI,e · β0 · ag· m · λ · η /q =cs · G =0.24·G [kN] (8)
3.3. Walls Bearing Axial Force
The bearing axial force NRd for masonry walls is calculated using [12]. NRd = wall’s bearing axial force at the bottom story, Φi(m)= min (Φi ;Φm) wall strength reduction factor (buckling factor), Φi = wall strength reduction factor at the wall’s top and bottom, Φm = wall strength reduction factor at the wall’s center, t = wall thickness, ei = wall eccentricity at the top and bottom and A= wall section area [12]. The load combination used to determine NEd here is: 1.35·permanent loads+1.5·variable loads.
NRd = Φi(m) · A · fd (9)
Φi =1-2·ei/t (10)
ei = e0i + ehi + ea ≥ 0.05 · t (11)
e0i= 0, vertical loads eccentricity, ehm(i)= eccentricity from forces perpendicular to the wall, N1 = axial load from the upper story wall and N2 = load from the slabs above the story [12]. Mhm(i) = bending moment from forces perpendicular to the wall, ea= accidental eccentricity and hS = story height [12].
ehm(i) = Mhm(i) /(N1+ΣN2) (12)
ea=max(t/30;hs/300;1cm) (13)
em = 2/3·e0i+ehm+ea (14)
Table 1 Walls strength reduction factor at middle story height (Φm)
| slenderness
(hS/t)max |
masonry type | relative eccentricity em/t | |||||
| 0.05 | 0.10 | 0.15 | 0.20 | 0.25 | 0.30 | ||
| 15 | CM | 0.75 | 0.64 | 0.53 | 0.42 | 0.32 | 0.22 |
In Table 1, CM means confined masonry. The maximum walls slenderness allowed is 15 [12]. Φm is determined from Table 1, according to hS/t [12], em = wall eccentricity at middle story height and ehm = eccentricity from forces perpendicular to the wall, at middle story height [12].
3.4. Walls Bearing Bending Moment
The bearing bending moment MRd for masonry walls associated to the design axial force NEd [12] is calculated in (15). Walls compressed area is AC. The bearing bending moment borne by the masonry area is MRd(M) (17). yc is the distance from the wall’s weight center to the compressed masonry area center [12]. The bearing bending moment borne by the slender columns reinforcement at the wall ends is MRd(As) (18). The load combination used to determine NEd and MEd here is: 1.0·permanent loads+0.4·variable loads+1.0·seismic loads.
MRd = MRd(M) + MRd(As) [kNm] (15)
AC=NEd/(0.85·fd) [mm2] (16)
MRd(M) = NEd · yc [kNm] (17)
MRd(As) =ls·As·fyd [kNm] (18)
fyd = 300N/mm2 is the reinforcement bars design strength. las is the distance between slender columns at the walls ends. As is the slender columns longitudinal reinforcement area. Cc is the compressed area gravity center. C is the wall section gravity center. S is the seismic action [12]. b=n·t and n=fcd/fd.
b = t · fcd/fd (19)
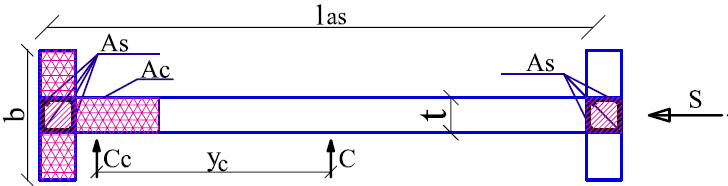 Figure 3 Wall horizontal section
4. Building Design Results
The results shown here are story displacements, steel reinforcements in concrete elements and efforts in the walls most vulnerable to seismic action. They are vulnerable because they are slender and not connected to other walls on the other direction, so they are susceptible to fogging.
4.1. Building Story Displacements
The story displacements will be checked for the elastic state, for both directions X and Y. In the elastic state, the maximum relative story displacements are dr=0.07cm on direction X and dr=0.15cm on direction Y. Maximum displacements are calculated with formulas (20) and (21), considering the building has fragile non-bearing elements, are checked for direction X (0.098cm< 2cm) in (20) and for direction Y (0.21cm<2cm) in (21). hS =4m is the story height, ν=0.5 is a reduction factor for class I and II importance buildings and q=2.81 is the structure’s behavior factor [18].
dr ·ν ·q = 0.10cm ≤ 0.005 ·hS=2cm (20)
dr ·ν ·q = 0.21cm ≤ 0.005 ·hS=2cm (21)
4.2. Reinforcement for Concrete Elements
According to the design results [16], the reinforced concrete elements dimensions and reinforcements are described in Table 2. As is the longitudinal reinforcement in concrete slender columns, belts, columns and beams [16]. The bars are seen in each figure as black circles and the diameter (Φ) of bars is 16mm.
Table 2 Concrete elements reinforcement
| Column 30×50
As →8Φ16 |
Slender column 30×30 As →4Φ16 | Column 30×40 As →6Φ16 | Column 30×60 As →12Φ16 | Beams and belts 30×40
As →8Φ16 |
4.3. Confined Masonry Walls Susceptible to Fogging
The most susceptible walls to loss of axial bearing capacity due to buckling are P1, P2 and P3 seen in Figure 1. They are situated on direction X. Those walls are not connected to other walls on the perpendicular direction.
Table 3 Confined masonry walls with high fogging probability
| P1 | P2 | P3 | |||||||
| NEd [kN] | Φi(m) | NRd [kN] | NEd [kN] | Φi(m) | NRd [kN] | NEd [kN] | Φi(m) | NRd [kN] | |
| story 3 | 640 | 0.22 | 1368 | 637 | 0.23 | 1422 | 745 | 0.28 | 1931 |
| story 2 | 1289 | 0.62 | 3857 | 1238 | 0.62 | 3835 | 1498 | 0.64 | 4413 |
| story 1 | 1918 | 0.66 | 4106 | 1909 | 0.86 | 5319 | 2231 | 0.7 | 4827 |
5. Building Nonlinear Analysis
Two pushover cases (PX and PY) are used for the building’s nonlinear analysis. Each case determines the building’s stresses and plastic hinges development on an orthogonal direction.
5.1. Plastic Hinges in Final Stages
Figures 4 and 5 show the final stages of development for plastic hinges on both directions. The color code is the following: B (pink) means the plastic hinge is formed, IO (blue) is for immediate occupancy, LS (light blue) is for life safety, CP (green) is for collapse prevention, C (yellow) means the plastic hinge reaches the limit and the element gives out, D (brown) means the load was redistributed and E (red) means collapse. Those colors are seen in the figures that show the pushover analysis last steps. For both pushover cases, the analysis ends when plastic hinges reach stage D. For PX, there are fewer hinges in stage D. Hinges in stage D are formed at the ends of walls coupling beams. Figures 4 and 5 show the plastic hinges but also the masonry walls as translucent light grey. This is done in order for the figures to be more complete and the masonry walls not to obstruct the plastic hinges visibility.
5.2. Pushover Diagrams
The pushover diagrams show a stiff behavior on both directions. There are 24 steps for the nonlinear analysis on direction X and 21 steps on direction Y. Some steps are far from each other and some are very close, so they look overlapped. The rigidities remain the same until the structure becomes a mechanism. The structure’s rigidity (base force/top displacement ratio) on direction X is 3806501kN/m, greater than 2269242kN/m for direction Y. The building reaches a higher displacement (143 mm) and a higher base force (545091kN) for direction X.
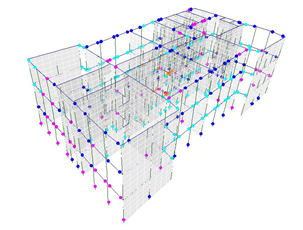 Figure 4 Plastic hinges for case PX at step 24
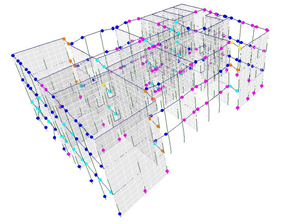 Figure 5 Plastic hinges for case PY at step 21
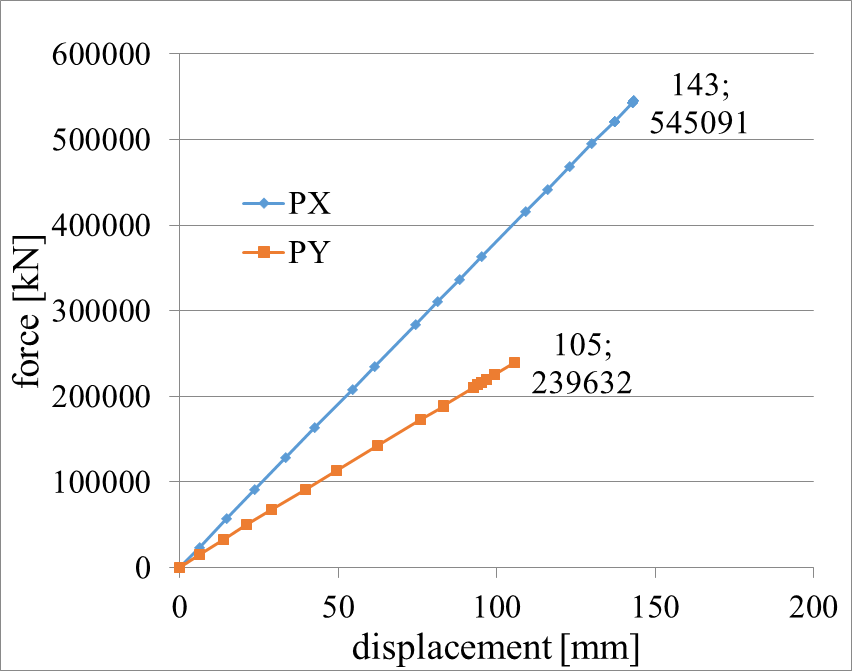 Figure 6 Pushover curves for PX and PY
5.3. Walls Stresses
The maximum value for each stress is written after the analysis step number. The highest values are reached at joints between beams and walls as the stress is transmitted between those elements. There are also increased stress values at the walls corners on the same direction as the pushover case, one corner is crushed and the other is stretched. The maximum value for each stress is written after the analysis step number.
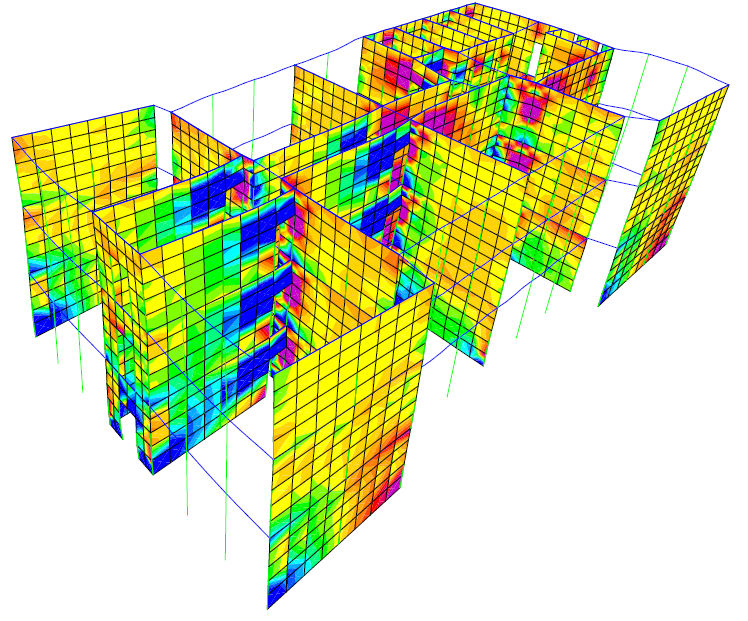 Figure 7 PX step 4 σx=0.6N/mm2
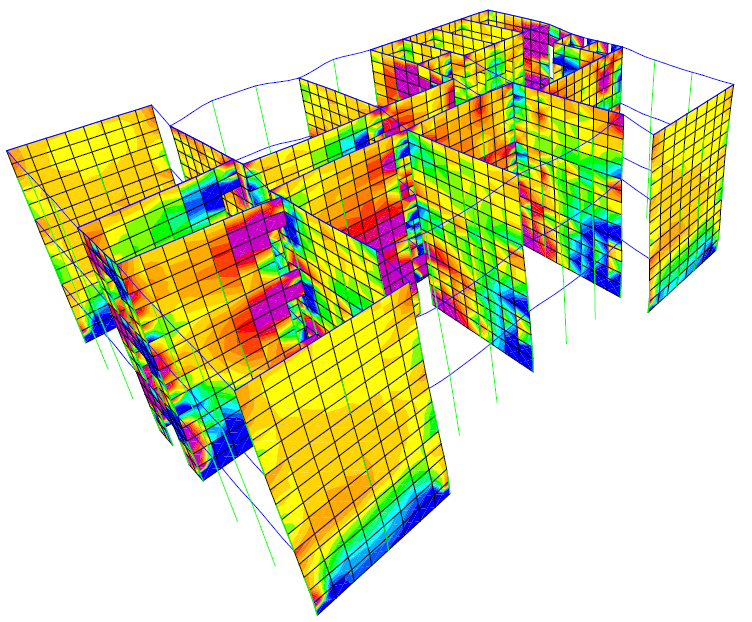 Figure 8 PY step 6 σx=0.6N/mm2
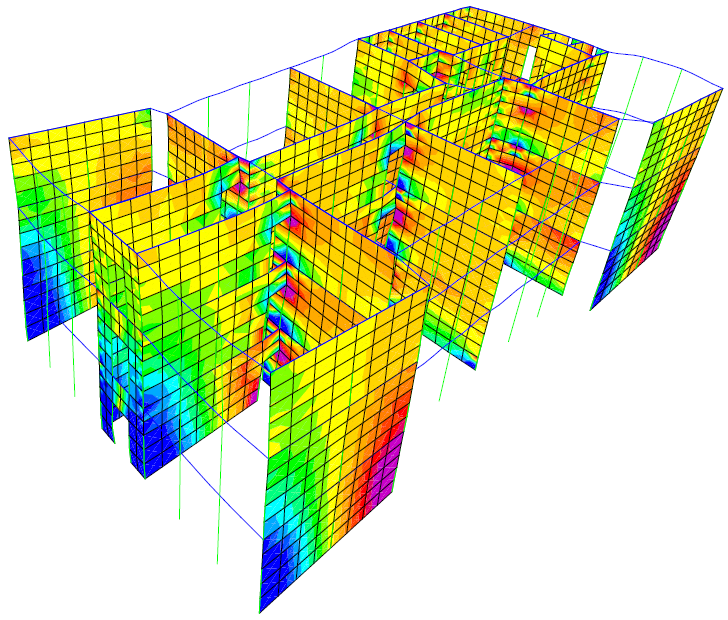 Figure 9 PX step 4 σz=2.5N/mm2
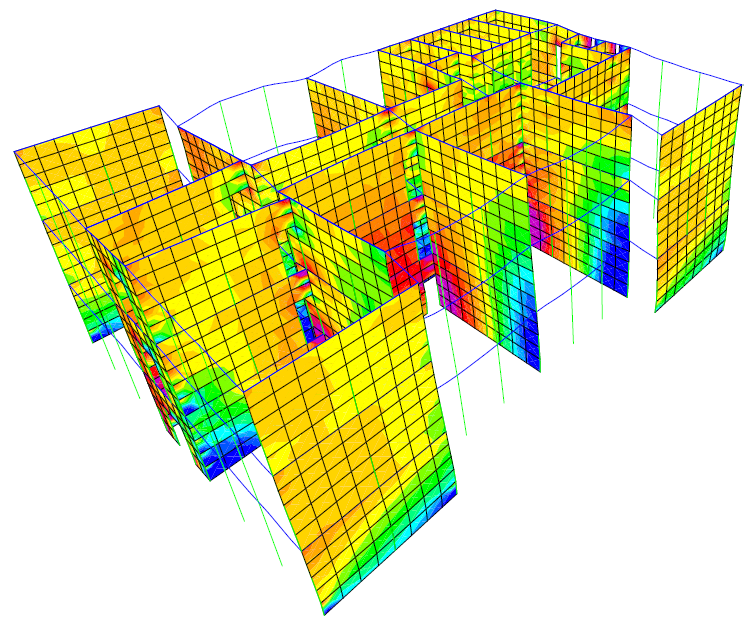 Figure 10 PY step 5 σz=2.5N/mm2
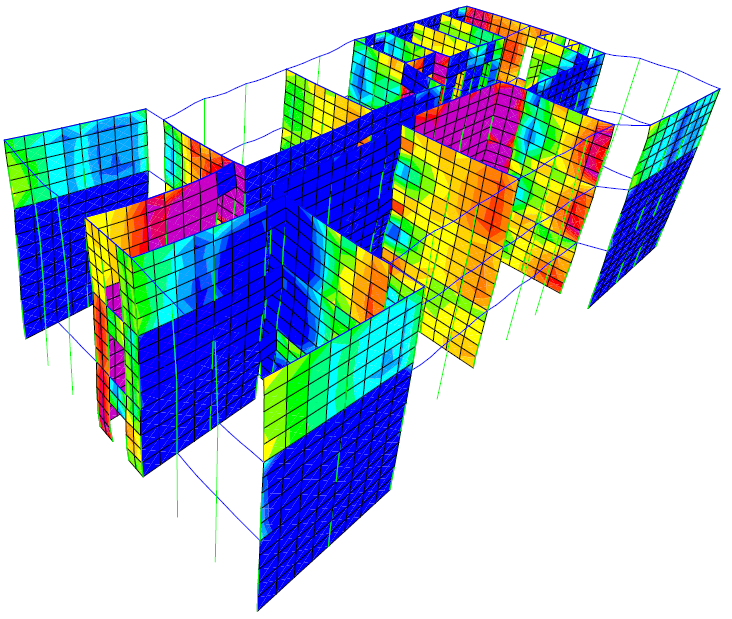 Figure 11 PX step 1 τxz=0.25N/mm2
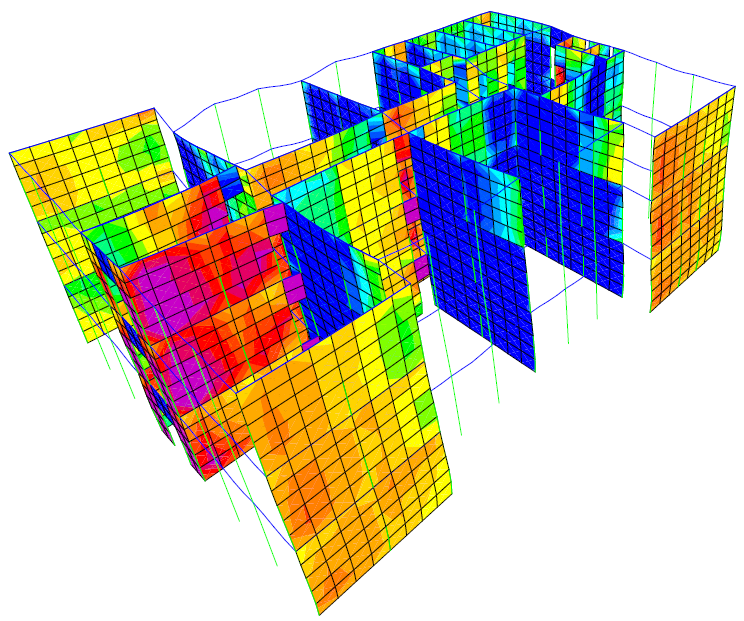 Figure 12 PY step 1 τxz=0.25N/mm2
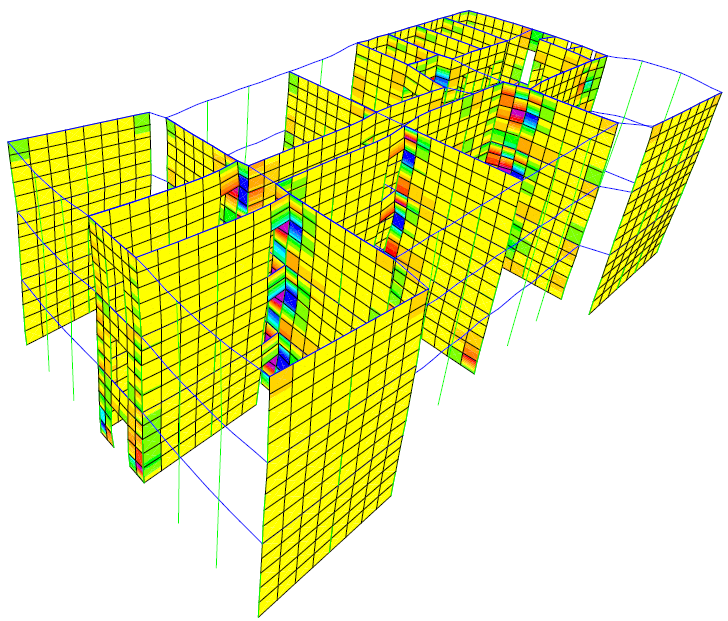 Figure 13 PX step 4 τxy=0.15N/mm2
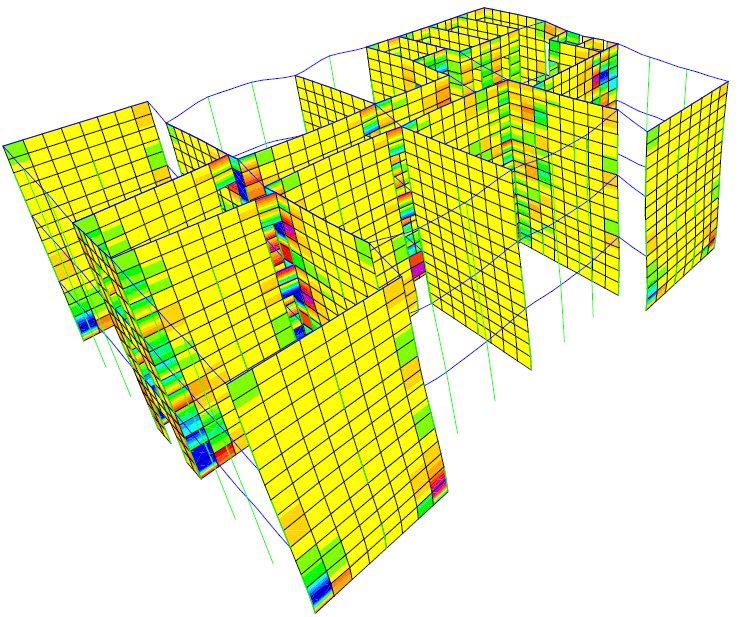 Figure 14 PY step 12 τxy=0.15N/mm2
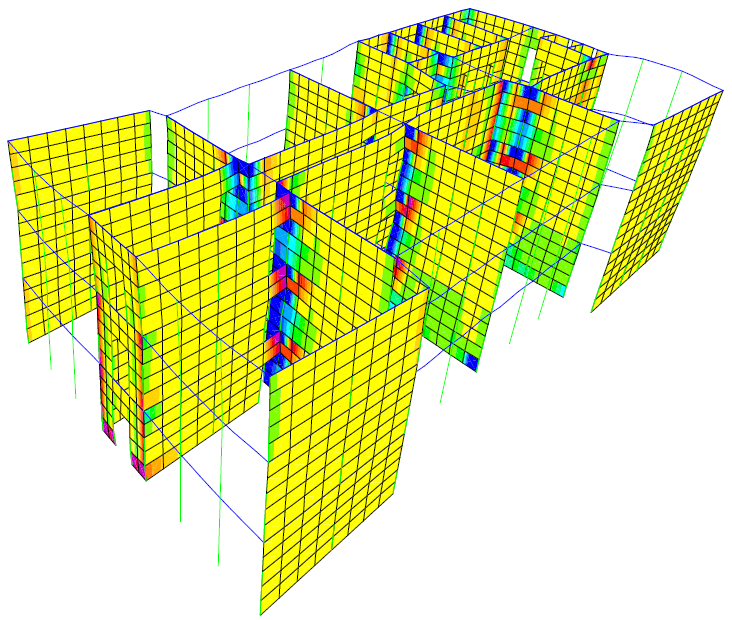 Figure 15 PX step 5 τyz=0.26N/mm2
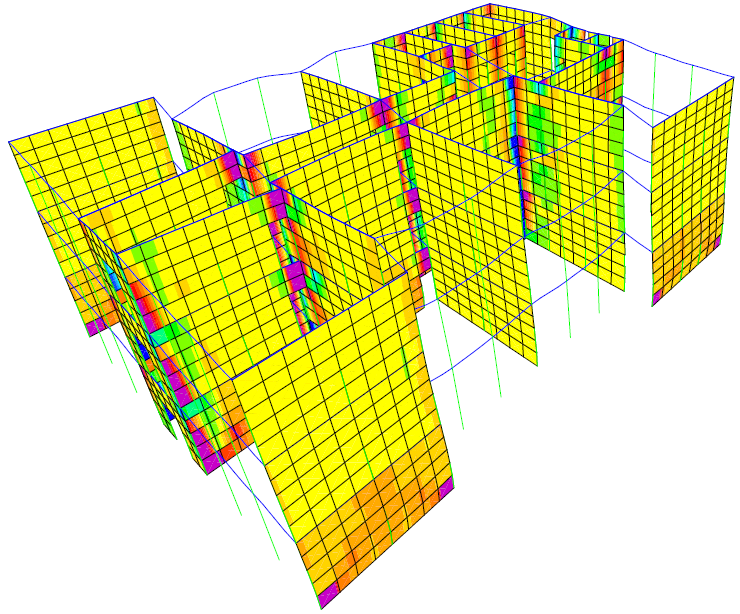 Figure 16 PY step 13 τyz=0.26N/mm2
6. Discussions
The building has a slender structure and the walls are made of a low strength material. There are 3 walls susceptible to fogging as they are developed on one direction only. The reinforced concrete elements are placed in accordance with the masonry code in force [18]. Additional reinforced concrete bands or lintels and slender columns may be provided in walls. In this latter case, walls would behave less slender. The walls fogging phenomenon would be less visible, as the confined masonry walls would behave more like concrete walls.
The building’s lateral displacements in the elastic stage are lower than the maximum values accepted by [18]. The reinforcement needed for beams, columns, bands and slender columns is within the range demanded by [18]. This means the efforts in concrete elements are within the desired range for the elastic state.
The nonlinear analysis ends when plastic hinges reach stage D for both pushover cases PX and PY. There are more hinges in stage D for PY. Hinges in stage D are seen at the ends of walls coupling beams. The pushover diagrams show a higher rigidity on direction X. For case PX, the graphic has a higher slope. This slope is calculated as the base force/ top displacement ratio. This ratio is called rigidity. Both diagrams show the same rigidity, as both their slopes remain unchanged until the analysis ends. The analysis ends when the structure is turned into a mechanism by the plastic hinges giving in. The structure gives in at a lower base force and displacement on direction Y. This is explained by the 3 walls susceptible to buckling on that direction. All masonry walls crack before the plastic mechanism is reached. The fogging phenomenon is seen very clearly for stresses σx and σz. All masonry walls get local damage from crushing at the bottoms before the structure turns into a mechanism.
7. Conclusions
The building can bear both gravity and seismic loads, although it has a slender structure and the walls are made of a low strength material.
Lateral displacements generated by the seismic combination are allowed by the code in force.
Confined masonry walls developed only on one direction are susceptible of fogging.
In the nonlinear stage the building remains stiff until it turns into a plastic mechanism.
Both pushover diagrams PX and PY are straight lines, so the structure’s rigidity is maintained the same until it collapses.
The structure reaches lower stress values in walls on direction Y.
Conflict of Interest
The author declares no conflict of interest.
- C. Cornado, J.R. Rosell, J. Leiva, C. Diaz, “Experimental study of brick masonry walls subjected to eccentric and axial load” RILEM International Conference on Materials, Systems and Structures in Civil Engineering Conference segment on Historical Masonry Technical University of Denmark, Lyngby, Denmark p 33- 40, 2016. www.rilem.net/publications/proceedings-500218
- C. Glock, C. A. Graubner, “Design of slender unreinforced masonry walls” 13th International Brick and Block Conference Amsterdam, 2004. No 3 www.hms.civil.uminho.pt/ibmac/2004/
- J.J. Perez-Gavilan, L.E. Flores, A. Manzano, “A new shear strength design formula for confined masonry walls: proposal to the Mexican code” Tenth U.S. National Conference of Earthquake Engineering Frontieres of Earthquake Engineering Anchorage, Alaska, 2014. July 21-25 https://www.eeri.org/products-page/national-conference-on-earthquake-engineering/10th-u-s-national-conference-on-earthquake-engineering-frontiers-of-earthquake-engineering-proceedings-thumb-drive/
- M. Dhanasekar, “Shear in reinforced and unreinforced masonry: response, design and construction” The Twelfth East Asia Pacific Conference on Structural Engineering and Construction , Elsevier Procedia Engineering Vol 14. p 2069- 2076, 2011. doi:10.1016/j.proceng.2011.07.260
- A. Marinilli, E. Castilla, “Experimental evaluation of confined masonry walls with several confining columns” 13th World Conference on Earthquake Engineering Vancouver, B.C., Canada paper No. 2129, 2004. https://www.iitk.ac.in/nicee/wcee/thirteenth_ conf_ Canada/
- K. Yoshimura, K. Kikuchi, M. Kuroki, H. Nokana, K. Tae Kim, R. Wangdi, A. Oshikata, “Experimental study for developing higher seismic performance of brick masonry walls” 13th World Conference on Earthquake Engineering Vancouver, B.C., Canada; 2004 paper No. 1597, 2004. https://www.iitk.ac.in/nicee/wcee/thirteenth_conf_Canada/
- A. Chourasia, S.K. Bhattacharyya, P K. Bhargava, N. M. Bhandari “Influential aspects on seismic performance of confined masonry contruction” Scientific research An academic publisher Natural science Vol. 5. Nr. 8. A1, 2013. http://dx.doi.org/10.4236/ns.2013.58A1007 p56-62.
- D. Liu, M. Wang, “Masonry structures confined with concrete beams and columns” 12th World conference on Earthquake Engineering, Auckland, New Zeeland, 2000. http://www.worldcat.org/title/12wcee-2000-12th-world-conference-on-earthquake-engineering-auckland-new-zealand-sunday-30-january-friday-4-february-2000/
- A. Alexandris, E. Protopapa, I. Psycharis “Collapse Mechanisms of masonry buildings derived by the distinct element method” 13th World Conference on Earthquake Engineering Vancouver, B.C., Canada paper No. 548, 2004. www.researchgate.net/publication/264850141_Collapse_mechanisms_of_masonry_buildings_derived_by_the_distinct_element_method
- W. Wijaya, D. Kusumastuti, M. Suarjana, R. Rildova, K Pribadi “Experimental Study on Wall-Frame Connection of Confined Masonry Wall” The Twelfth East Asia –Pacific Conference on Structural Engineering and Construction Elsevier Procedia Engineering 14 p 2094-2102, 2011 doi:10.1016/j.proceng.2011.07.263
- P. Naik, S. Annigeri, “Performance evaluation of 9 story RC building located in North Goa” 11th International Symposium on plasticity and Impact Mechanics, Implast 2016 Elsevier Procedia Engineering 173, p 1841-1846, 2017. doi:10.1016/j.proceng.2016.12.231
- CEN EN 1996-1-1-2006 Eurocode 6: Design of masonry structures – Part 1-1: General rules for reinforced and unreinforced masonry structures, 2006.
- CEN EN 1991-1-1-2004 Eurocode 1: Actions on structures – Part 1-1: General actions- Densities, self-weight, imposed loads for buildings, 2004.
- CEN EN 1990-2004 Eurocode 0: Basics of structural design, 2004
- CEN EN 1991-1-3-2005 Eurocode 1: Actions on structures – Part 1-3: General actions- Snow loads, 2005
- CEN EN 1992-1-1-2004 Eurocode 2: Design of concrete structures – Part 1-1: General rules and rules for buildings, 2004.
- CEN EN 1998-1-2004 Eurocode 8: Design of structures for earthquake resistance. Part 1: General rules, seismic actions and rules for buildings, 2004.
- P100-1/2013 Seismic design code – Part 1- General rules for buildings, 2013.
No related articles were found.