Non-bearing Masonry Walls Behavior and Influence to High Reinforced Concrete Buildings

Adv. Sci. Technol. Eng. Syst. J. 3(6), 111–117 (2018);
 DOI: 10.25046/aj030612
This is a study on non-bearing masonry walls, in a high, reinforced concrete walls building. It will be built in Bucharest, Romania. This is a high seismic area. The building will be used as a dwelling. The structure is composed of a ground floor and 10 stories above. It is interesting to see the interaction between the structure and the partitioning masonry walls. The paper presents the non-bearing walls design, the structure’s behavior in the elastic and plastic stage, in particular the failing mechanism and the non-bearing walls stresses development. The paper will also compare the non-bearing walls seismic force from the design code and from the model. It will show the non-bearing walls important effect on the structure’s behavior in the elastic and plastic stage.
1. Introduction
The paper presents the behavior of non-bearing masonry walls in high buildings built in high seismic areas. It is common to use masonry walls as partitions for high structures. They increase the lateral stiffness [1]. The literature contains studies showing the masonry walls capacity decreases with height, so they cannot be used as load bearing elements for a high structure like the one in study. Important cracks develop and reduce the bearing capacity by 40 to 60% [2, 3]. In many seismic countries, dwellings are built using reinforced concrete walls and nonbearing masonry walls [4]. Non-bearing masonry walls may get cracked from tensile stress from the concrete elements around them as they are subjected to deformation. [5]. On the other hand, very stiff masonry walls may crush the concrete structure [6]. Masonry does not perform well to lateral loads, as is gives in at shear stresses under 0.7 N/mm2 [7]. The collapse process for non-bearing masonry walls in reinforced concrete walls buildings is important to be studied. This way the weakest elements can be strengthen and the collapse mechanism can be modified as needed [8]. Masonry stress-strain diagram shows stiffness degradation. The axial loading is a material degradation phenomenon caused by internal defects. This causes the process of crack extension until failure [9]. Pushover analysis can be used to predict a structure’s failing mechanism, the maximum base force reached and rigidity loss. The plastic hinges are presumed to develop first at the beams ends due to exceeding the bearing bending moment [10, 11]. The analyzed building is a dwelling. The structure contains reinforced concrete walls, beams connecting these walls and slabs. There are also non-bearing masonry walls. They can change a structure’s behavior, as it will be shown here. The codes in force used to design the building are: [12–18]. It is important to establish the masonry walls behavior and the influence they have on the structure for the elastic and plastic stage. Nonlinear analysis for masonry is not something very common, as masonry is not a ductile material in itself.
2. Building Components
2.1. Building Description
The building in study is composed of a ground floor and 10 stories above it. Story height is 3m. It will be built in Bucharest, Romania. This is considered a high seismic area according to the seismic code in force, as the seismic acceleration is 0.30g (g is the gravity acceleration) [18]. For high buildings it is accustomed to use reinforced concrete walls, as both vertical and seismic loads reach important values. The structure is composed of reinforced concrete walls, beams and slabs. There are also non-bearing masonry walls at each story. These walls may or may not be used as elements in the structure’s model. They do, however change the building’s behavior, by increasing its stiffness. Both concrete and masonry walls are 25cm thick. The floor plan is presented in Figure 1. The structure in 3D is shown in Figure 2. Figures 3 and 4 explain the bays dimensions and the placement of concrete and masonry walls. In Figure 1 slabs are green and in Figure 2 they are grey. In both these figures beams are blue and walls are red. Figure 3 shows the concrete walls red with grey filling.
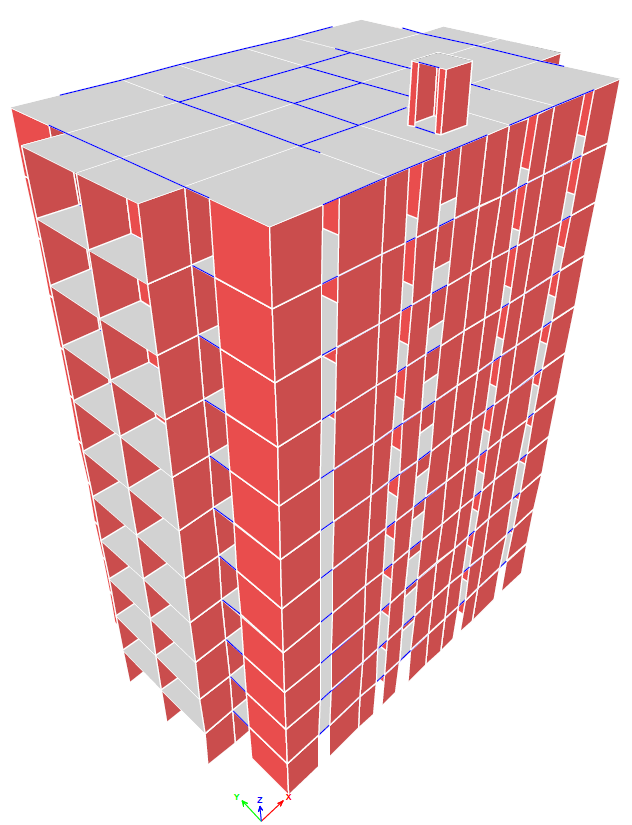 Figure 1: Structure in 3D
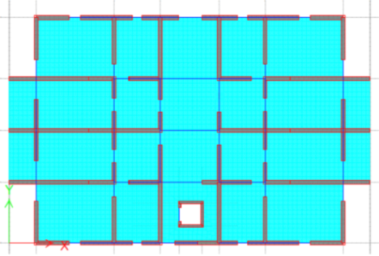 Figure 2: Floor plan
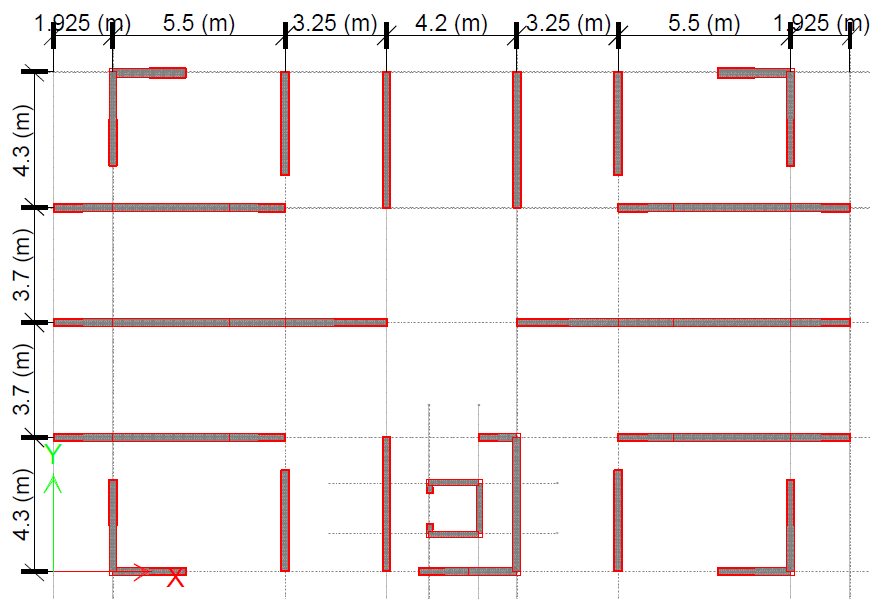 Figure 3: Reinforced concrete walls
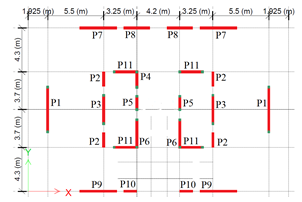 Figure 4: Masonry walls
Figure 4 contains the masonry non-bearing walls red and the slender columns green. The walls names used in design are also written. The software used for analysis is ETABS 2016.
2.2. Materials Properties
Materials used here are concrete C30/37 with elasticity modulus EC=33000N/mm2 and full bricks 240·115·63 (mm) with standard strength fb =12.5N/mm2, mortar strength fm=7.5N/mm2 and masonry elasticity modulus is EM= 1000 · fk = 4700N/mm2 in the elastic analysis [12]. Reinforcement bars are Bst 500. Steel elasticity modulus ES=210000N/mm2 [16]. Design strengths for concrete and steel are calculated using the characteristic values (fck and fyk) [12]. The walls stresses analyzed are: σx, σz and τxz.
fcd=fck/γM=30/1.5= 20N/mm2 (1)
fyd=fyk/γM=500/1.15=435 N/mm2 (2)
They are compared to masonry strengths in (4), (5) and (6). Design compression strengths on the horizontal (fhd) and on the vertical direction (fd) are determined from the characteristic masonry compression strengths (fhk and fk) using the insurance factor (γM) [12]. In (3) K=0.55 for full bricks [12]. Design shear strengths for horizontal and inclined direction (fvd,0 and fvd,i) are calculated by using the characteristic strengths (fvk,0 and fvk,i). fbt= 0.035·fb is the masonry characteristic tension strength [12].
fk = 0.8· K· fb0.7· fm0.3 N/mm2 (3)
fhd = fhk/γM=1.91/1.9=1.0 N/mm2 (4)
fd = fk/γM=4.7/1.9= 2.47 N/mm2 (5)
fvd,0 =fvk,0/γM = 0.3/1.9= 0.158 N/mm2 (6)
fxd1= fxk1/ γM =0,24/1,9= 0,126 N/ mm2 (7)
fxd2= fxk1/ γM =0,48/1,9 = 0,25 N/mm2 (8)
fvd,i =fvk,i/γM= 0.22·fbt·(1+5·σ0d/fbt)/γM= 0.07 N/mm2 (9)
σ0d in (9) is the unitary pressure stress perpendicular to the shear stress direction. Design strength for horizontal and vertical stresses perpendicular to the wall (fxd1 and fxd2) are calculated in (7) and (8) using the characteristic strengths (fxk1 and fxk2) [12]. The concrete used is C16/20 (EC=29000N/mm2) for the slender columns connected to the masonry walls and the reinforcement bars steel is S355 (ES=210000N/mm2). These materials are not as strong as C30/37 and Bst 500, so they work better together with masonry. The strengths for C16/20 and S355 used for slender columns are seen in (10) and (11).
fcd=fck/γM=16/1.5= 10.6N/mm2 (10)
fyd=fyk/γM=355/1.15=309 N/mm2 (11)
3. Design Code Theory
3.1. Masonry Walls Bending Moments
Bearing bending moments perpendicular to the wall MRxd1 (horizontal) and MRxd2 (vertical) are calculated according to the design strengths perpendicular to the wall [12]. These values will be compared to the design bending moments values, MExd1 (horizontal) and MExd2 (vertical) [12] calculated from the model.
MRxd1 = Ww · (fxd1 +σdw) (12)
MRxd2 = Ww · fxd2 (13)
Ww= 1000 · t2/6 is the wall resistance modulus (in mm3/m), t is the wall thickness, σdw is the compression stress at the wall’s middle height section [12], γmas =18kN/m3 is masonry weight per cubic meter and Hw =2.5m is masonry walls height. The material properties written in this chapter are used in the elastic analysis together with the poisson’s ratio ν=0.2 for concrete and ν=0.3 for masonry and steel.
σdw =γmas · Hw/2=18 ·2.5/2=0.0225 N/mm2 (14)
Ww=1000 · t2/6=1000 · 2502/6=10416666 mm3/m (15)
MRxd1=10416666.67·(0,126+0.0225)=1.546 kNm/m (16)
MRxd2=10416666.67·0,25= 2.604 kNm/m (17)
3.2. Seismic Action Evaluation
The base seismic force is calculated using: the building’s importance-exposure coefficient γI,e = 1.2, the elastic spectrum maximum value β0 = 2.5 and the structure’s behavior factor q=3·kw·αu/α1=3·1·1.15=3.45 [18]. αu/α1 = the base shear force value for the failing mechanism/the base shear force value for the first plastic hinge, m = building’s mass. λ = 0.85 for buildings higher than 3 stories, ag = 0.30g [18], G = building’s weight. This is a medium ductility structure: DCM [18].
Fb= γI,e·β0·ag·m·λ/q= cs·G=0.24·G [kN] (18)
3.3. Seismic Force Perpendicular to the Masonry Walls
FNBW(z)=γI,e·ag·βNBW·kz·mNBW/qNBW=1.88kN/m2 (19)
The force is considered uniformly distributed, perpendicular to the non-bearing walls [18]. βNBW =1 is the non-bearing walls amplification factor, kz is a coefficient according to the non-bearing wall’s level (the distance to the building’s base), z is the non-bearing wall’s level and H is the building height [18].
kz=1+2·z/H (20)
kz=(kz1+kz2)/2=(1+2·z1/H+1+2·z2/H)/2=
=(1+2·33/33+1+2·30/33)/2=2.91 (21)
kz1 and kz2 are coefficients that refer to the highest and lowest points of the wall. Of course, the greatest value for kz is calculated at the top building story. qNBW =2.5 is the behavior factor for non-bearing walls. mNBW =γmas · t =18 · 0.25= 4.5kN/m2 is the wall mass/m2. Seismic force value FNBW is limited as (22) shows [18].
0.75· γI,e ·ag ·mNBW ≤FNBW≤4·γI,e ·ag ·mNBW (22)
0.75·1.2·0.30·4.5kN/m2 ≤ 1.57 kN/m2 ≤4·1.2·0.30·4.5 kN/m2
1.215 kN/m2≤1.57 kN/m2≤6.48 kN/m2
3.4. Masonry Walls Design
The masonry walls are not loaded as much as bearing walls would be, but they are subjected to sectional efforts: axial force NEd, bending moment MEd and shear force VEd.
MRd = MRd(M) + MRd(Aas) [kNm] (23)
MRd(M) and MRd(Aas) are the bending moments the masonry area and slender columns can take. The wall compressed length is lC. z is the distance from the wall’s weight center to the compressed masonry area center.
lC=NEd/(0.85·t·fd) [mm2] (24)
MRd(M) = NEd · z [kNm] (25)
MRd(As) =ds·As·fyd [kNm] (26)
ds is the distance between the slender columns at the wall’s margins centers. As is the slender columns reinforcement area. t·lC =CA is the walls compressed area. zWC is the compressed area center. The wall section center is WC. E is the earthquake action. VRd is the confined masonry walls bearing shear force and VRd1* is the bearing shear force taken by the masonry panel [12]. VEd is the horizontal shear force from seismic loads.
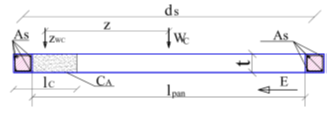 Figure 5 Confined masonry wall section
VRd2 is the bearing horizontal shear force from the slender column reinforcement at the walls compressed edge. As is the reinforcement area in the slender column at that walls edge. λc is the reinforcement participation factor [12]. hpan is the masonry wall height (2.5m). The load combination used to design the structure is 1.0·permanent loads+0.4·variable loads+1.0·seismic loads.
VRd = VRd1*+VRd2 [kN] (27)
VRd1*= 0.4 · NEd+ 0.8·VEd·hpan/lpan [kN] (28)
VEd ≤ lpan· t · fvd,0 (29)
VRd2 = λc · As · fyd [kN] (30)
4. Elastic Stage Results
4.1. Masonry Nonbearing Walls Stresses
Piers P1, P3, P4, P5, P6 and P11 need slender columns reinforced with As consisting of 4 bars of 14mm diameter, to withstand the bending moment and shear force they are subjected to. The piers names are shown in Figure 4. Efforts in piers vary slightly from one story to another. Theoretically, non-bearing walls are subjected only to their own weight and the seismic force according to that weight. However, those non-bearing walls are placed in different places and on different stories in a high structure. The position of each wall in the structure influences the efforts they are subjected to.
Table 1 Masonry walls design and bearing efforts
| Wall (pier) | Wall length
[mm] |
NEd [kN] | MEd [kNm] | MRd
[kNm] |
As [mm2] | VEd [kN] | VRd [kN] |
| P1 | 4350 | 68 | 85 | 1021 | 616 | 12 | 97 |
| P2 | 1425 | 24 | 15 | 16 | 0 | 4 | 41 |
| P3 | 2750 | 46 | 89 | 634 | 616 | 8 | 88 |
| P4 | 1525 | 29 | 40 | 360 | 616 | 4 | 81 |
| P5 | 1275 | 26 | 20 | 307 | 616 | 7 | 80 |
| P6 | 2675 | 59 | 179 | 634 | 616 | 4 | 93 |
| P7 | 3650 | 76 | 60 | 133 | 0 | 10 | 62 |
| P8 | 2550 | 50 | 26 | 61 | 0 | 7 | 51 |
| P9 | 3650 | 76 | 32 | 133 | 0 | 10 | 62 |
| P10 | 1275 | 32 | 11 | 19 | 0 | 11 | 44 |
| P11 | 2225 | 65 | 47 | 525 | 616 | 47 | 89 |
4.2. Natural Vibration Periods
The influence of non-bearing masonry walls to the structure’s stiffness is evaluated first in the elastic stage, by the natural vibration periods. The building with non-bearing masonry walls building shows values reduced to 88%.
Table 2 Natural vibration periods
| Natural vibration periods for reinforced building with non-bearing masonry walls | Natural vibration periods for reinforced building without non-bearing masonry walls | |
| Mode 1 | 0.581s | 0.659s |
| Mode 2 | 0.471s | 0.545s |
| Mode 3 | 0.382s | 0.417s |
4.3. Story Displacements
The story displacements diagram shows very similar values for X and Y at all stories (story height=3m) if masonry nonbearing walls are present. Story displacements are greater if there are no stiff partitioning walls. The highest values are reached on Y. This may be because there are 4 long concrete walls on direction X, that provide stiffness to the structure. It is interesting that the nonbearing walls balance the building stiffness, at least for the elastic stage.
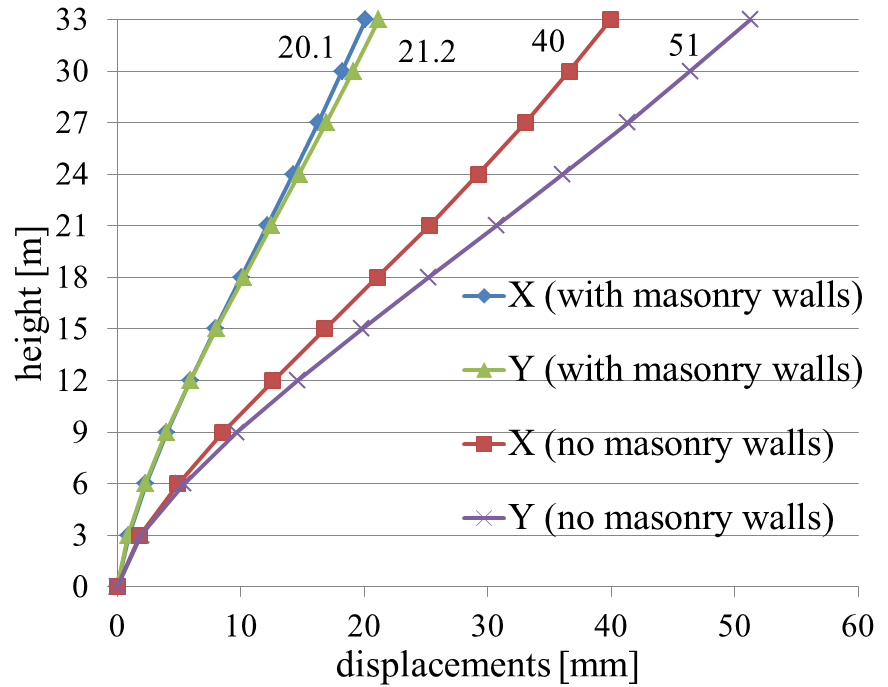 Figure 6 Story displacements
5. Plastic Stage Behavior
Four pushover cases (PX, PY, PX1 and PY1) are used for the building’s nonlinear analysis. PX and PY diagrams resulted from pushover cases on directions X and Y when the masonry non-bearing walls were taken into consideration in the structure’s analysis. PX1 and PY1 diagrams resulted from pushover cases on directions X and Y without the masonry non-bearing walls in the analysis. It is considered the analysis ends when the chosen displacement (500mm) is reached. The study only highlights the beams plastic hinges development.
5.1. Nonlinear Hinges Development
Figures 7 to 10 show the development stages for plastic hinges in beams, when the chosen displacement is reached.
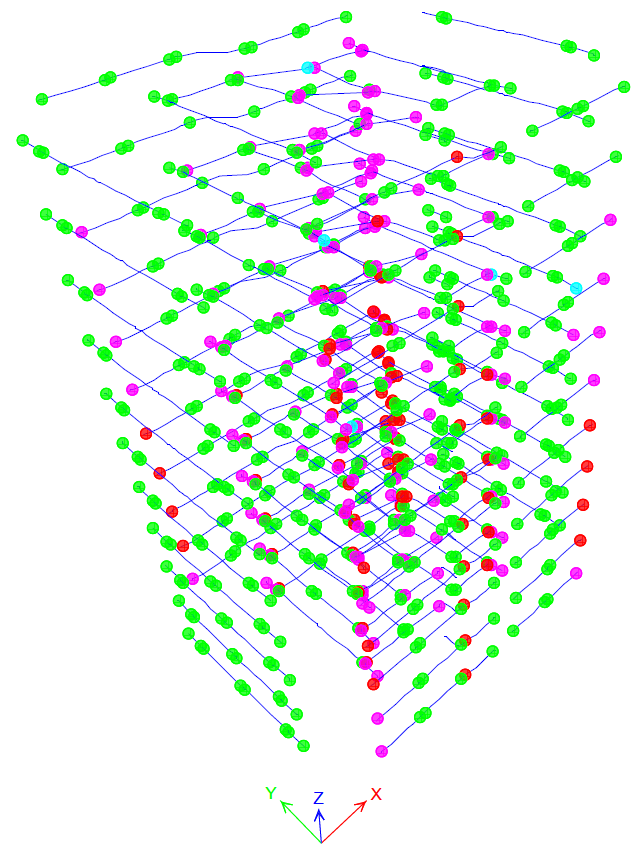 Figure 7 PX at step 90
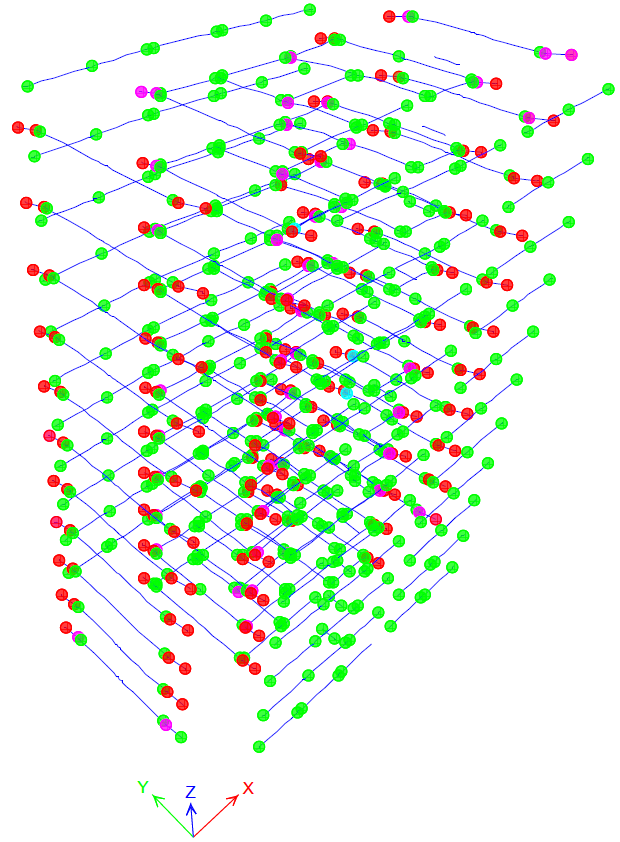 Figure 8 PY at step 98
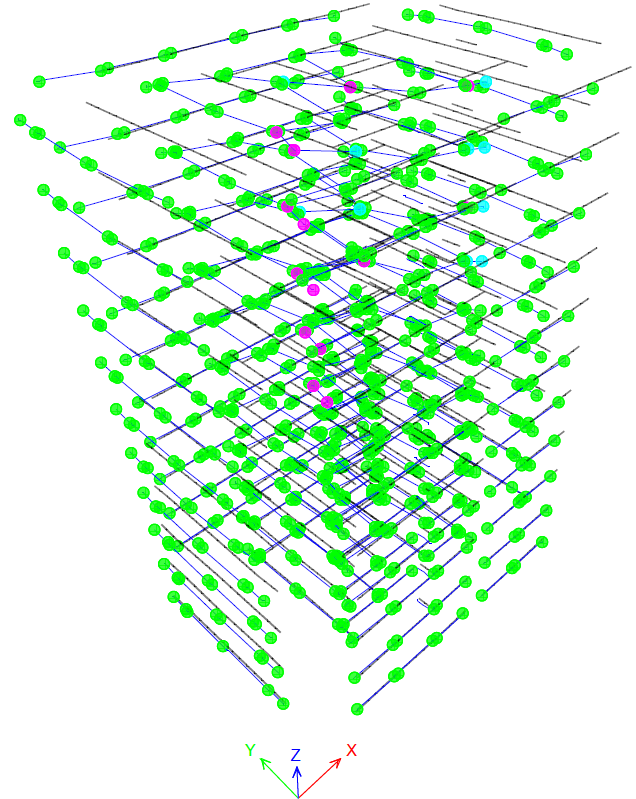 Figure 9 PX1 at step 151
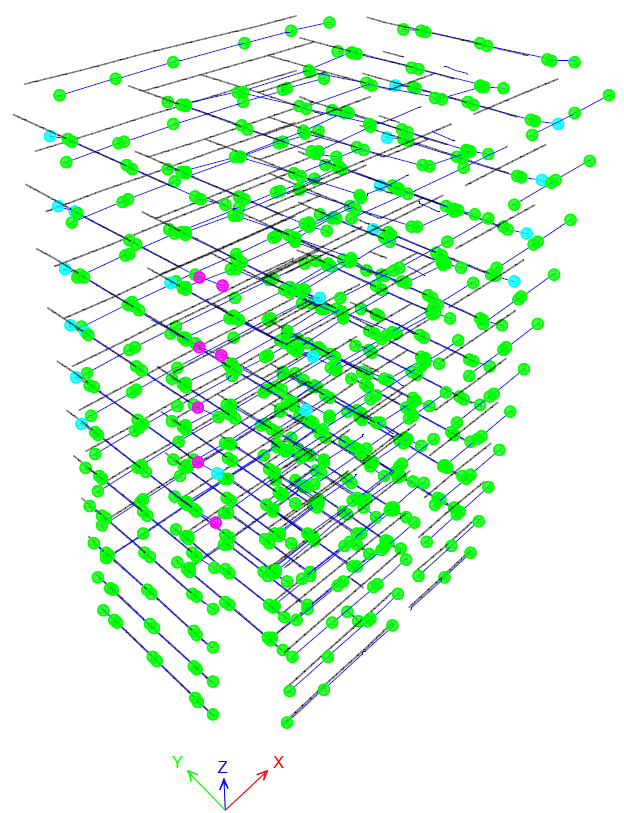 Figure 10 PY1 at step 78
This value is great enough for important damages to occur to the structure, so the plastic mechanism is already formed at this stage. Directions X and Y are shown in each graphic by the red and green arrows. The color code is the following: B (green) means the plastic hinge is formed, C (blue) means the plastic hinge reaches the limit and the element gives out, D (pink) means the load was redistributed and E (red) means collapse. These colors are seen in Figures 9 and 10. For pushover cases PX and PY, plastic hinges reach stage E mainly in beams on the same direction as the case. There are more red hinges for PY, because they mainly develop in the short beams. There are no short beams on X. For cases PX1 and PY1 the hinges in stage D are located more to the edge short beams on direction Y, at the analysis end. Shorter beams are loaded more by the seismic action. For cases PX1 and PY1 only a few hinges reach stage D. Stage C is seen in more hinges for case PY1. They are all in short beams at the structure sides on direction Y.
The hinges developed to the highest stages are distributed more evenly for direction Y cases. This may be because the building is more flexible. Hinges do not reach stage E for PX1 and PY1. The building does turn into a plastic mechanism for case PX1, before displacement 50cm is reached. This means the building behaves more ductile for these cases. Elasticity modulus values in the plastic stage are ECpl in (31) for concrete, ESpl in (32) for reinforcement bars [16] and EMpl in (33) for masonry [12]. fcm is the concrete medium pressure strength, εc1 is the strain reached for the maximum stress in the plastic stage, k=ft/fy=tension strength/elasticity limit strength and εuk is the maximum strain reached in the plastic stage [16]. εm1 is the strain reached for the maximum stress value in the plastic stage [12].
ECpl = 0.8·fcm/(0.5·εc1) (31)
ESpl = k ·fyk/εuk (32)
EMpl = fk ·1000/εm1 (33)
5.2. Pushover Diagrams
Figure 11 shows the pushover curves for all 4 cases. The pushover diagrams PX and PY show a rigid behavior compared to the slower decrease of stiffness for PX1 and PY1.
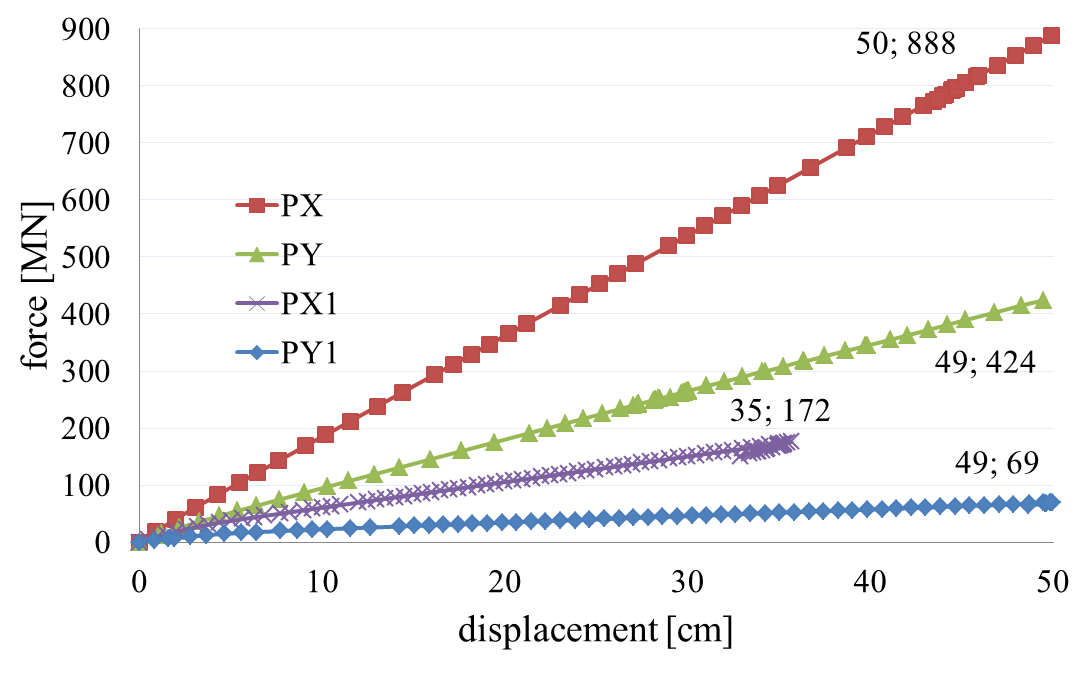 Figure 11 Pushover diagrams
The structure maintains the same stiffness for PX until the required displacement is reached. PY and PX1 show a stiffness decrease at the analysis beginning. For PX1 the structure gives in at an earlier stage. Diagram PY1 displays a low rigidity from the beginning that drops to 0 towards the end. The structure is clearly stiffer on direction X. This is expected, as there are 4 long concrete walls on direction X. It is also clear the masonry non-bearing walls have a great influence on the structure’s stiffness. Maximum base shear forces reached for PX1 and PY1 are 2 to 3 times smaller than for cases PX and PY, for the same displacement value.
5.3. Masonry Walls Stresses
The maximum value for each stress is written after the analysis step number. Stresses σx values surpass the strength fhd at step 8 for PX and step 12 for PY. The highest values are reached at the walls bottoms perpendicular to each pushover case direction. The stress values generally decrease to the walls tops. There is an increase in stress for walls developed on both directions. This may be explained as they are stiffer. Stresses σz clearly surpass the strengths fd at steps 8 for PX and 9 for PY. The walls perpendicular to the stress direction are the most affected.
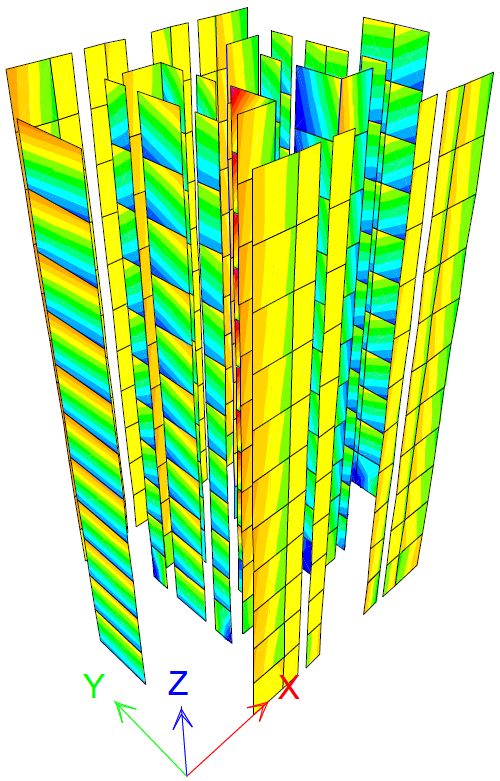 Figure 12 PX step 8 σx=1 N/mm2
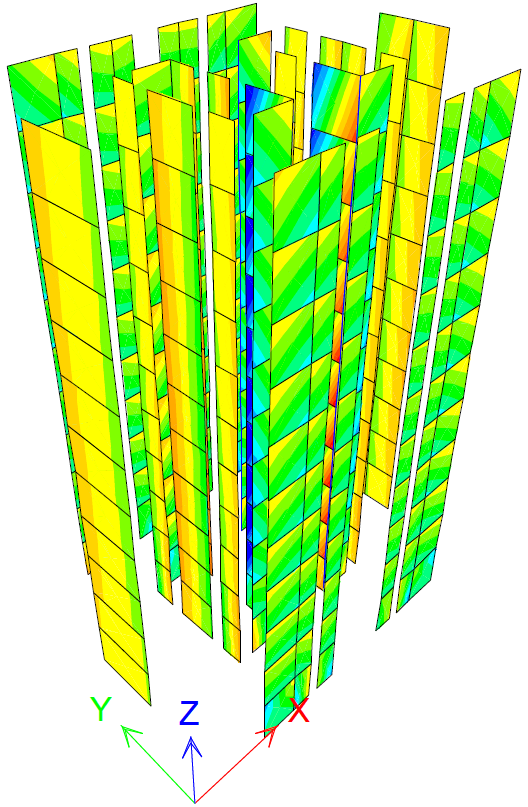 Figure 13 PY step 12 σx=1 N/mm2
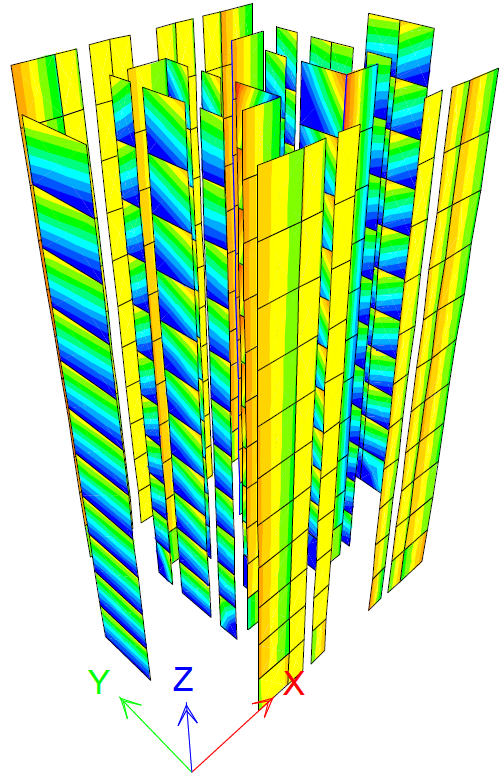 Figure 14 PX step 8 σz=2.5 N/mm2
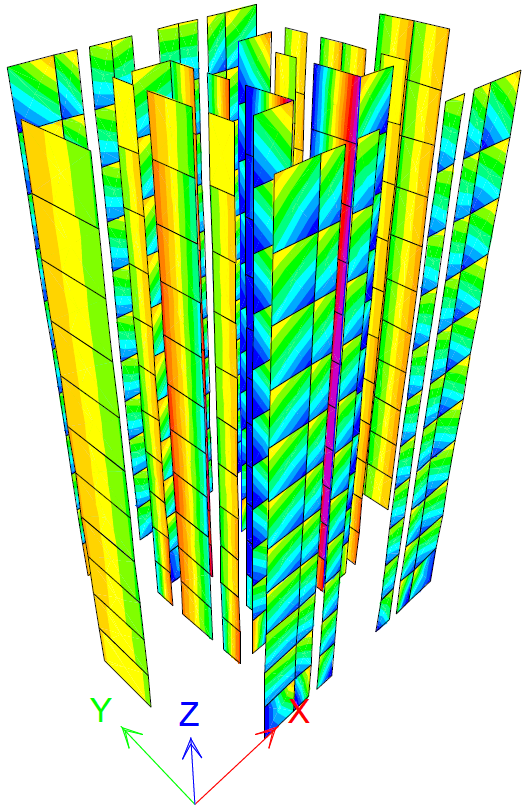 Figure 15 PY step 9 σz=2.5 N/mm2
The stress pattern shows high values at the bottoms, as for consoles. This is expected because non-bearing walls are not stiffly connected to the structure at the top, otherwise they would be loaded as bearing walls are. The walls developed on both directions show higher stress values on the same direction as the pushover case. There is a pattern of compression and tension in the walls parallel to the stress, but the values do not increase at the bottom stories, because those are non-bearing walls. For both pushover cases, stresses τxz are greater than fvd,l from step 1 of the analysis. τxz is greater in walls on the pushover case direction and at the bottoms of walls perpendicular to the stress. The stress reaches the highest values in the stiffest walls, developed on both directions. Stress increases at the top stories, as if the walls are crushed at one side and stretched at the other. This may be caused by the structure’s slenderness.
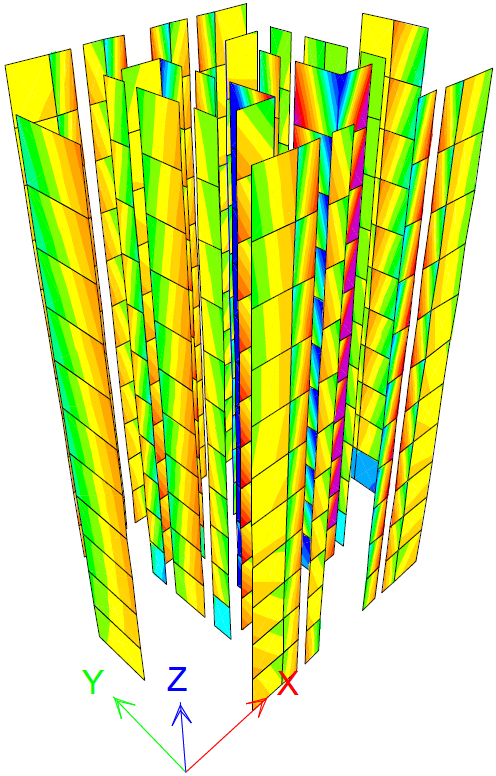 Figure 16 PX step 1 τxz=0.2 N/mm2
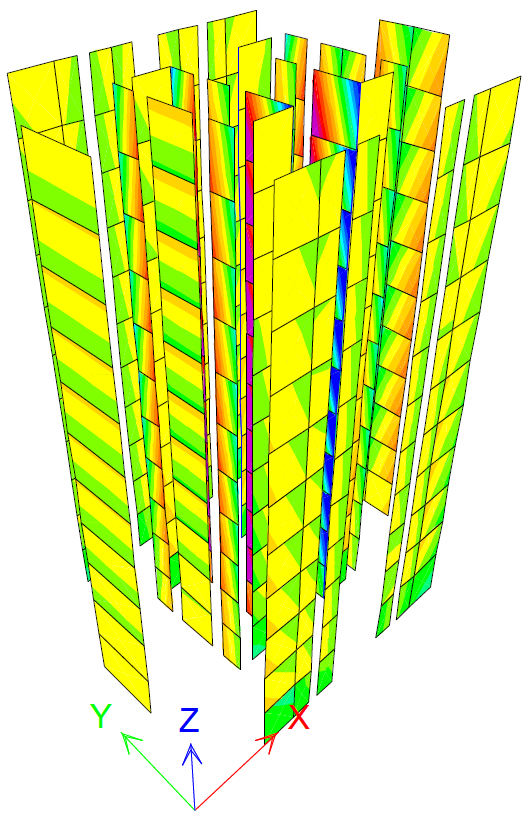 Figure 17 PY step 1 τxz=0.2 N/mm2
5.4. Bending Moments Perpendicular to the Walls
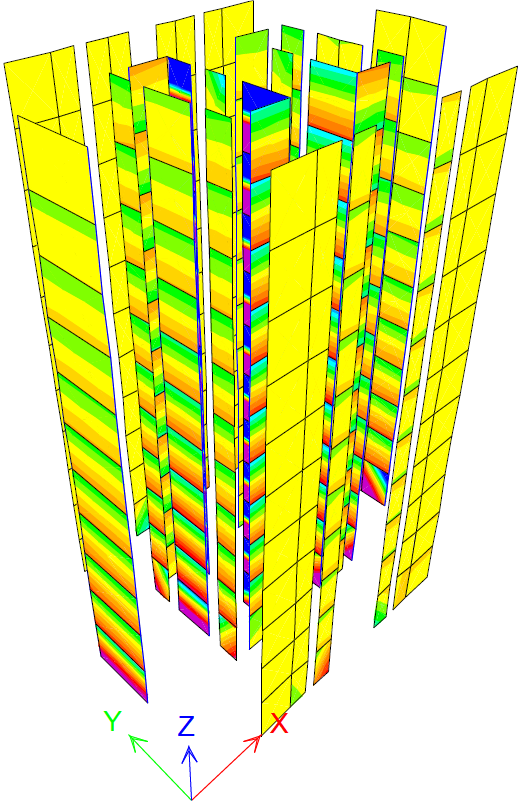 Figure 18 PX step 6 MExd1=1.6kNm/m
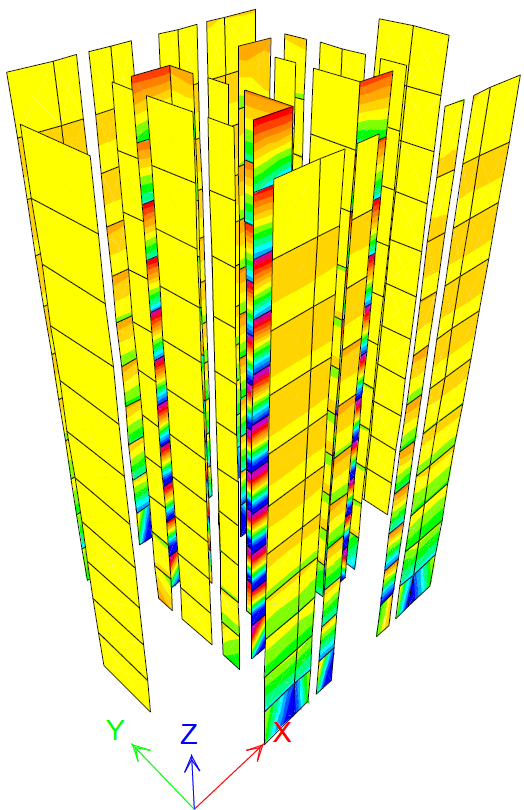 Figure 19 PY step 10 MExd1=1.6kNm/m
Nonlinear analysis shows the bearing bending moments perpendicular to the wall MRxd1 (horizontal) and MRxd2 (vertical) are surpassed by the design bending moments MEdx1 and MEdx2 in the nonlinear stage, at step 6 for PX and 10 for PY. It was expected that the bearing moment values would not be exceeded in the elastic stage.
5.5. Seismic Forces Perpendicular to the Walls
The seismic force perpendicular to the walls determined by the design code is reached at step 7 of the nonlinear analysis. The highest values are in walls perpendicular to the pushover direction. This is expected, as it is the seismic force perpendicular to the walls. These values are reached at the lower stories. This can be explained as the structure’s lower part is stiffer and the non-bearing walls can also be loaded more, because they do interact with the structure. For PX, there are 2 walls developed on both X and Y directions, that take most of the perpendicular force. This force reaches the same maximum value from the bottom to the top walls. This is seen on direction Y. The building is less stiff on Y. This may cause non-bearing walls to be loaded more.
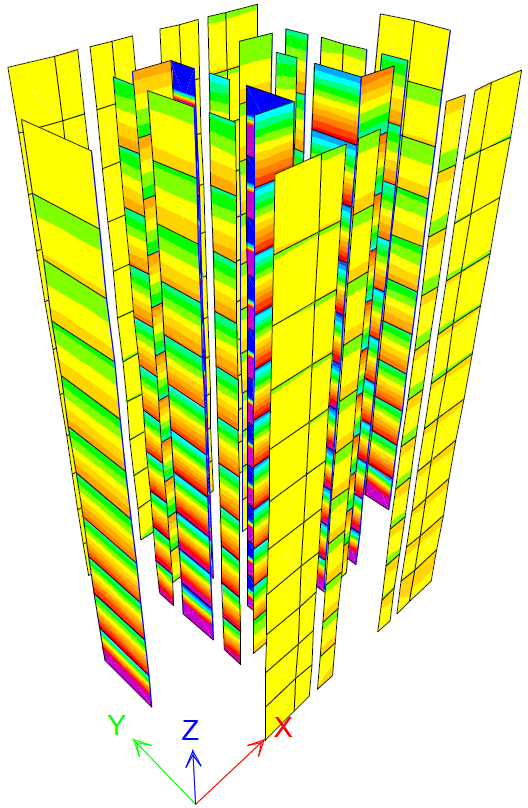 Figure 20 PX step 4 MExd2=2.6kNm/m
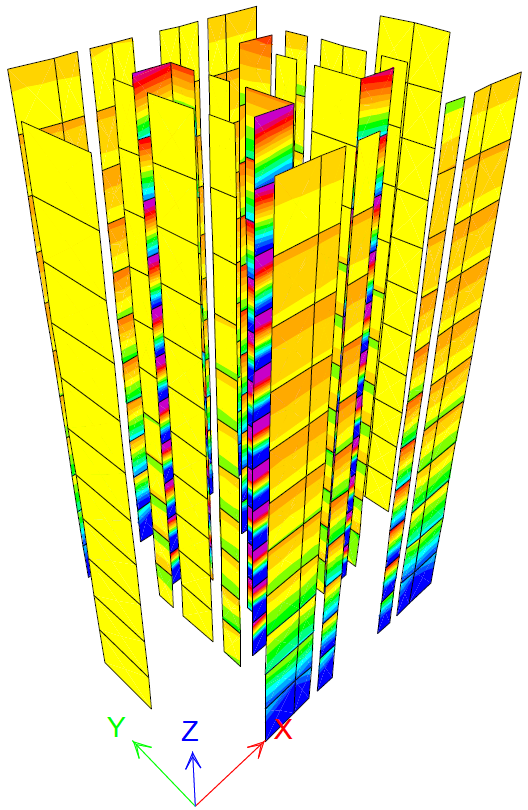 Figure 21 PY step 8 MExd2=2.6kNm/m
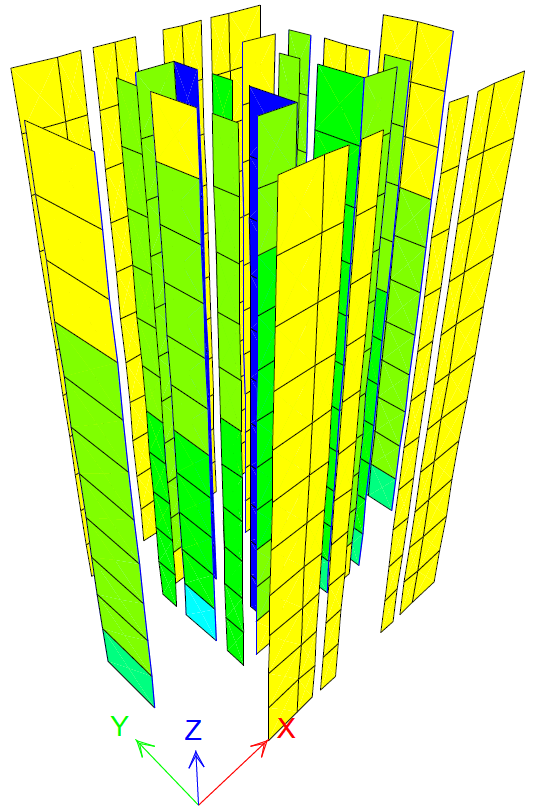 Figure 22 PX step 7 FNBW=1.9kN/m2 experimental seismic force
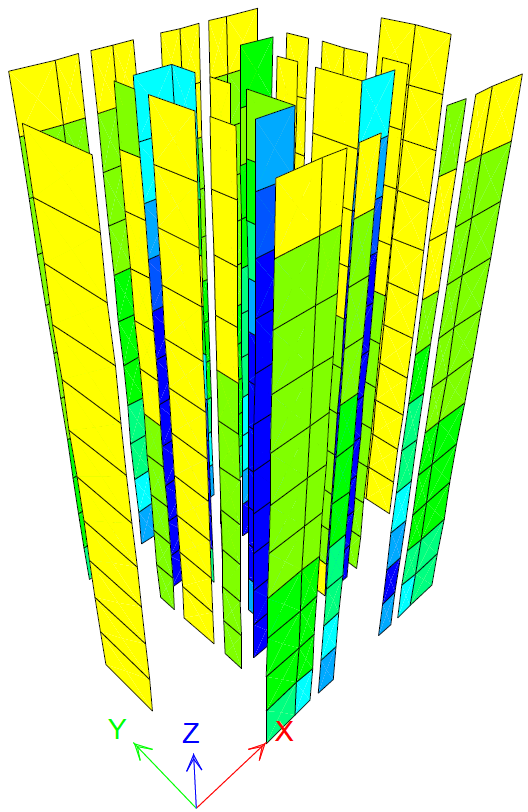 Figure 23 PY step 7 FNBW=1.9kN/m2 experimental seismic force
5.6. Mesh Discretization Importance
Mesh elements dimensions have an impact on the analysis results. To study this impact, a 2D elevation in the building in study was used. It is seen in Figure 24. Figure 25 shows the pushover diagrams for different mesh discretization. The base force reached subsides as the mesh is smaller. The base force drops to 0.89 times the value as the mesh dimensions decrease 8 times.
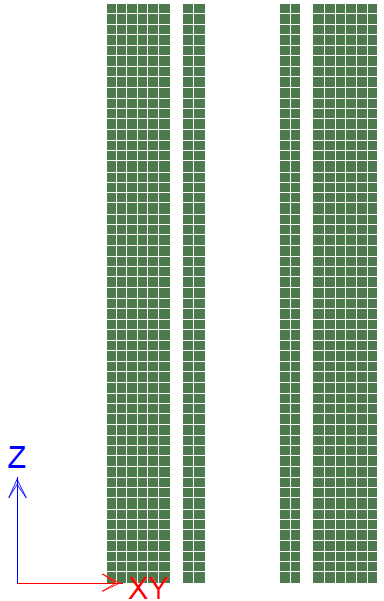 Figure 24 2D elevation
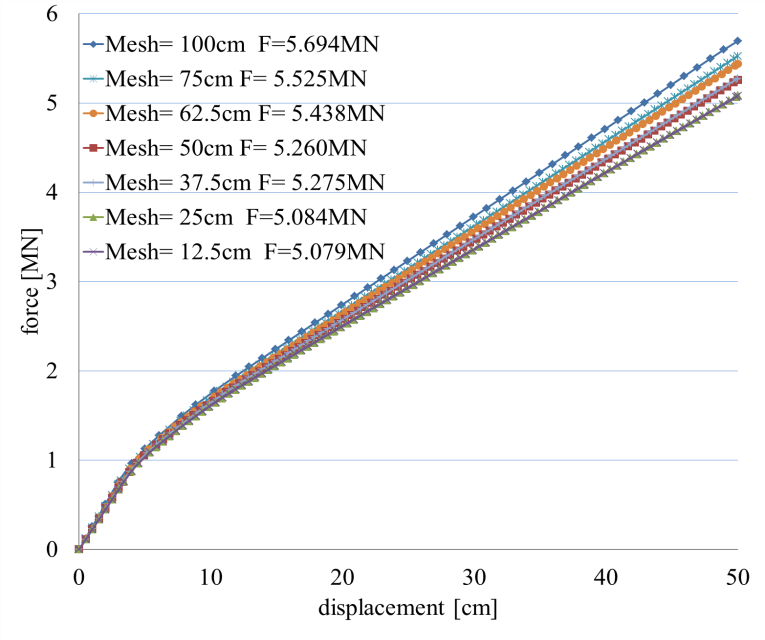 Figure 25 Pushover diagrams for different mesh discretization
6. Conclusions
Non-bearing masonry walls are able to bear the perpendicular and parallel forces and also the bending moments they are subjected to in the elastic stage. They reduce the building’s natural vibration periods values. The pushover curves show a stiff behavior when the masonry walls are present. The maximum base shear force increases 2 times if non-bearing walls are present. When designing a high building with partitioning masonry walls, it is important to take the non-bearing masonry walls into account as elements, not only as loads.
Conflict of Interest
The author declares no conflict of interest.
- A. Madan, A. K. Hashimi, “Performance Based Design of Masonry Infilled Reinforced Concrete Frames for Near-Field Earthquakes Using Energy Methods” WASET, International Journal of Civil, Environmental, Structural, Construction and Architectural Engineering Vol:8, No:6, p 689-695, 2014.https://pdfs. semanticscholar.org/bbdd/eb245adce7d0b1604f474ad249e5a57c1397.pdf
- M. Vokal, M. Drahorad “Non-linear analysis of slender masonry beam” Transactions of the VSB- Technical University of Ostrava Civil Engineering Series, Vol. 17, No. 2 p 151-160, 2017. http://dx.doi.org/10. 1515/ tvsb-2017-0039
- C. Cornado, J.R. Rosell, J. Leiva, C. Diaz, “Experimental study of brick masonry walls subjected to excentric and axial load” International RILEM Conference on Materials, Systems and Structures in Civil Engineering Conference segment on Historical Masonry Technical University of Denmark, Lyngby, Denmark p 33-40, 2016. www.rilem.net/publications/ proceedings-500218
- M. Teguh, “Experimental evaluation of masonry infill walls of RC frame buildings subjected to cyclic loads” Elsevier Procedia Engineering 171 Sustainable Civil Engineering Structures and Construction Materials 2016 p 191-200, 2017. doi:10.1016/j.proeng.2017.01.326
- P. Lourenco, “Design of large size non-loadbearing masonry walls: case study in Portugal. Technical and economic benefits” in 13th International Brick and Block Conference Amsterdam, 2004. www.hms.civil.uminho.pt/ ibmac/2004/
- M. Dhanasekar, “Shear in reinforced and unreinforced masonry: response, design and construction” in The Twelfth East Asia Pacific Conference on Structural Engineering and Construction, Elsevier Procedia Engineering Vol 14. p 2069- 2076, 2011. doi:10.1016/j.proceng.2011.07. 260
- M. Kaluza, “Analysis of in plane deformation of walls made using AAC blocks strenghten by GFRP mesh” International Conference on Analytical Models and New Concepts and Masonry Structures AMCM Elsevier Procedia Engineering Vol 14. p 393-400, 2017. doi:10/1016/j.proceng. 2017.06.229
- X. Lu, X. Lin, Y. Ma, Y. Li, L. Ye, “Numerical Simulation for the Progressive Collapse of Concrete Building due to Earthquake” in Proc. The 14th World Conference on Earthquake Engineering 2008, October 12-17 Beijing, China http://www.iitk.ac.in/nicee/wcee/article/14_14-0044.PDF
- Z. Huang, T. Liao, B. Huang, B. Huang, Z. Li, B. Zhang, J. Pan, W. Qi, X. Li, J. Wang, “Investigation on unified model of constitutive relations for masonry” in 3dr International Conference on Energy Materials and Environment Engineering IOP Conf. Series: Earth and Environmental Science 61, 2017. doi:10.1088/1755-1315/61/1/012125
- P. Naik, S. Annigeri, “Performance evaluation of 9 story RC building located in North Goa” in 11th International Symposium on plasticity and Impact Mechanics, Implast 2016 Elsevier Procedia Engineering 173, p 1841 -1846, 2017. doi:10.1016/j.proceng.2016.12.231
- B. R. Patel, “Progressive Collapse Analysis of RC Buildings Using Non Linear Static and Non-Linear Dynamic Method” in IJETAE 2014; ISSN 2250-2459, ISO 9001:2008 Certified Journal. https://pdfs. semanticscholar. org/3716/2c9411ca6362c448779d5af0f09f38f67de9.pdf
- CEN EN 1996-1-1-2006 Eurocode 6: Design of masonry structures – Part 1-1: General rules for reinforced and unreinforced masonry structures, 2006.
- CEN EN 1991-1-1-2004 Eurocode 1: Actions on structures – Part 1-1: General actions- Densities, self-weight, imposed loads for buildings, 2004.
- CEN EN 1990-2004 Eurocode 0: Basics of structural design, 2004
- CEN EN 1991-1-3-2005 Eurocode 1: Actions on structures – Part 1-3: General actions- Snow loads, 2005
- CEN EN 1992-1-1-2004 Eurocode 2: Design of concrete structures – Part 1-1: General rules and rules for buildings, 2004.
- CEN EN 1998-1-2004 Eurocode 8: Design of structures for earthquake resistance. Part 1: General rules, seismic actions and rules for buildings, 2004.
- P100-1/2013 Seismic design code – Part 1- General rules for buildings, 2013