Difference in Speech Analysis Results by Coding
Adv. Sci. Technol. Eng. Syst. J. 3(5), 488–491 (2018);
 DOI: 10.25046/aj030555
Mental health disorder is becoming a social problem, and there is a need for technology that can easily check for states of stress and depression as a countermeasure. Conventional methods of diagnostic support and screening include self-administered psychological tests and use of biomarkers. However, there are problems such as burden on subjects, examination costs, dedicated reagents and equipment required for examinations, and reporting bias. On the other hand, voice-based evaluations are advantageous in terms of providing diagnostic support for physicians. They are non-invasive, do not require special and exclusive equipment, and can therefore be easily conducted remotely. We are pursuing the research and development of the Mind Monitoring System (MIMOSYS), which estimates the state of mental health from voice. Recorded audio is often compressed for efficient storage and transmission. However, there are concerns regarding the effects of deterioration of sound quality on analysis by MIMOSYS. Therefore, this study aims to verify the influence of the deterioration of voice quality due to coding on MIMOSYS analysis. As a verification experiment, coding was applied on the recording of 704 subjects reading 17 fixed phrases, assuming compression for transmission and storage. Then, the results of MIMOSYS analysis before and after encoding were compared. A strong correlation was observed before and after encoding, suggesting that MIMOSYS analysis is also valid for voice to which coding was applied.
1. Introduction
This paper is an extended paper from IEEE ICIIBMS 2017 (The International Conference on Intelligent Informatics and Biomedical Sciences) [1].
Mental health disorder is becoming a social problem, and there is a need for technology that can easily check for states of stress and depression as a countermeasure.
Conventional methods of diagnostic support and screening include self-administered psychological tests and use of biomarkers. However, there are problems such as burden on subjects, examination costs, dedicated reagents and equipment required for examinations, and reporting bias.
On the other hand, voice-based evaluations are advantageous in terms of providing diagnostic support for physicians. They are non-invasive, do not require special and exclusive equipment, and can therefore be easily conducted remotely.
We are pursuing the research and development of the Mind Monitoring System (MIMOSYS), which estimates the state of mental health from voice [2]. Recorded audio is often compressed for efficient storage and transmission. However, there are concerns regarding the effects of deterioration of sound quality on analysis by MIMOSYS. Therefore, this study aims to verify the influence of the deterioration of voice quality due to coding on MIMOSYS analysis.
2. Materials and Methods
2.1. Vocal Analysis by MIMOSYS
Generally, a healthy person expresses emotions such as joy, anger, sadness, or pleasure depending on changes in their surroundings. On the other hand, when stress accumulates and the person becomes depressed, the expression of emotions declines. MIMOSYS is based on the sensibility technology ST (AGI Inc.) [3] which measures emotion from voice. Short-term mental health index (“vitality”) and long-term mental health index (“mental activity”) are analyzed from the balance of five combined emotional indices, which are the four emotions “calmness”, “anger”, “joy”, and “sorrow” obtained by voice analysis, and “excitement” represented by the strength of brain emotional activity. ST software detects voice activity based on volume as shown in Figure 1. For each utterance, feature values such as pitch, power, and deviation in power are calculated by a robust fundamental frequency and intonation detection method. Based on these feature values, they are classified into emotional elements of “calmness”, “anger”, “joy”, and “sorrow” through decision tree logic. The degree of “excitement” is also analyzed as the strength of brain emotional activity. Each emotion detected from the input voice is an integer value from 0 to 10, and the strength of “excitement” is output as an integer value from 1 to 10.
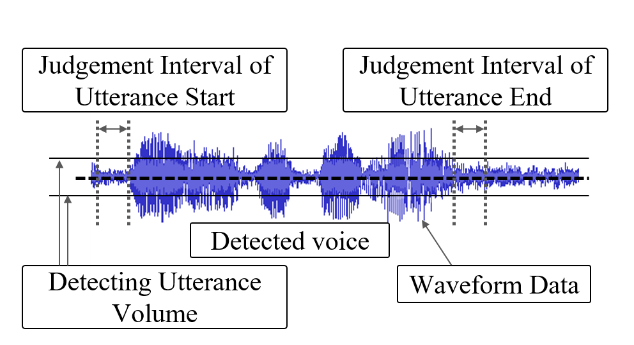 Figure 1. Voice activity detection
MIMOSYS calculates “vivacity” and “relaxation” as intermediate feature values, in the course of its analysis. Vivacity is calculated from “joy” and “sorrow”, and relaxation is calculated from “calmness” and “excitement”. The short-term mental health index “vitality” is then calculated from these, and the mid-long term mental health index “mental activity” is calculated from the “vitality” accumulated over two weeks. The flow of MIMOSYS processing is shown in Figure 2.
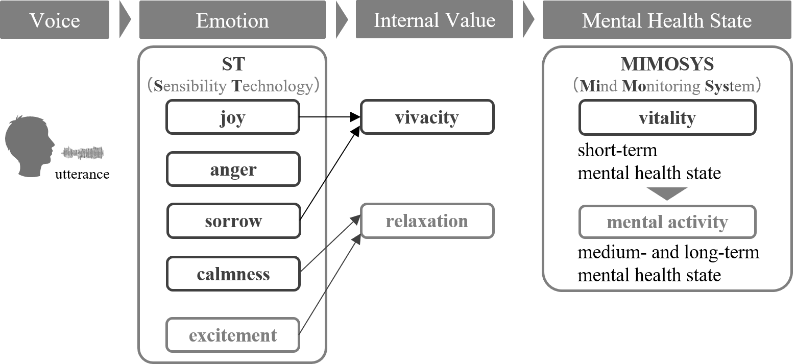 Figure 2. The flow of MIMOSYS processing
2.2. Beck Depression Inventory
The Beck Depression Inventory (BDI) test is widely used for depression screening and consists of 21 questions on how the subject has been feeling in recent days, including on the day. Each question has four options, and the total score determines the severity of depression. Table 1 shows cutoff values according to reference [4]. In this study, since only healthy subjects were targeted, only the voices of subjects with a score of 9 or less were used.
Table 1. cutoff scores for BDI.
| Total BDI score | Level of depression |
| 0 – 9 | indicates minimal depression |
| 10 – 18 | indicates mild depression |
| 19 – 29 | indicates moderate depression |
| 30 – 63 | indicates severe depression |
2.3. Voice Collection
We prepared voice (96 kHz, 24 bit, wav file) collection which collected using the Portable Recorder R-26 (Roland, Japan) and a pin microphone ME52W (OLYMPUS, Japan) from male and female subjects (n=986) in the assembled soundproof shelter S-909 (Starlight, Japan). The voices were collected when subjects reading 17 fixed phrases. Additionally, BDI test was conducted before the experiment. Then we excluded abnormal participants using BDI score. There were 704 subjects with screened data used in the analysis. Then we down-converted to 11,025 Hz, 16 bits, which is the input format of MIMOSYS and is used as original voice in this research. Hereafter, audio processing was done using “SoundExchange” [5] and “FFmpeg” [6] software with default coding settings.
This study was approved by the Research Ethics Review Committee. Informed consent was obtained from the subjects.
2.4. Experiment
We prepared data collection of recording format corresponded to linear PCM with a sampling frequency of 11,025 Hz, and a quantized bit number of 16 bits as “Base voice(11k)”.
Next, “Base voice(11k)” was converted to a sampling frequency of 8,000 Hz and a quantized bit number of 16 bits simulating transmission across a telephone line. Then, coding methods “G.723.1(MP-MLQ)”, “G.723.1(ACELP)”, and “G.729”, which are based on ITU-T recommendations [7,8], were applied to “Base voice(8k)”. Additionally, coding methods “AAC”, “MP3”, and “WMA”, were applied to “Base voice”, simulating recording and/or archiving. “Base voice” and each coded voice were decoded and assigned an analyzed “vitality” score through MIMOSYS.
Finally, the “vitality” score before and after coding using each coding method was compared by correlation evaluation. We also compared the analyzed “vitality” score of “Base(11k)” and “Base(8k)” in order to confirm the influence of resampling (down-sampling and up-sampling). We analyzed the data using Microsoft Excel 365 (Microsoft Corp.).
3. Results and Discussion
Figure 3-5 is a scatter diagram of “vitality” before and after encoding when “G.723.1(MP-MLQ)”, “G.723.1(ACELP)”, and “G.729” is used as the voice coding method, assuming transmission over a telephone line. Figure 6-8 is a scatter diagram of “vitality” before and after encoding when “AAC”, “MP3”, and “WMA” is used, assuming recording and archiving. Figure 9 is a scatter diagram of “vitality” before and after resampling. In addition, Table 2 shows correlation coefficients of “vitality” before and after encoding.
Table 2. correlation coefficients of “vitality” before and after encoding.
| Compared | Coding method | Coefficient of correlation |
| Base(8k) | “G.723.1(MP-MLQ)” | 0.882 |
| Base(8k) | “G.723.1(ACELP)” | 0.740 |
| Base(8k) | “G.729” | 0.802 |
| Base(11k) | “AAC” | 0.959 |
| Base(11k) | “MP3” | 0.972 |
| Base(11k) | “WMA” | 0.962 |
| Base(11k) | Base(8k) | 0.780 |
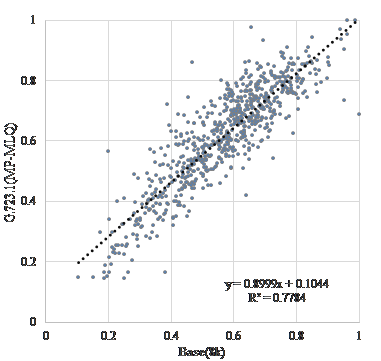 Figure 3. Scatter diagram of “vitality” encoding with “G.723.1(MP-MLQ)”.
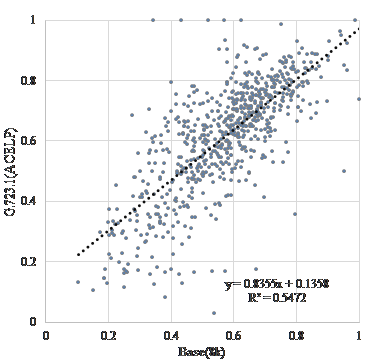 Figure 4. Scatter diagram of “vitality” encoding with “G.723.1(ACELP)”.
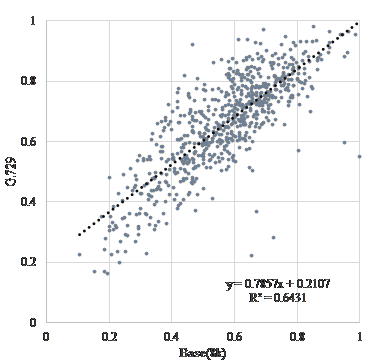 Figure 5. Scatter diagram of “vitality” encoding with “G.729”.
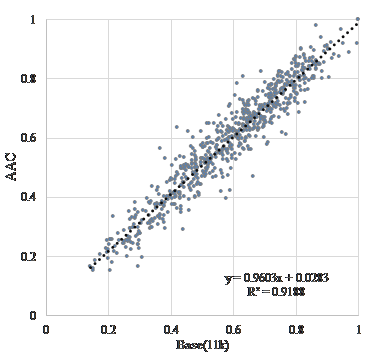 Figure 6. Scatter diagram of “vitality” encoding with “AAC”.
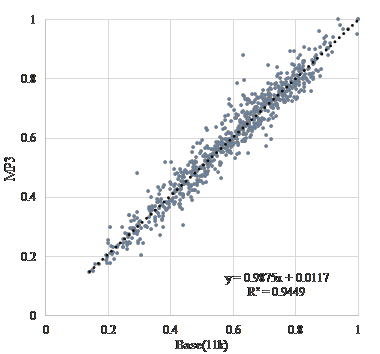 Figure 7. Scatter diagram of “vitality” encoding with “MP3”.
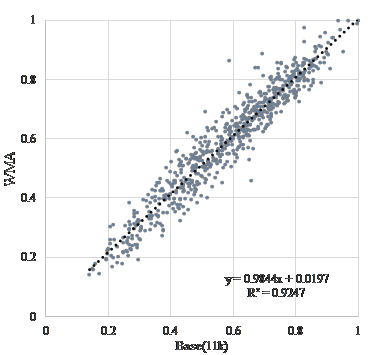 Figure 8. Scatter diagram of “vitality” encoding with “WMA”.
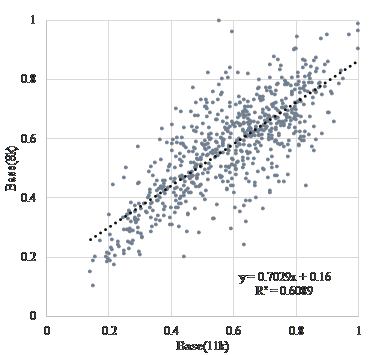 Figure 9. Scatter diagram of “vitality” before and after resampling.
Table 3. Average value of difference in “vitality” before and after coding.
| Coding method | Ave. S.D. | Base(11k) | Base(8k) |
| “G.723.1(MP-MLQ)” | 0.619 0.166 | 0.033 | 0.047 |
| “G.723.1(ACELP)” | 0.613 0.184 | 0.028 | 0.042 |
| “G.729” | 0.660 0.160 | 0.074 | 0.088 |
| “AAC” | 0.590 0.181 | 0.005 | 0.019 |
| “MP3” | 0.589 0.184 | 0.004 | 0.018 |
| “WMA” | 0.596 0.185 | 0.011 | 0.024 |
| Base(8k) | 0.571 0.163 | 0.014 | – |
The coefficients of correlation before and after coding is extremely high at about 0.74. Coding methods of recording and/or archiving such as “AAC”, “MP3”, and “WMA” are extremely high at about 0.95. Further, as shown in Table 3, the results suggested that the influence of sampling frequency conversion on “vitality” tends to be higher after coding. This result show that the influence on MIMOSYS analysis of sound degradation, either due to coding for transmission across a telephone line or coding for recording or archiving, is minor and is therefore a useful method. In Figure 4, there are multiple anomaly points where “vitality” after coding by “G.723.1(ACELP)” is observed around 1 and less than 0.2. This is a peculiar feature of this coding method and use of other coding methods might be preferred. On the other hand, the coefficients of correlation before and after a sampling frequency conversion without coding causes deterioration. This deterioration is inevitable because the input format of MIMOSYS is 11,025 Hz while the input format of the general telephone line is 8,000 Hz.
Prior to this research, we conducted an examination of simulating transmission across a telephone line using coding methods of “u-law”, “A-law”, “G.726”, and “G.723.1” [9]. In this study and previous research, results show other coding methods such as compression methods are useful after coding.
4. Conclusion
In this study, in order to verify the influence of deterioration of voice quality on the estimation of health condition using voice by MIMOSYS, the results of MIMOSYS analysis before and after applying coding to voice were compared and verified. The correlation coefficients of mental activity before and after the application of voice coding were high, and it was suggested that even voice compression coded for transmission via a telephone line or storage could be used. Furthermore, it was also suggested that the influence of sampling frequency conversion on vitality tends to be larger than applying coding.
In the future, we would like to further improve accuracy by considering sampling frequency conversion methods and value correction methods with less influence on MIMOSYS. We also want to improve the accuracy of the MIMOSYS algorithm itself.
Conflict of Interest
The authors have no conflicts of interest to declare.
- Yasuhiro Omiya, Naoki Hagiwara, Takeshi Takano, Shuji Shinohara, Mitsuteru Nakamura, Masakazu Higuchi, Shunji Mitsuyoshi, and Shinichi Tokuno, “Difference in Speech Analysis Results by Compression,” in International Conference on Intelligent Informatics and BioMedical Sciences (ICIIBMS) 2017, Okinawa, Japan, 2017.
- Shinichi Tokuno, “Pathophysiological Voice Analysis for Diagnosis and Monitoring of Depression,” Understanding Depression, Springer, Singapore, 83-95, 2018.
- Shunji Mitsuyoshi, Fuji Ren, Yasuto Tanaka, and Shingo Kuroiwa, “Non-verbal voice emotion analysis system,” Int. J. Innov. Comput. I., 2(4), 819–830, 2006.
- Beck, AT, Steer RA, Garbin MG J.: Psychometric properties of the Beck Depression Inventory Twenty-five years of evaluation. Clinical Psychology Review 8(1), 77–100, 1988.
- Chris Bagwell, SoX – Sound eXchange, Available at: <http://www.soundexchange.com/> (Accessed 12 Jul. 2018)
- FFmpeg Developers, “ffmpeg tool (Version 20170503-a75ef15) [software],” Available from: <https://www.ffmpeg.org/> (Accessed 28 Sep. 2018)
- ITU-T Recommendation G.723.1 (05/2006), Available at: < https://www.itu.int/rec/T-REC-G.723.1-200605-I/en> (Accessed 28 Sep. 2018)
- ITU-T Recommendation “G.729” (06/2012), Available at: <https://www.itu.int/rec/T-REC-”G.729”-201206-I/en> (Accessed 28 Sep. 2018)
- Naoki Hagiwara, Yasuhiro Omiya, Shuji Shinohara, Mitsuteru Nakamura, Masakazu Higuchi, Shunji Mitsuyoshi, and Shinichi Tokuno, “Difference in Voice Analysis Result by Pre- and Post- Processing of Telephone Line,” IEEE EMBC 2017, Jeju, Korea, 2017.
No related articles were found.