Numerical Simulation of One Pavement Structure of Polyethylene Terephthalate Submitted to Static Point Loads
 , María Camila Zambrano Bello, Ender Jhobany Orduz Duarte
Adv. Sci. Technol. Eng. Syst. J. 3(5), 478–487 (2018);
 DOI: 10.25046/aj030554
Plastic is highly polluting nowadays and is found in many disposable elements used for people. Plastic materials are disposed inadequately and large quantities of them become pollution in the ground, water, and air, affecting plants and animals. Most of the plastic is Polyethylene Terephthalate (PET) which is used in many activities. Resistance, support capacity, and flexibility are some characteristics that make PET useful in road engineering. This research shows a numerical simulation of three kinds of structures for pavements in PET. The simulation uses 3D models that were analyzed in the software SAP2000. The material characteristics of the recycling PET were taken from industries and analyzed in the laboratory. The model used in the simulation was composed of vertical loads for traffic type A. Loads were applied in the border, 0.75 meters and 1.5 meters from the border. Three types of structures were analyzed with three, four and five supports respectively. Structure type 2 with four supports displayed the best results regarding vertical displacements in all the elements. Structure type 2 was simulated with six different thicknesses (0.06, 0.08, 0.10, 0.12, 0.14 and 0.16 meters). Optimization of this material and the resistance of the structure showed the 0.10 meters thickness as the best due to its admissible vertical displacements and required the lowest quantity of material for producing it.
1. Introduction
Transporting people and resources are two of the most important elements of economic development in society. Comfort, security, and speed are three parameters required for users of the roads. The concrete asphalt is one of the most popular materials used in pavements in order to have high quality and adequate traffic service nowadays [1]. Environmental damage caused by asphalt production and building roads in concrete asphalt is an important topic studied lately. Production, transport, and storage are activities that produce significant pollution. The Environmental Protection Agency of the United States has pleaded worldwide activities to underwrite production controls, environmental impact reduction, and more policies of environmental care around the world. Researches account more than 500000 kilograms of emissions to the atmosphere in pollution with volatile compositions, organic materials and so on [2]. Environmental damage is an important topic at the present time and society should find new strategies for controlling all different kinds of pollution in it. The traffic and the transport of resources and materials are activities that induce high quantities of pollution, especially into the air. Using synthetic materials and other kinds of additions for making the road`s concrete is one of many development possibilities to build road infrastructure around the world [3,4]. The addition of polymeric materials to concrete are implemented in order to reduce the volume of waste in landfills and to recycle different kinds of polymeric elements. Sustainable activities have served as a way of making new construction materials and resources for customers [5,6]. Reusing materials, used currently, could be another strategy to reduce humans’ impact on the Earth [7].
Polymers are versatile materials and many products are made with it. However, polymers are also highly polluting materials because a large number of disposable elements are used daily and not all of them are recycled or reused in new activities. As a result, those elements are transported to the landfill and increase the contamination problems in land, water, and air; it can attack different species of animals in nature. Synthetic polymers are potentially polluting because their degradation time is so long and the oil is an irreplaceable resource. Also, the chemical composition and the high quantity of waste during the production is a considerable issue [8].
This research shows a strategy proposed for making pavement structures in recycled plastic. The Polyethylene Terephthalate is a material easy to find in the modern world. Some alternatives made in the past have identified materials used for different activities and their characteristics can offer functionality and quality service in roads infrastructure as a pavement structure. The process shows three kinds of structures evaluated in the software SAP2000 with the finite element methodology. The simulated material is recycled plastic, a unique resource for the structure. The software seeks to evaluate the model of the structures with the application of static and point loads.
3. Synthetic polymers materials and their recycling
Gaelle Gourmelon research, “Global Plastic Production Rises, Recycling Lags,” discusses the behavior of the polymeric industry around the world during the period 1950-2012. This industry produces more than six hundred thousand dollars each year. Transport, construction, health, education, and food industry are some of the sectors of the economy where plastic is highly used. For example, for making one automobile the industry uses 152.41 kilograms of plastic, while in 1960 it only used 9.07 kilograms. Of course, technology advances look for high quality and less cost: the automotive industry uses polymers in important parts of the cars. During 2013, the US automotive industry nearly used 300000 million kilograms of plastic materials in automobile parts [9].
During 2012, Europe recycled 26% of its polymeric materials. Additionally, during the same year, 36% of this material was incinerated. Around 38% of the polymeric materials were taken to landfills. Austria, Belgium, Sweden, and Switzerland governments regulate recycling, and citizens are required by law to recycle plastics and other materials. These countries have the highest rates for recycling plastic materials and most of those materials are transformed or incinerated [9].
Microplastics, little pieces of plastic in millimetric size, are highly polluting. These microplastics have become a major problem because they are scattered easily and are potentially dangerous for animals and the forest [10]. Around 275000 million kilograms of plastic waste were generated in 2010 in 192 countries with coasts. It is estimated that 12700 million kilograms of that garbage polluted the ocean [11]. Some estimations calculate around 268900 kilograms of garbage floats on the ocean’s surface, without considering the material below the surface [12].
In Colombia, the DNP (by its acronym in Spanish Departamento Nacional de Planeación) estimates that 11600 million kilograms of garbage is produced annually and just 17% is recycled. Some policies are applied in order to reduce the impact of this waste on the environment. The DNP generates the Integral Policy for Management of Solid Waste with the horizon in 2030. This policy calls for the implementation of one official plan for the integral management of solid waste as a public policy, with interest for all the population, in order to foster an economic and sustainable development, transformation of the society and mitigation on the environmental impact in the country, and of course, for all the planet. Research shows that 2800 people work in Colombia in the recycling business, from the collection of pieces to fiber production in recycling factories [13]. Not only are they factory workers, where the principal resources are the recycled plastic, but most of them are not formal employees. This topic is predominantly studied in socio-economic research because it is an important aspect of a country’s economic development. Furthermore, ground pollution is another environmental problem. Plastic materials degrade over a long period of time and cause ground pollution that affects the growth and development of animals and plants [14]. This prediction of a sanitary emergency in most of Colombia’s cities by 2030 highlights that the majority of the waste in Colombia is disposed in landfills, and eventually, those landfills will not have capacity for any more garbage. Considering the DNP`s information in 2016, Colombia needs better waste management, to change its consumption of resources and to transform its industries as soon as possible, in order to promote a productive and sustainable economy.
4. Reused polyethylene Terephthalate as an absolute material for pavement structures
Roads are important for economic development: industries, tourism, commerce, agriculture, and so on, are important sectors in developing countries. High quality roads permit faster traffic, fewer transportation costs and less pollution from emissions into the air. Today, one of the most important elements for defining economic development is the investment in quality road construction, faster traffic and safer roads: the base for increasing productivity [15]. Synthetic polymers are used frequently for making reusable materials in construction. Masonry is one of the most important activities where plastic is used. Recent research has attempted to use bricks made with plastic in building construction in order to reduce the impact of plastic on Earth. Polyethylene Terephthalate is the most prevalent polymer to modify construction materials. Using plastic bricks in buildings curbs challenges in traditional construction methods in developing countries and reduces the environmental impact of garbage in landfills [16]. Polymers are also frequently added to an asphalt mix. The addition of polymers to asphalt concrete changes its characteristics, especially the mechanic behavior, durability and thermal susceptibility [17]. Likewise, polymers are used as concrete aggregates. This kind of mixture changes their resistance and durability. However, this material should be used carefully in big buildings because of changes in their composition [18].
Polyethylene Terephthalate has valuable qualities, especially its durability and resistance to abrasion, it’s an adequate answer to chemical attack, resistance to weather conditions and can be used in construction. They show better conditions and higher potential use in the construction activities compared to with other materials [19]. Construction factories around the world use commonly plastics in many applications. New infrastructure projects use lighter materials made of polymers to construct
architectural finishes and residential public service networks. Nevertheless, recycling is not a frequent activity in developing countries, despite it’s easy management and material characteristics. This research shows a new possibility for recycled plastic to develop road projects in places of light traffic loads. Also, the research as a first approximation in one type of structure developed only in plastic. Using recycled plastic in high quantity helps society in two important ways: first, in development of new materials in pavements for new road projects; second, plastic pavements demand high bulk from plastic materials that reduce the quantity of waste in landfills.
5. Characteristics of the model
Different kinds of structures are used in road pavements. Asphalt concrete is the most used material in developing countries. Also, rigid concrete made with cement is used frequently. Another different pavement called articulated pavement uses masonry on the surface of roads with light traffic. All of these kinds of structures are constructed by layers. In the bottom of all projects, subgrade material is made up the natural soil. Sometimes, low resistance materials are changed or modified with some additions. Over the subgrade are used arid material, produced by rock’s trituration (natural or artificial), builded in layers according designs. The top layer normally is made of concrete or masonry. The research proposes to change classic pavement structures of asphalt concrete or hydraulic concrete to plastic elements over arid layers. The Figures 3, 4 and 5 show some possibilities of structures where the plastic is in the top and in the bottom, but inside the structure is empty and there are ducts that can be used as channels for water or electrical or hydraulic networks.
The model presented was developed in pieces with length and width of 3 meters, a total height of 0.5 meters, and a horizontal and vertical thickness of 0.14 meters. The proportions used were taken from base recommendations for rigid pavements that INVIAS (Instituto Nacional de Vías) proposes for these types of pavements [20].
The Colombian norm NTC 237 recommends tests in density and absorption in plastic materials as Polyethylene Terephthalate. This research tested recycled Polyethylene Terephthalate from plastic bottles. Its density was 1219 kilograms per cubic meter and the absorption 0.28%. Figure 1 shows the material tested in the laboratory at Universidad Católica de Colombia in 2017.
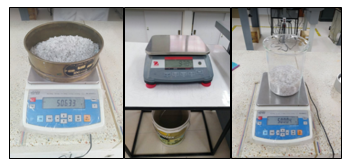 Figure 1. Polyethylene Terephthalate tested in the laboratory.
A preliminary model proposed recycled plastic for the entire structure as a first approximation through numerical simulation. Its specific weight was 1219 kilograms per cubic meter, elasticity 3.708 Pascal, Poisson distribution 0.37 and thermal expansion 80-6 Kelvin-1 [21]. Density and other characteristics were analyzed in the civil engineering laboratories of Universidad Católica de Colombia. Plastic material was tested in flexion in Test Three Points with a prototype in reused polyethylene terephthalate. The dimensions were: length 0.25 meters, width 0.05 meters and 0.01 meters thickness.
Prototype’s flexion test was developed in an electronic universal machine and the graphics load-deflection were extracted from its software. Figure 2 shows the graphic load vs displacement of the material. Plastic behavior is in the linear part of the graffic between 0 meters to 0.03 meters deformation. The load applied for this deformation was 380 N.
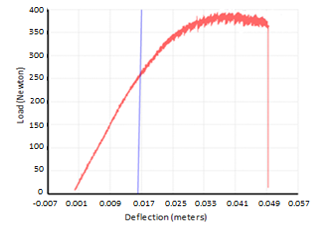 Figure 2. Load vs deflection in flexion test.
The laboratory results support the inference that recycled plastic can be used in the entire structure and the process presupposes the material offers resistance, flexibility, and functionality in structures of pavement.
5.1. Structure type 1.
Figure 3 shows the Structure type 1 model. This included three supports between the top and the bottom. Each support is 0.14 meters wide and as long as the element. Two of the supports are in the borders and the other is in in the middle.
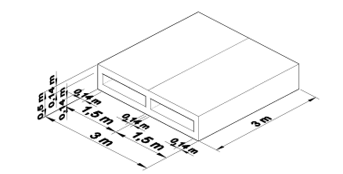 Figure 3. Structure type 1.
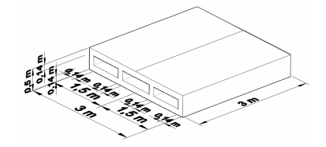 Figure 4. Structure type 2.
5.2. Structure type 2.
Figure 4 shows the Structure type 2 model. This included four supports between the top and the bottom elements. Each support is 0.14 meters wide and as long as the element. Two of the supports are in the borders and two are one-third (1.0 meters) to each border.
5.3. Structure type 3.
Figure 5 shows the Structure type 3 model. This included five supports between the element in the top and the bottom. Each support is 0.14 meters wide and as long as the element. Two of the supports are in the borders and the other one is in the middle. Also, two of the supports are in the quarters (0.75 meters) to the borders.
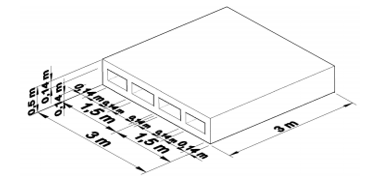 Figure 5. Structure type 3.
6. Simulation.
The process developed in this phase of the research was the simulation in the software SAP2000. This software uses the methodology of limit elements and with a sophisticated, intuitive and versatile tool used in design for engineering in different applications. This software enabled the creation of 3D elements for modeling analysis, including research parameters used to simulate one structure in plastic as real as possible. This is the first approximation for modeling structures without the arid layers of support. The subgrade was assumed to be a non-deformable material; it was an initial hypothesis for modeling, albeit the majority types of soils are deformed under loads. However, due it begin the first model, research analyzed only the element in plastic. The software permitted analysis of displacements in many points of the structure because the model can be divided in a high quantity into little cubic elements. Parameters are included in SAP2000 and the network is developed with 4 nodes.
Once the model is made, all elements can be divided into a network, and each node permits the identification of displacements under loads in different positions in the structure. This is achieved in multiple steps. First of all the element is divided into multiple series of elements. The series are determined by the required precision. The precision was connected by a discrete number of nodal points. Subsequently, a matrix is developed. The matrix relates variables in the nodes for each one of the divisions. Afterwards, the matrix is combined in a set of algebraic equations that describe the behavior of the structure analyzed. Finally, the set of algebraic equations is solved by a matricial method [22].
Elements from the general structure are drawn with shells. In the software, each node of the top shell has five grades of liberty with deformation. Three of them are translations (axes X, Y, and Z) and the other two are rotations (axes X and Y) [23].
Characteristics of shell elements showed the closest for the analysis, so the model was drawn in shells for this research. Analysis of deformations in Polyethylene Terephthalate with loads over the surface can be easily studied and it is possible in its study to measure reactions, deformations, and strengths in each node of the structure. Furthermore, elements were defined as “thin” based on the relation between thickness and length; the relation showed the length was over 20 times greater than the thickness. This relation is important to determine if elements work thin (more flexible) or thick (more rigid). This definition permits to SAP2000 the highest detail in the calculations developed in numerical simulation [24].
The element in the bottom was defined with restrictions of all displacements. For this simulation the soil is non-deformable and the structure does not suffer other effects. Using this assumption, though not real, provides the possibility for the first approximation of simulation. The target with this assumption is to analyze only the structure in recycled plastic and not other materials. Also, SAP2000 is a tool used in materials with different behavior as shown by the soil. Figure 6 shows the structures type 1, 2 and 3 modeled in SAP2000 with restrictions as supports in the bottom’s element.
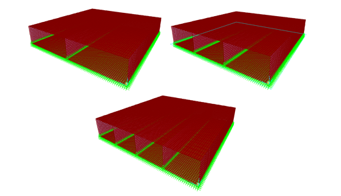 Figure 6. Simulation conditions of structures type 1, 2 and 3.
Loads applied in the simulation were defined in accordance with INVIAS to point load generated by trucks with a single axle and double tire. The norm defines 11000 kilograms for this axle divided into two point loads over the pavement with 58000 Newton each tire. This value is assumed even though it is superior to vehicles type A. The loads in real parameters could be present in tracks for passengers and light loads.
Loads applied simulate fires that produce point loads in each axle over top shell in the structure. Model in SAP2000 permits the location of loads in each node of the mesh. The structure was divided into nodes each 0.15 meters and one load per simulation. Using this mechanism shows the highest detail as possible, in order to identify the place where the structure could be more vulnerable. Furthermore, the load was applied in the border, in the middle (1.5 meters of the border) and each quarter (0.75 meters of the border) in the parallel direction of traffic as is shown in the Figure 7. Also, each load was simulated independently as is shown in Figures 8, 9 and 10 for structures type 1, 2 and 3. Each kind of structure was analyzed with the same parameters of the load in order to do the comparison of vertical displacements in the top for the three types of structures. Logically, it is possible to think that Structure type 3 would have fewer displacements. However, the intention with all simulations is to identify the structure with permissible deformations using the minor quantity of plastic in its construction.
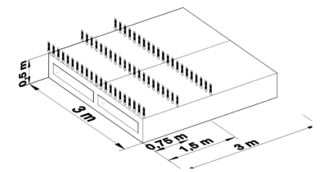 Figure 7. Isometric of application to loads on structure type 1.
Developing the simulations required 189 times with one load. The output information by SAP2000 was saved in data processor Excel and the relevant information was extracted. This information is selected to compare each node network.
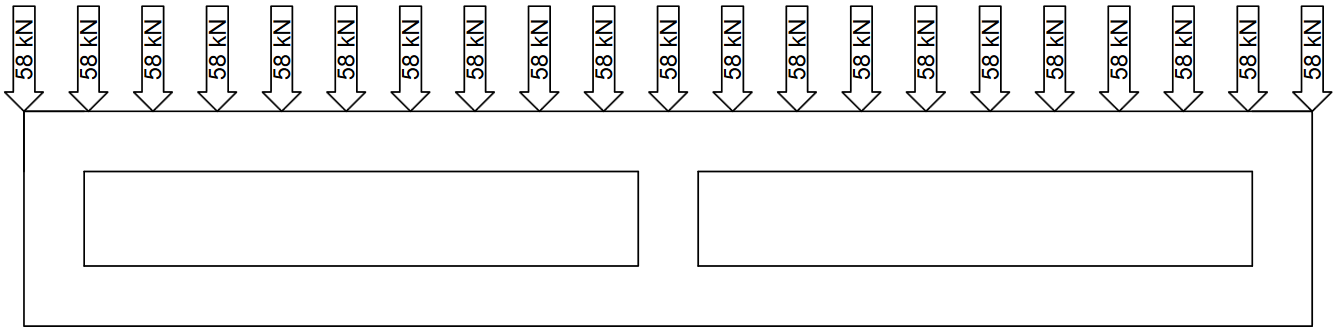 Figure 8. Loads application in cross-sectional view in structure type 1.
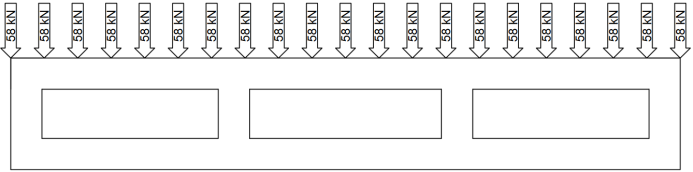 Figure 9. Loads application in cross-sectional view in structure type 2.
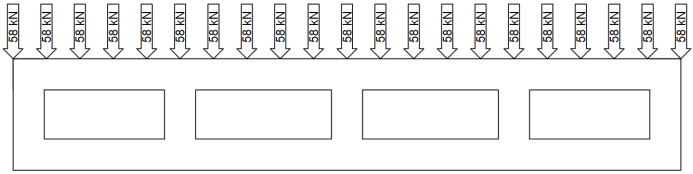 Figure 10. Loads application in cross-sectional view in structure type 3.
7. Results and analysis
Vertical displacements in the nodes are shown in a discrete network. The point load (58000 N) was applied over the top surface in the structure for each simulation. The information permits the comparison of behavior in all the points in the structure when the load is applied to different points over it. The purpose was to identify the critical point of the structure, or the place where the highest displacement is shown and defined by whether it is possible to develop a plastic structure in these conditions of simulation. Figure 11 shows an example of how the structure was analyzed, each simulation in two axes longitudinally and transversely.
Vertical displacements are typical behavior from plastic materials loaded with gravitational forces. The load perpendicular to the structure and deformations are shown for all of the structure. Some of the points display performance compression and others traction. Deformations are produced by a thermodynamic process. Energy is accumulated internally and is transformed in elastic potential energy. So, it is important to know the elasticity module and use it correctly in order to find high accuracy.
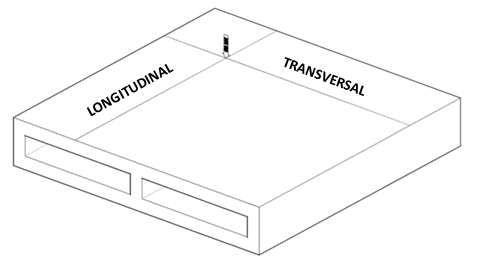 Figure 11. Axes for measuring results.
Figure 12 shows, without a real scale, how one load can affect entire structure. So, it is necessary to analyze all points and to compare displacements at the same point in the structure. This research shows displacements in the top. There are more vulnerable places where the structure could fail.
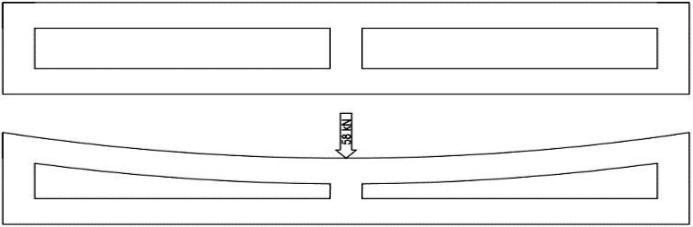 Figure 12. Model of displacements cross-sectional in structure type 1.
The same load reviewed in the direction parallel to the traffic, it has a different behavior in accordance with the point where is applied the load. Figure 13 shows one model without scale about how are the displacements in the structure when the load is applied to the border of the structure.
 Figure 13. Model of displacements in the parallel direction to the traffic in structure type 1.
Models used were defined in three cases. Case A, when the loads are applied in the border. Case B with load on 0.75 meters of the border and Case C with loads on the middle of the structure (1.5 meters of the border). Vertical displacements in structure type 1 were taken in the three cases and compared in Figure 14. It is possible to identify that in the cases B and C, vertical displacements are shorter in comparison with case A. The results obey to the continuity of the material. For example, in the border (case A) deformations in the middle of the empty space are more than 0.0035 meters. While in the quarters (case B) or in the middle (case C), vertical displacements are around 0.00025 meters. In other words, vertical displacements are between 60% and 73% less in continue material. In this case, it is important to identify different mechanisms for doing a complete structure in order to transfer the loads adequately and get less deformation in the borders of the elements. It is possible to identify also that on the supports, vertical displacements are depreciable; the solid material shows the high resistance of contraction to continue material.
Consequently, when it analyzed the structure type 2, the behavior is completely similar to the first type of structure. Deformations on supports are very small and in the middle of the empty spaces are highest as is shown in Figure 15. In this case, three cases are analyzed as well. In the border (case A) in a quarter to 0.75 meters (Case B) and in the middle to 1.5 meters of the border (case C) all of them were studied by the same magnitude of load but the difference is the number of supports throughout the structure.
In the Figure 15 can be seen that vertical displacements are significantly smaller than structure type 1. In the border, the highest deformation was around 0.00168 meters. Also, the middle vertical displacements are around 0.00025 meters. The magnitudes permit to infer that this type of structure can have an adequate behavior for difficult conditions with important applications in roads engineering. Deformations conserve the same relation between 60% to 74% less in the quarter (case B) and the middle (case C) in comparison with the border’s vertical displacements.
Clearly, it is easy to identify that where the material is homogeneous as under the supports, the vertical displacements are considerably minors than in the border where it showed the highest deformation. Furthermore, with this results in the border analyzed vertical displacements, it is possible to infer that the behavior is completely defined by the boundaries condition and especially when the material is discontinuous. Making a solid structure is a possibility for fewer deformations. However, it is important in this phase of the research to identify the behavior in all the structure because of the necessity of force’s transference in completely necessary in roads engineering.
Structure type 3 was analyzed in the same way. The case A with loads throughout the border, punctual loads on 0.75 meters of the border (case B) and in the middle of the structure (case C). Figure 16 shows the envelope of vertical displacements in each case. The
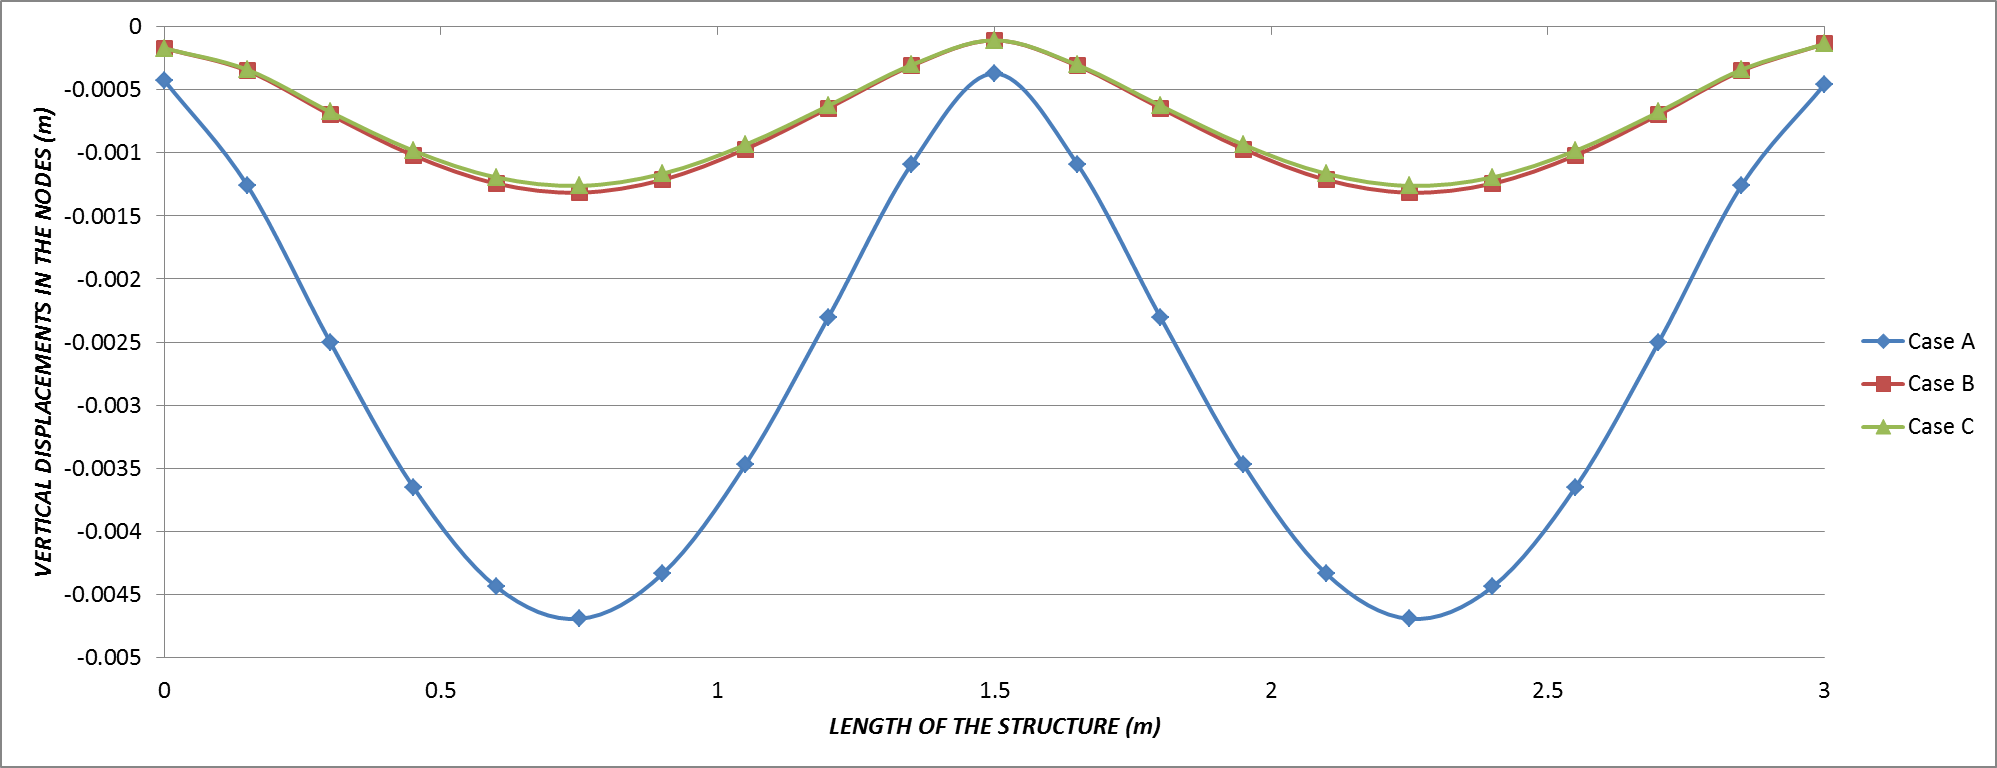 Figure 14. The envelope of vertical displacements in structure type 1.
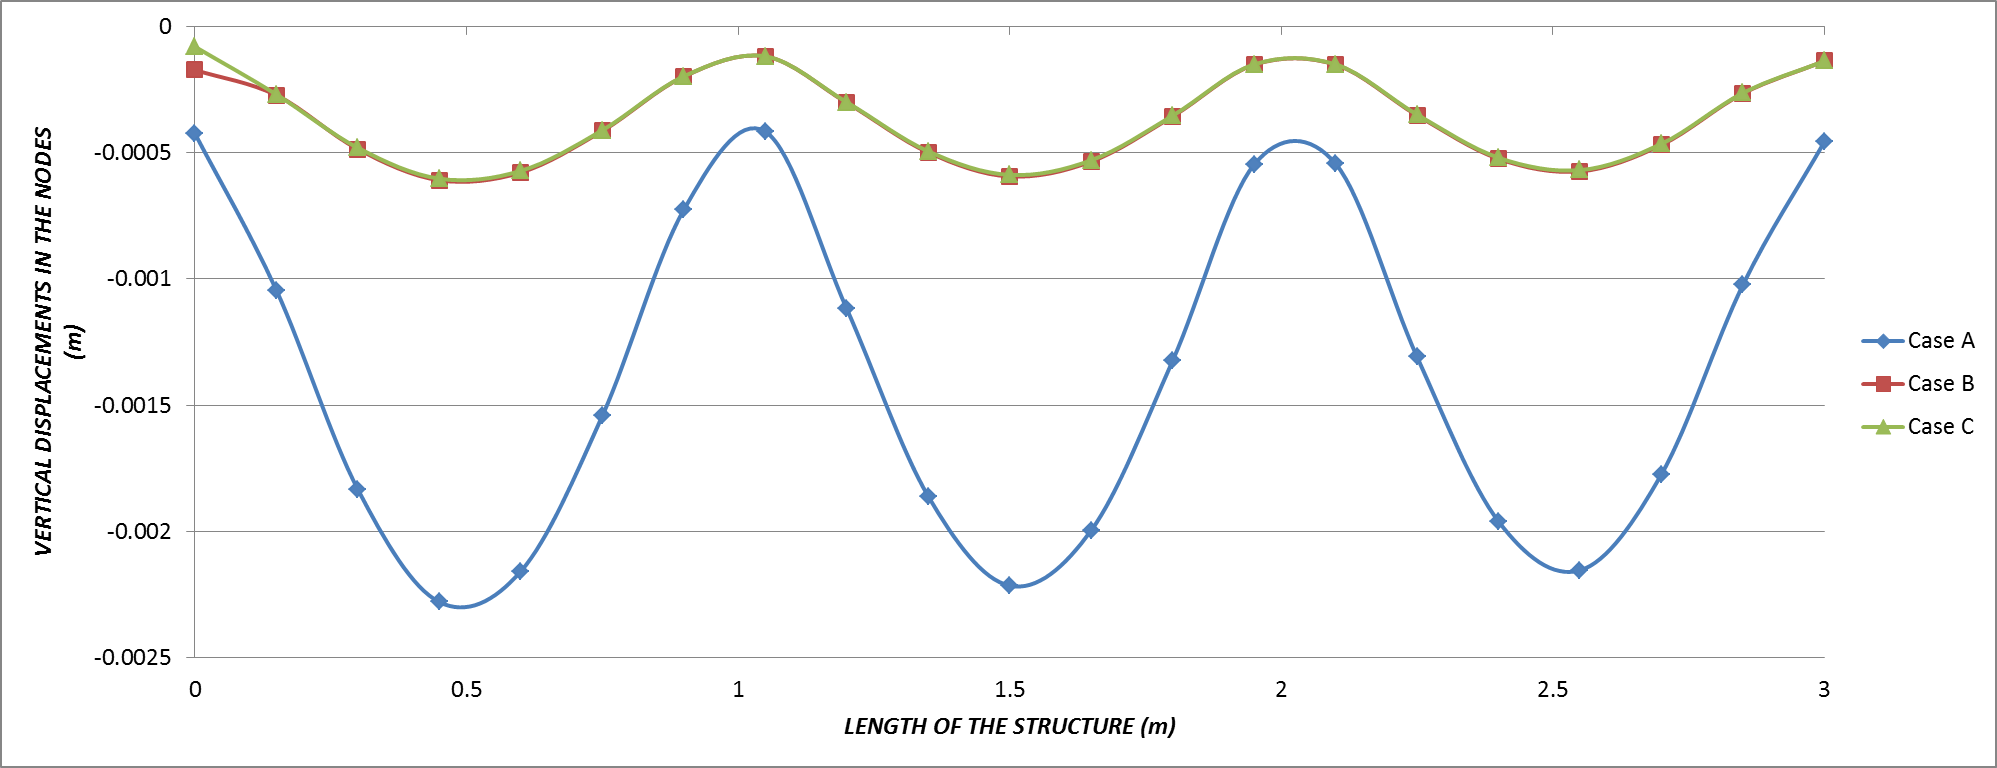 Figure 15. The envelope of vertical displacements in structure type 2.
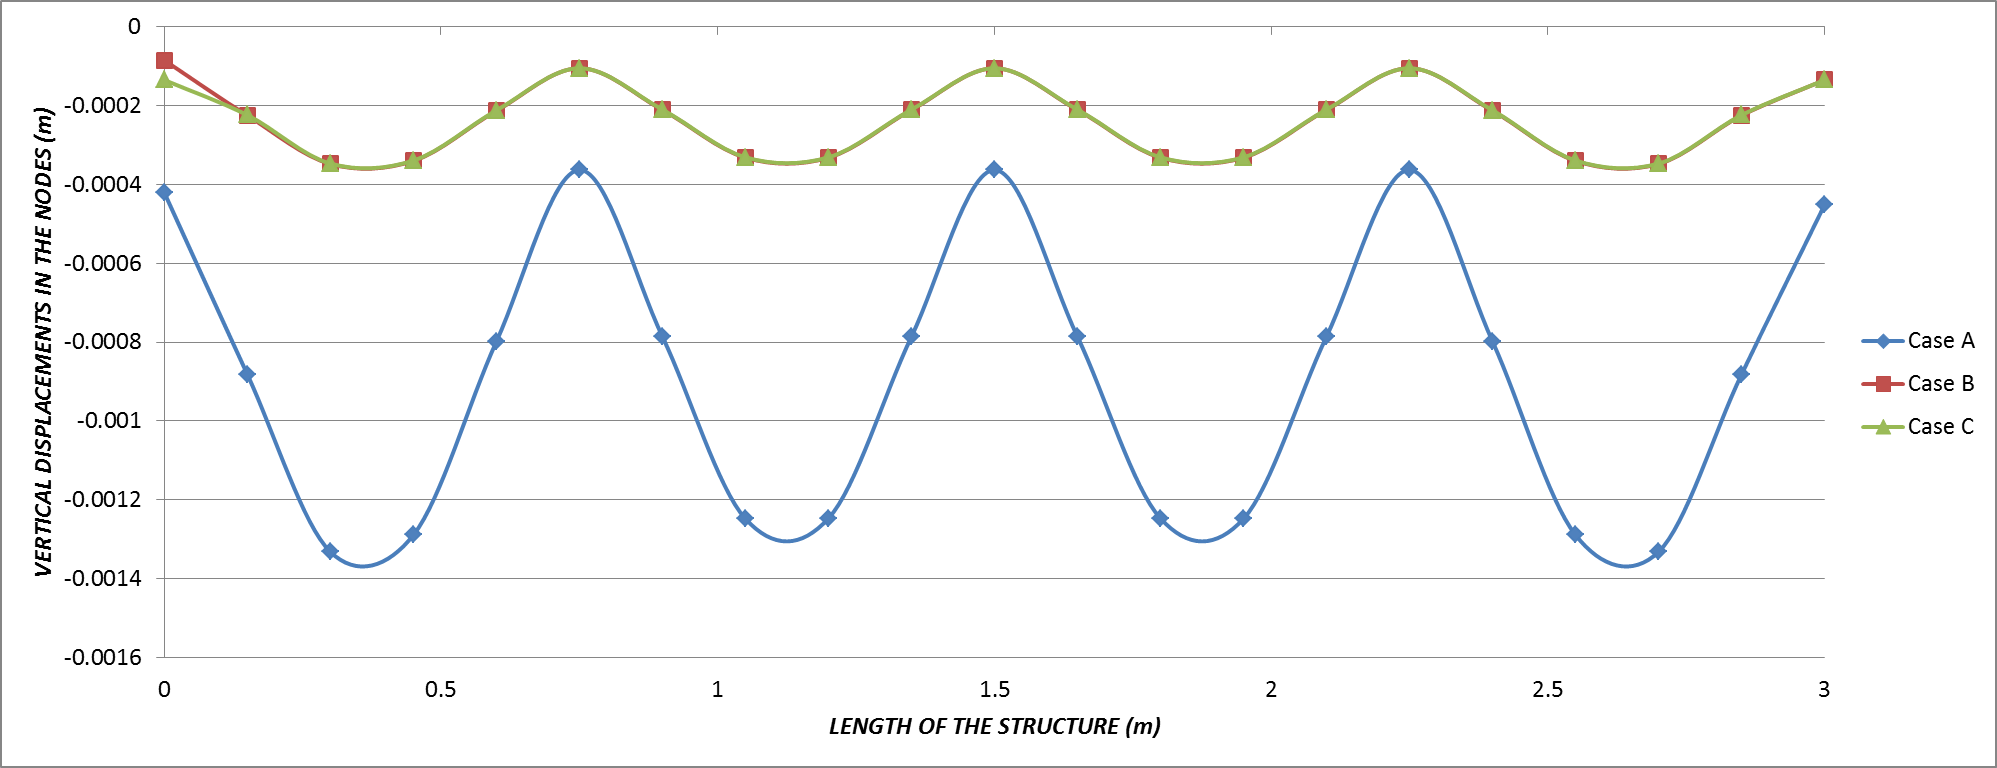 Figure 16. The envelope of vertical displacements in structure type 3.
tendency of its behavior is the same. Negligible deformations in the supports and the highest vertical displacements in the middle of the empty space. Clearly, the quantity of this results shows that vertical displacements descend in the middle until near to 0.001 meters. The deformation is depreciable if is analyzed by traffic loads type A. Structure type 3 could be utile for traffic heavier and could be used in national roads as possible. However, it is necessary for other possibilities, to modify the magnitude of loads and to make the simulation.
It is possible to say that the structure type 3 has the highest efficiency of strengths distribution. The results, showed in the envelope, permit to identify vertical displacements in the critical points in structure type 3 are more than 70% inferiors than the critical points in the structure type 1. The comparison shows the results that were expected because of the number of support the more resistance of all the structure. Clearly, it is important to define the material is plastic and the behavior analyzed was defined as a continuous and homogeneous material.
The three structures were compared in the critical case in Figure 17. At the borders, the behavior of the three types of structures is completely different, but the tendency is the same. Vertical displacements on supports are smaller and on the middle of the empty space highest in all cases. This does not mean that the behavior is the same. It is clear that structure type 3 has 5 supports, and its behavior is completely different than structures type 2 and 1, but the tendency of behavior was similar.
Structure type 1 shows a behavior with highest deformations in the borders (case A) when the load is applied in the middle of the empty space. Likewise, structure type 2 shows a similar behavior, but in comparison with the type 1 structure its vertical displacements are reduced by around 28%. Structure type 3 demonstrates the best behavior with vertical displacements; it shows a reduction of 41% compared with structure type 2 and 72% compared with structure type 1 in the same conditions of loads.
Furthermore, it is possible to say that is unnecessary to use more supports in the structure, considering the traffic loads type A. It is important to clarify that the material should be homogeneous and the construction should guarantee high quality in the structure in order to get the best behavior in a prototype. Tested in laboratory or in camp tests.
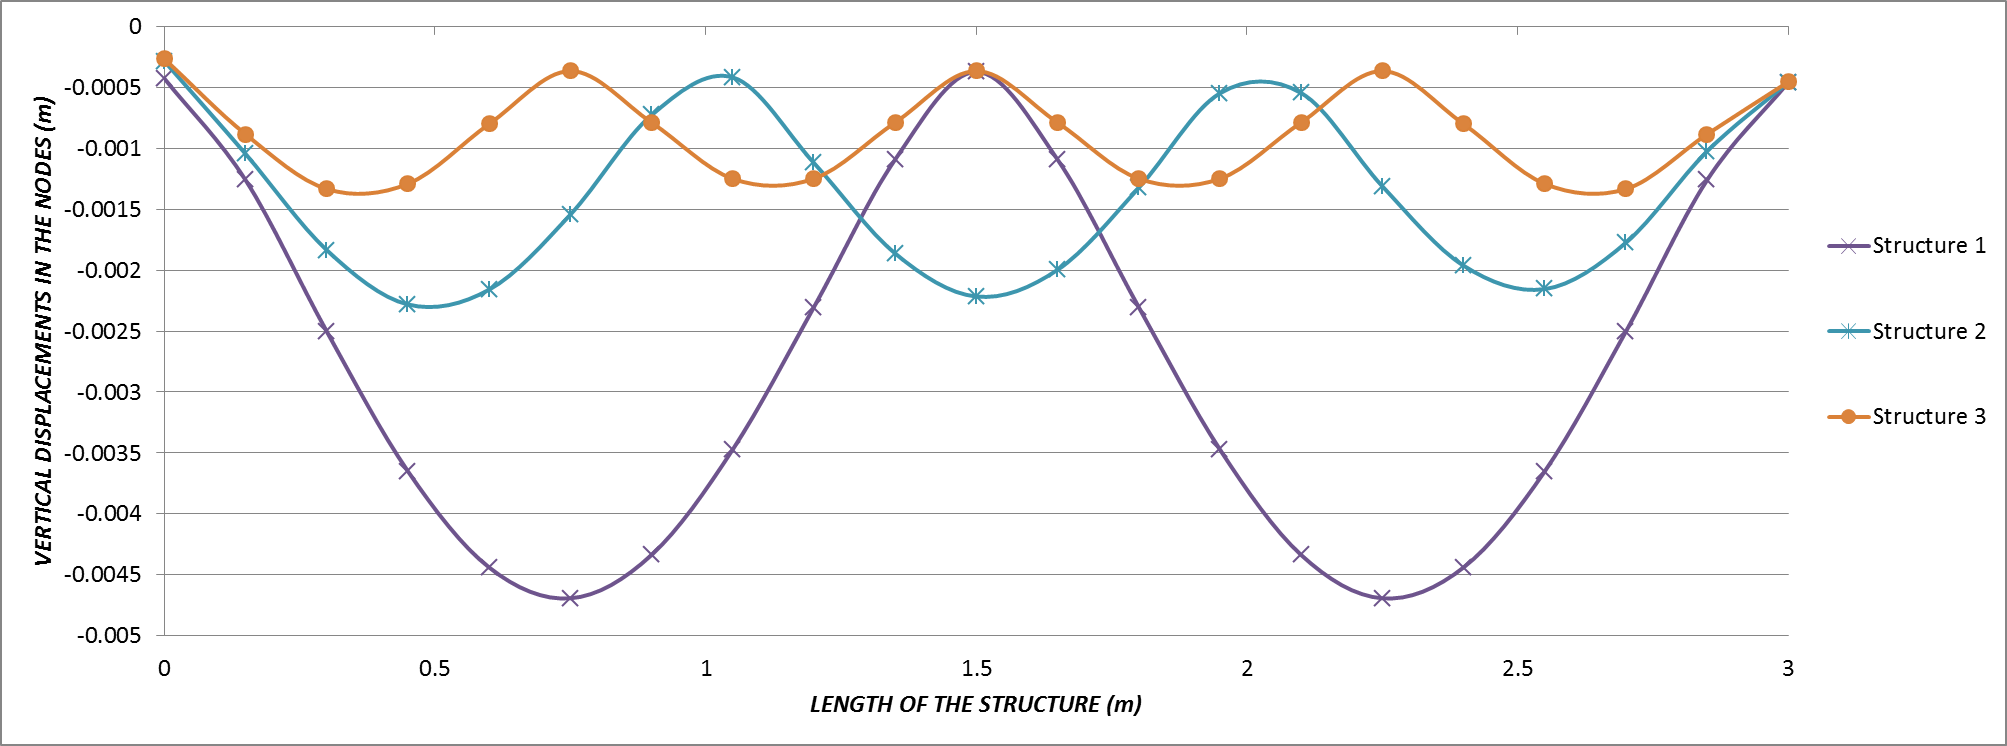 Figure 17. Comparison of envelopes of vertical displacements in structure type 1, 2 and 3.
8. Model of optimization
During the process of simulations, it was possible to identify that the structure type 2 displays the necessary resistance for supporting these loads with vertical displacements in the critical points that is a considerably low value. After the analysis of this material in the laboratory, it is possible to infer that Polyethylene Terephthalate can be deformed 0.03 meters and does not lose its plastic characteristics.
 Figure 18. Model of charge for traffic type A.
Furthermore, the comparison of the supports of all vertical displacements show that both types of structures have similar behavior. Consequently, the type 2 structure was selected for developing another simulation, changing the thickness of the structure and reviewing its behavior. Models of simulation proposed one model of charge with one automobile, which induces punctual vertical loads over the structure as is shown in Figure 18. Each load is defined as 30000 N and separated 2.25 meters, according to the description of cars dimensions in the INVIAS manual.
The analysis was developed in the border of the structure (case A). The point where the critical conditions for loads were found. The new simulation was defined with six widths of structure: 0.06, 0.08, 0.10, 0.12, 0.14 and 0.16 meters respectively. Figure 19 shows vertical displacements in the critical points of the structure for the six versions of the model. As was identified in the simulation of critical conditions, it is possible to determine that the structure shows the highest deformation under the point where the loads are applied. This model applied two loads simulating the fires of a car. The central space of the structure showed positive displacements; in that segment the structure permits flector moments to transfer strengths, and the displacements change to the other size of reference ax.
A structure with 0.06 meters of width shows the highest vertical displacement 0.01303 meters. Even though this deformation is high in the simulation, if it is analyzed in real conditions, deformations from 0.013 meters are not very significant; it is possible that one structure has irreversible deformations for the frequency of the load’s application.
The structure with 0.08 meters shows deformations of 0.0058 meters. For the 0.10 meters of width, it showed 0.00291 meters. With the structure, 0.12 meters is found 0.00117 meters of vertical displacement. The structure with 0.14 meters of width 0.001001 meters. And finally, for 0.16 meters in simulation, the structure showed 0.000759 meters of deformation in the borders.
Figure 20 contains critical deformations in all the type 2 structures with different widths. The loads were analyzed parallel to traffic direction. It is possible to infer that for applications on a real scale, it is necessary to identify one mechanism for transferring strains.
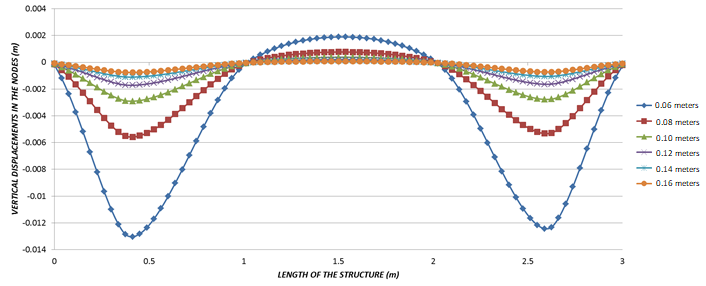 Figure 19. Enveloped of vertical displacements for structure type 2 with different width cross-direction to traffic.
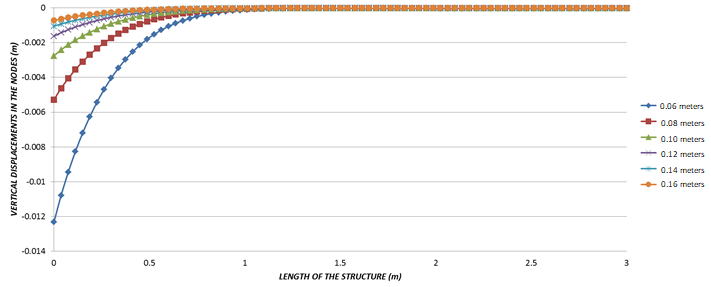 Figure 20. Enveloped of vertical displacements for structure type 2 with different width parallel to traffic direction.
Conclusion
Polyethylene Terephthalate highly pollutes the environment, and is frequently disposed without control in landfills or incinerated. Because of its characteristics this material can be recycled and transformed for a variety of uses while reducing its polluting potential. Polyethylene Terephthalate`s high resistance and flexibility inspire studies into its potential uses. The research proposes developing rolling surfaces in pavement structures.
The simulation offers considerable results according to the identification of different types of structures and different width in one of those structures. Structure type 2 showed important results because the vertical displacements are permissible and it permits optimization of the quantity of material required for making each element. Different widths show the structure supports without difficulties of traffic loads type A and would support loads type B in some cases.
Admissible deformations were the basis for changing the model of structures and the width in the last exercise where it was possible to allow for making test prototypes. The critical case shows potential use in cycle paths, walk paths and small streets for automobile vehicles. However, it is necessary to do more studies in resistance, prototypes and especially in protection against fire.
Empty spaces inside the structures are functional. It is possible to use these spaces for electrical or hydraulic ducts or for another kind of service in the structure.
Case A was the most critical situation in all simulations during the research. These results obey the discontinuity of the element in the borders. The results open new ways for research in how transfer charges from one element to the next. The process, even though it would be for construction, helps research to identify different possibilities for making the structure as a prototype or on a real scale.
Another research possibility is the characteristics of this behavior when the support of all the structure is not rigid. Simulation was developed using soil deformations under the structure. For traffic type A, these deformations are non-considerable, but in a real process of analysis, it is necessary to introduce the most variables as possible.
It is recommended to identify where plastic pavement structures could be used under different conditions and to model different types of structures; include more variables in the system or use different software which simulates the soil behavior and the structure behavior at the same time. Furthermore, it is recommended to apply more tests to this material, especially recycled material: recycled material tends to be different depending on the process for transforming it.
- A. Gutiérrez, “¿Qué es la movilidad?. elementos para (re) construir las definiciones básicas del campo del transporte”, Bitácora Urbano Territorial, Universidad Nacional de Colombia, 21(2), 61-74, 2012.
- E. Arencibia, J. Junco, M. Perera, “Análisis de la contaminación atmosférica de la planta de asfalto caliente “Abel Santamaria”, de coliseo”, Revista Avanzada Científica, 16(3), 2013.
- F. Reyes, M. Madrid, S. Salas, “Mezclas asfálticas modificadas con un elastómero (caucho) y un plastómero (tiras de bolsas de leche con asfalto 80-100)”, Infraestructura Vial, Pontifica Universidad Javeriana, 1(17), 25-34, 2007.
- N. Kalantar, R. Karim, A. Mahrez, “A review of using waste and virgin polymer in pavement”, Construction and Building Materials, 33, 55-62, 2012.
- R. Siddique, J. Khatib, I. Kaur, “Used of recycled plastic in concrete: A review”, Waste Management, 28(10), 1835-1852, 2008.
- D. Martínez, L. Cote, “Diseño y fabricación de ladrillo reutilizando materiales a base de PET”, INGE CUC, 10(2), 76-80, 2014.
- J. Carswell, F. Cruz, “Misión y ventajas de los betunes modificados con polimeros”, Revista de la Asociación Técnica de carreteras, 1(63), 33-39, 1997.
- A. Tellez, “La complejidad de la problemática ambiental de los residuos plásticos: una aproximación al análisis narrativo de política pública en Bogotá”, MSc Thesis, Universidad Nacional de Colombia, 2012.
- G. Gourmelon, “Global plastic production rises, recycling lags”, Vital Signs Online, World Watch Institute, Washington, DC, United States, 2015.
- R. Sarria, G. J, “La gran problemática ambiental de los residuos plásticos: microplasticos”, Journal de Ciencia e Ingeniería, 8(1), 21-27, 2016.
- J. Jambeck, R. Geyer, C. Wilcos, T. Siegler, M. Perryman, A. Andrady, K. Lavender, R. Natayan, K. Lavender, “Plastic waste inputs from land into the ocean”, Science, 347(6223), 768-771, 2015.
- M. Friksen, L. Lebreton, H. Carson, M. Thiel, C. Moore, L. Borrero, J. Reisser, “Plastic polution in the world’s oceans: more than 5 trillon plastic pieces weighing over 250,000 tons afloat at sea”, PLoS ONE, 9(12), 2014.
- Departamento Nacional de Planeación, “Rellenos sanitarios de 321 municipios colapsaran en cinco años, advierte el DNP”, Bogotá, Colombia, 2016.
- A. Melro, P. Camanho, F. Andrade, S. Pinho, “Micromechanical analysis of polymer composites reinforced by unidirectional fibres: Part I-Constitutive modelling”, International Journal of Solids and Structures, 50(11), 1897-1905, 2013.
- A. Black, Urban mass transportation planning, McGraw-Hill, New York, United States, 1995.
- S. Al-Salem, S. Lettieri, J. Baeyens, “Recycling and recovery routes of plastic solid waste (PSW): a review”, Waste Management, 29(10), 2625-2643, 2009.
- C. Maharaj, R. Maharaj, J. Maynard, “The effect of Polyethylene Terephthalate particle size and concentration on the properties of asphalt and bitumen as an additive”, Progress in Rubber, Plastics and Recycling Technology, 31(1), 1-23, 2015.
- C. Swaptik, A. Tashkant, O. Suganya, “Polyethylene Terephthalate (PET) waste as building solution”, International Journal of Chemical, Environment and Biological Sciences, 1(2), 308-312, 2013.
- H. Kosmatka, B. Kerkhoff, W. Panarese, J. Tanesi, ” Design and Control of Concrete Mixtures”, Portland Cement Association, Illinois, United States, 2004.
- Instituto Nacional de Vías, “Manual de diseño de pavimentos asfalticos para vias con bajos volúmenes de tránsito”, Bogotá, Colombia, 2007.
- L. Avila, G. Martinez, C. Barrera, F. Ureña, A. Loza, “Effects on mechanical properties of recycled PET in cement-based composites”, International Journal of Polymer Science, 1-6, 2013.
- Singiresu, Rao, “The finite element method in engineering”, Butterworth-Heinemann, Chennai, India, 2017.
- E. Wilson, “Three-Dimensional static and dinamic analysis of structures”, Computer and Structure Inc, Berkeley, United States, 2011.
- S. Ahmad, B. Irons, O. Zienkiewicz, “Analysis of thick and thin shell structures by curved finite elements”, International Journal for Numerical Methods in Engineering, 2(3), 419-451, 1970.