Minimally Invasive, Thermal Energy Based, Cost-Efficient Method to Measure Fluid Flows in Compact Systems

Adv. Sci. Technol. Eng. Syst. J. 3(5), 454–458 (2018);
 DOI: 10.25046/aj030552
Flow measurements are important for numerous industries as it directly relates to proper equipment functioning and product quality. This work demonstrates a novel thermal energy based compact flow measuring sensor. The sensor injects thermal energy into the core which is then extracted by the moving flow through the center of the core. Temperature changes produced by thermal energy exchange is evaluated over time and then used to calibrate and measure flows. The sensor can detect extremely low energy changes therefore measure relatively low flow rates as well. Being minimally intrusive, it does not disturb the flow eliminating any additional resistance commonly introduced by intrusive type sensors. It is made from inexpensive components and is easy to assemble therefore making it affordable. The simple geometry allows for it to be easily incorporated into compact systems and can be used in miniature devices to measure low flows. We declare this minimally intrusive only due to breaking the flow path with the sensor element otherwise it is non-intrusive.
1. Introduction
Fluid flow measurement is an essential as well as critical step in numerous processes and finds applications in many fields such as medical diagnostic devices, pharmaceutical industry, food industry, automotive industry, chemical industry, compressed air systems, and others (1). Precise fluid management is essential to regulate basic functionalities of a system. In certain applications accurate flow measurement becomes the key player by directly influencing the quality of the product (2). Rapid research and developments in microfluidics also dictates a need to develop ways to accurately measure and analyze extremely low flow rates (3). Flow measuring can be classified broadly into two categories: intrusive and non or minimally intrusive. In an intrusive method, the flow encounters a constriction or other mechanical interference. Intrusive methods typically depend on the forces produced by the flow which are then correlated to flow rate values. Mechanical flow meters, pressure dependent meters, and vortex based flow meters are examples of intrusive type flow meters. These meter types are relatively inexpensive and are available in variety of shapes and sizes. However, they are limited by their repeatability, accuracy and operating ranges. Being intrusive they reduce the flow rate within the system due to added resistance above the inherent system flow resistance. At low flow rates the kinetic energy associated is also low and inadequate to be converted into measureable mechanical movement (4). Fluids temperature changes affect the internal structure of these types of meters rendering this type of devices not suitable for applications where fluid temperatures changes are frequent and occupy a wide range (5).
Non-intrusive methods include optical, sonar, thermal, electromagnetic, Coriolis, and laser Doppler based flow meters. These types of flow meters do not interfere with the fluid motion or path and can measure most liquids. However electromagnetic flow meters can only measure the flow rate of a fluid conducting electricity and are expensive compared to their intrusive counterparts (6). Other flow meters based on optical, sonar, and Coriolis methods are accurate but very expensive to implement and have limited capabilities at low flow rate (6). Traditional thermal sensors need complex control system involving pulse width modulation (PWM) to constantly provide power to the heated element and maintain its temperature (6). The energy loss from the heated element due to fluid flow is correlated to the flow rate for measurements and requires extensive data acquisition. We herein present a novel way to measure flow rate and fluid velocity in a minimally intrusive, easy to assemble and cost-effective manner by simple cooling rate measurement obtained from temperature readings. The sensor only needs to be powered once for a reading, measures the energy loss from the system and establishes correlation with the flow rate. Moreover, the sensor was very easy to calibrate, capable of detecting low flows and has excellent linearity and response time. In addition to the advantages mentioned above, the sensor is calibrated at a defined inlet temperature and therefore accounts for fluid property variations resulting in accurate readings.
2. Experimental Method
2.1. Material Selection and Sensor Design
A cylindrical aluminum rod with dimensions as shown in Figure 1a and 1b was used as the central core for the sensor. The density of aluminum being low compared to other conductive metals is capable of producing rapid temperature changes with small amount of stored thermal energy loss thus enabling low flow rates to produce measurable temperature differences. A circular opening equivalent to the inner diameter of the polymer tube was machined first at the center of the block for the fluid pathway. Counter boring operation was performed on the two flat outer surfaces for a short length to create an opening equal to the outer diameter of the polymer tubing. The tubing was then inserted from both sides and is represented in Figure 1a. The resulting geometry ensured uniform opening at the center of the aluminum core for the fluid motion, with minimal flow disturbances and alteration to system flow rate. Figure 1b shows the side view of the aluminum core. An opening with its center at the midway of inner diameter and outer diameter of the block was machined to accommodate the thermal sensor. Before inserting the sensor, adequate thermal grease was introduced into the opening to maintain thermal contact between the aluminum core and the sensor. The Biot number associated with the selected block is small (<0.1) which signifies analysis based on lumped heat capacitance method for the current system is valid with an error of less than 5%. Therefore, it is safe to assume that the temperature measured at any location on the aluminum block is at least 95% accurate and closely resembles the temperature of the entire block.
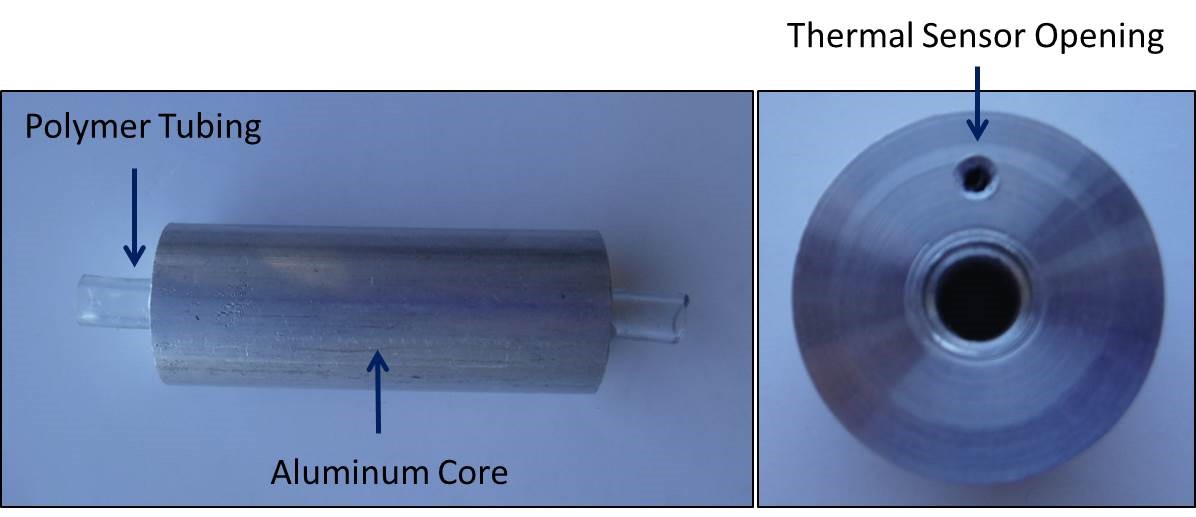 Figure 1: (a) Aluminum core with connected polymer tubes and (b) side view with counter bore and thermal sensor opening
2.2. Data Acquisition
Figure 2a represents the resistive heating element utilized to supply thermal energy to the aluminum core. A 12V DC power supply (YH-302D Yihua, China) connected to the heating element was controlled by Arduino UNO that used the temperature readings obtained from the thermal sensor (10K thermistor, see Figure 2b). The thermal sensor was calibrated using the Steinhart-Hart equation which is capable of producing accurate results between the ranges of 0 – 50° Celsius (Error -0.005 – 0.002° C). Code was written and embedded into to the Arduino UNO to monitor the temperature readings continuously and perform logical and arithmetic operations as needed. Initially, fluid was cooled to a desired temperature (14°C and 15°C in the present testing) using a novel system which also contained a pump to produce necessary volumetric flow rate. The system continuously monitored fluid temperature just before it entered into the sensors’ aluminum core. Once fluid reached desired stable temperature a constant flow was allowed to pass through the core and the flow rate was measured using a calibrated flow meter (intrusive). The embedded code then turned the power supply on when the temperature of the aluminum core dropped to 16° C and turned the power supply off when the temperature reached 21° C. The constant flow of cold fluid dropped the temperature of the core. Time required by the fluid moving at a particular flow rate (recorded from the intrusive flow meter) to drop the temperature of the aluminum core by 2° C from 20 to 18° C was recorded. Cooling rate of the flow was calculated using (8). The flow rate to the aluminum sensor core was then randomly altered by pinching the polymer tube and all the previously mentioned steps were repeated for four different flow rates and two different inlet flow temperatures. The cooling rates obtained from the code and volumetric flow rates from the flow sensor were tabulated and are presented in the results and discussion section. The correlation obtained was then utilized to calibrate the minimally intrusive sensor.
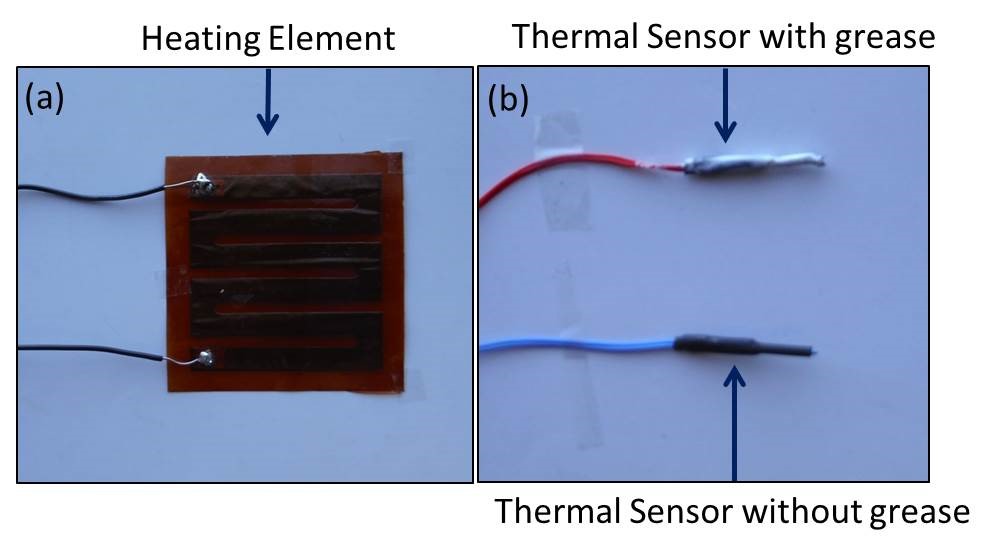 Figure 2: (a) Heating element with cables that are to be connected to a DC power supply and (b) thermal sensor used to monitor temperature readings (with and without thermal grease)
3. Theory
3.1. Thermal Analysis
The heater element attached to the peripheral surface of the aluminum core elevates the temperature of the entire metal by converting electrical energy into thermal energy. Thermal energy received by the aluminum core from the outer surface is conducted inwards towards the center. The energy reaching the center is carried away by the fluid making contact with the aluminum core through the mode of convective heat transfer as represented in Figure 3.
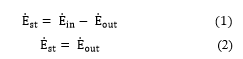 The amount of energy stored is equal to vector summation of energy entering and exiting the system in the absence of internal energy generation. The energy balance of flow rate measuring system is represented by (1). When the temperature of the aluminum core as measured by the thermal sensor reaches 21° Celsius, the power supply to the heater is terminated. As a result the energy entering the system is effectively zero from that moment onwards. Eliminating the energy entering term (1) can be condensed into (2) which suggest that the energy stored in the aluminum core is gradually conveyed away by the energy exiting the flow rate measuring system. In the present system, energy can exit through three different medium namely (a) convective heat transfer – water and (b) convective heat transfer – air and (c) radiative heat loss. The insulating layer of Poron© covering the entire outer aluminum core surface minimizes the convective heat
 Figure 3: Schematic representation of the sensor including the heater element, aluminum core, thermal sensor, fluid tubing, and insulation. The sensor used for experimentation is also shown in the image.
transfer produced by air flow and therefore can be neglected. The radiative heat transfer losses for the temperatures at which the current system operates is also minimal and can be neglected as well. Eliminating other modes of heat transfer it is safe to conclude that the energy stored in the aluminum rod after the power supply to the heater is terminated is conveyed out by the fluid (14°C and 15°C) flowing through the center of the core. The energy balance between stored energy in the aluminum core and fluid motion is represented in (3). The amount of energy stored in the fixed mass aluminum core can be quantified as shown in (3) where , , , h, A, , and ∆t are mass, heat capacity, temperature difference in the aluminum core, convective heat transfer coefficient, area fluid makes contact with the aluminum core, temperature difference between fluid entering and exiting the center and time interval respectively (7).
Mass, heat capacity, area of contact, and the temperature difference of the aluminum core (2° Celsius) in the current test system can be termed constant. Moreover, the system is designed to produce minimum variation in the fluid temperature exiting the core by utilizing a relatively small length of the core and thus temperature difference of fluid can be assumed constant for most practical purposes. Arranging all the constants on one side and variables on the other (3) can be represented in a different form as shown in (4). The modified equation dictates that the product of convective heat transfer coefficient and time interval is practically a constant. In other words, the fluid condition for which the convective heat transfer coefficient is large, requires a smaller time interval to extract stored energy compared to a fluid condition with smaller convective heat transfer coefficient for the above mentioned flow rate measuring system. The correlation suggests, with the increase in convective heat transfer coefficient of the fluid the time needed to cool the aluminum core by 2° Celsius will decrease.
The convective heat transfer coefficient based of Nusselt number evaluated using Gnielinski correlation that accounts for friction factor (surface roughness) f, Reynolds number , Prantl number Pr, thermal conductivity of fluid k, and hydraulic diameter D is given by (5). The correlation in (5) can be used with the hydraulic diameter, independent of the surface thermal condition (7). As seen from (5), the convective heat transfer coefficient is directly proportional to the Reynolds number of the fluid which in turn is proportional to the flow rate of the fluid (6). Q, ϑ and are volumetric flow rate, kinematic viscosity, and cross-sectional area respectively in (6). Based on the above analysis we can deduce that with the increase in flow rate the convective heat transfer coefficient associated with the fluid also increases. The proposed minimally invasive flow rate measuring sensor exploits the above mentioned correlation between the fluid flow rate and the convective heat transfer coefficient.
3.2. Working Principle – Sensor
In order to quantify the energy exiting the aluminum core at different volumetric flow rate, a cooling rate term was defined that is a direct function of convective heat transfer coefficient h. The cooling rate as shown in (8) can be defined as the decrease in temperature of the aluminum core per unit time. From the above analysis we predict that with the increase in flow rate the convective heat transfer coefficient increases and therefore the cooling rate.
Theoretically from (8) we can say that the cooling rate or energy loss from the aluminum core will increase with an increase in the convective heat transfer coefficient and the other terms on the right side of the equation are practically constant therefore acting as a multiplication factor only. Cooling rate at several different flow rates and couple different inlet fluid temperatures (14°C and 15°C) were experimentally obtained and tabulated. The results are discussed in the next section. The experimentally obtained data was then utilized as calibration factor to evaluate flow rate in a minimally invasive manner.
4. Results and Discussion
After Figure 4 represents the relationship between volumetric flow rates through the sensor core and the associated cooling rates obtained from the code for inlet fluid temperature of 14° Celsius. A multiplication factor was used to represent the cooling rates with a better resolution. Time measurements for the flow to reduce the aluminum core temperature by 2° Celsius were extracted from the code and manual calculations were performed to cross check the cooling rates obtained directly from the code. The cooling rates obtained using both the methods were found to be identical. As can be seen from the experimentally obtained plot, the cooling rate increases with the increase in volumetric flow rate. The experimental results are consistent with the theoretical evaluation performed previously (7 & 8) which predicted that the cooling rate is proportional to the flow convective heat transfer coefficient h, which in turn is proportional to the volumetric flow rate Q. Additionally, it is important to note that the relationship between the cooling rate and volumetric flow rate was linear for the tested flow rates. We do acknowledge minor error in flow rate measurements originating from the accuracy of the intrusive flow meter. The error in the experimental measurements is accounted by the error bars as represented in the plots. Utilizing a Flow meter with greater accuracy can be used to obtain more accurate results for the calibration. Nevertheless, the result predicts a linear relation between the entities of concern in the given test performed.
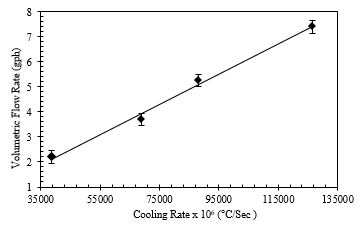 Figure 4: Cooling rates obtained from the code at various volumetric flow rates for inlet fluid temperature of 14° C
Figure 5 represents the relationship between volumetric flow rates through the sensor core and the associated cooling rates obtained from the code for inlet fluid temperature of 15° Celsius. Consistent with the earlier study for inlet temperature of 14° Celsius the cooling rate increases with the increase in volumetric flow rate through the aluminum core. Moreover, the coorelation between the entities for 15° Celsius was also linear. Suggesting cooling rate as defined earlier can be used as a good calibration factor to measure flow rates and velocity (from fluid properties and sensor geometry) in compact systems using a minimally intrusive method.
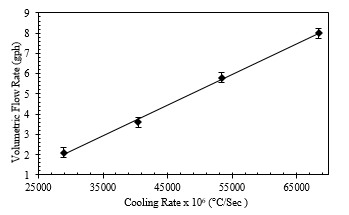 Figure 5: Cooling rates obtained from the code at various volumetric flow rates for inlet fluid temperature of 15° C
On comparison of the two plots presented, the cooling rates for the 14° Celsius inlet fluid temperature are higher than the 15° Celsius for a given volumetric flow rate. This can be expected as a colder fluid can extract more thermal energy from the aluminum core compared to a relatively warm fluid in a defined time interval. Therefore, the time required for a colder fluid to reduce the core temperature by 2° Celsius was smaller compared to a warmer fluid which results in a higher cooling rate (8). The correlation obtained for the two different fluid inlet temperatures were programmed back into the code and volumetric flow rates were measured using them. The relation produced accurate readings in both the cases.
The slope values calculated from the plots above for the 14° Celsius and 15° Celsius inlet fluid temperatures are 200 °C/sec/gph and 60°C/sec/gph respectively. If we compare the slopes of the two plots, it can be seen than the colder fluid (14° Celsius) has a smaller slope compared to the warmer fluid (15° Celsius) reconfirming the cooling rate was higher for a colder fluid compared with a warmer fluid. Analysis the slope valves, we can also observe that the slope values decrease with the decrease in the inlet fluid temperature. Knowing that the relation between the cooling rate and flow rate is linear for both the inlet fluid temperature and realizing that the cooling rate values at no flow condition will be same (i.e. small cooling rate at no flow condition defining the origin for the curves) for any inlet fluid temperature, we can define a single calibration factor or correlation by collecting adequate experimental data. The correlation can then be used to develop a single sensor that can identify volumetric flow rates for a broad range of inlet fluid temperature conditions.
5. Conclusion
We have developed a prototype sensor to measure volumetric flow rate and fluid velocity in compact flow systems using a minimally intrusive method for a defined inlet fluid temperature. The sensor was developed using an aluminum core that is heated and is allowed to be cooled by convective heat transfer produced by the fluid motion. The time associated with the aluminum core cooling was used to define the calibration factor and eventually flow rate. The linear relationship between the cooling rate and volumetric flow rate can be effectively exploited to develop a universal sensor that can measure flow rates for several different inlet fluid temperatures. The absence of any mechanical components or flow restrictors in the sensor’s measurement path prevents any volumetric flow rate modifications within the system. No flow restriction in the system from the sensor means the fluid driving mechanism (e.g. pumps & motors) can be efficiently used as it does not have to overcome the additional losses created by the presence of sensor restriction. Moreover, the sensor uses commonly available items making it extremely economical to fabricate and easy to assemble providing a significant advantage over expensive ultra-sonic, electromagnetic, Coriolis and other flow meters. However, we appreciate the fact that the response time of the system can be slow for extremely low flow rates and the sensors need to be calibrated for the operating temperature.
Conflict of Interest
The authors declare that there is no conflict of interests regarding the publication of this paper.
Acknowledgment
This work is supported by SMC Ltd. Product Design and Development, Twinsburg, Ohio. We thank our colleagues from Cerêve, Inc. who provided their novel fluid temperature regulating device that greatly assisted the research, although they may not agree with all of the conclusions of this paper.
- D. N. Ku, “Blood flow in arteries” Annual Review in Fluid Mechanics. 21, 399–434, 1997. https://doi.org/10.1146/annurev.fluid.29.1.399
- L. X. Yu, “Pharmaceutical Qulaity by Design: Product and Process Development, Understanding, and Control” Pharma Res., 25, 2463-2463, No. 10, 2008, https://doi.org/10.1007/s11095-007-9511-1
- S. Patel, D. Showers, P. Vedantam, T-R. Tzeng, S. Qian, X. Xuan “Microfluidic separation of live and dead yeast cells using reservoir-based dielectrophoresis” Biomicrofluidics, 6(3), 034102, 2012, https://doi.org/10.1063/1.4732800
- J. G. Santiago, S. T. Wereley, C. D. Meinhart, D. J. Beebe, R. J. Adrian, “A particle image velocimetry system for microfluidics” Experiments in Fluids, 25, 316-319., 1998, https://doi.org/10.1007/s003480050235
- H.A. Stone, A.D. Stroock, A. Ajdari, Engineering flows in small devices: “Microfluidics towards a Lob-on-a-Chip” Annual Review in Fluid Mechanics. 36:1, 381-411, 2004, https://doi.org/10.1146/annurev.fluid.36.050802.122124
- R. C. Baker, Flow measurement handbook, Cambridge University Press, 2016
- T. L. Bergman, A. S. Lavine, F P. Incropera, D. P. DeWitt, Fundamentals of Heat and Mass Transfer, 2011.