Economic and Social Sustainability for Iraqi Middle Provinces

Adv. Sci. Technol. Eng. Syst. J. 3(5), 447–453 (2018);
 DOI: 10.25046/aj030551
This research is part of a study concerned with building an integrated framework for development of sustainable urban planning in Iraqi provinces. Seven Iraqi middle provinces are covered in this study. The aim of the study is to determine, measure and evaluate economic and social sustainability in the Iraqi middle provinces. The stages to achieve this research were based on establishing a two levels hierarchy framework (a level for categories and a level for indicators). In this study, the Economic dimension comprised of 6 categories and 18 indicators and the Social dimension comprised of 8 categories and 41 indicators. Through using the Multi Criteria Analysis method and the Analytic Hierarchy Process, the Sustainability Index has been determined and used to measure and evaluate the economic and social sustainability in the Iraqi middle provinces
1. Introduction
More than 50% of the worldwide population live in urban or urbanizing areas. In just five years, we will add another people, all will need jobs, food, security and opportunity. Sustainable development have become imperative to meet their own needs. [1], [2]
Generally , sustainable development concept comprises of three aspects: economic, environmental and social. There are other sources that show other aspects: sustainability, aaccording to LA21, has four dimensions, namely: economic, environmental, social and governance or institutional aspects [3], shows that the three sustainability main dimensions, all located within the governance dimension that manages and controls these dimensions.
1.1. The economic dimension
It is considered as a base for development and any disruption of it or to the draining of its resources eventually will lead to the weakening of its future development opportunities, and then a long-term economic perspective must be taken to solve the problems in order to provide effort, money and resources [4].
1.2. The social dimension:
It is the right of a normal person in a clean and sound environment in which he can practice all activities while ensuring his right in a fair share of natural resources and environmental and social services, and investing it in order to serve his basic needs (shelter, food, clothing, air ….) as well as the complementary needs to raise his standard of living (business, entertainment, fuel ….) and without reducing the chances of future generations[4].
1.3. Indexes
An index is a synthesis of indicators or composite indicator. Formalization of an indicator that necessitates the aggregation of several data or variables results in. In the field of sustainable development, the use of indexes facilitates the interpretation and understanding of given phenomenon indicators, particularly for the public. Indexing offers an instrument for benchmarking performance and provides information to enable decision-making and directing development [5]. According to its specific goals, Indicators should tell us in what fields the city is doing better than in others, and a single sustainability index should tell us whether the city is becoming more sustainable or not. Based on an aggregation method, the index is then calculated [6].
Composite indicators development is considered to be a unique approach for sustainable development evaluation. Calculating aggregated values is one of the common methods for establishing indices. Depending on its application, composites indices can be established without or with weights [7].For developing mathematical sustainability index, the Methods used are:
2. Methods Used in the Developing Sustainability Index
2.1 The Analytic Hierarchy Process (AHP)
This method is most widely used Multi Criteria Decision Making method, as it presented a deriving priorities and structuring the decision problem logically and representatively. The use of pair-wise comparisons, in AHP method is, to compare the alternatives regarding to the various criteria and to assess weights of criteria” [8].
The comparisons and priority calculation of AHP pairwise are executed to get the relative weights for objectives, sub objectives, and measures on every level of criteria in the hierarchy [9]. Figure 1 describes the principal steps for achieve the AHP. Table (1) shows a preference scale using for comparison. Ref. [10] suggested using the following consistency index (CI) as in (1):
![]() Where
Where
CI: is the consistency index
λmax: is the largest Eigen value of matrix and
n: is the number of elements within a branch being compared.
This consistency index can also be expressed as a consistency ratio as in (2):
![]() where:
where:
CR: is the consistency ratio
RI: is a known random consistency index obtained from a large number of simulation runs and varies depending upon the order of matrix.
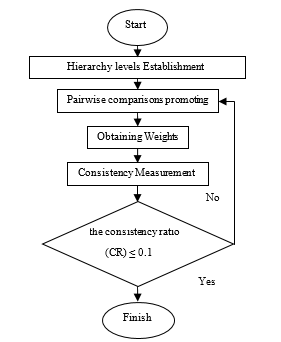 Figure 1 The principal steps for achieve the AHP [Researcher depending on [9]]
Table 2 shows the random consistency index values (RI) for matrices of order 1 to 10 obtained by approximating random indices using a sample size of 500[11].
2.2 The Geometric Mean [12]
Equation (3) or (4) is used to find geometric mean:
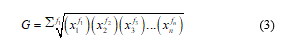
![]() Where, G: Geometric Mean
Where, G: Geometric Mean
xn: weights of each respondents’ number.
fi: respondents number for each weights.
n: ∑fi: the all respondent sum.
Table 1 Saaty Rating scale
| Explanation | Definition | Importance |
| Two elements contribute equally | Equal importance of both elements | 1 |
| Experience and judgment favour one element over another | Moderate importance of one element over another | 3 |
| An element is strongly favoured | Strong importance of one element over another | 5 |
| An element is very strongly dominant | Very strong importance of one element over another | 7 |
| An element is favoured by at least an order of magnitude | Extreme importance of one element over another | 9 |
| Used to compromise between two judgments | Intermediate values | 2,4,6,8 |
Table 2 Average random index according to matrix size [11]
| Matrix Size(n) | 1 | 2 | 3 | 4 | 5 | 6 | 7 | 8 | 9 | 10 |
| Random Index | 0 | 0 | 0.58 | 0.9 | 1.12 | 1.24 | 1.32 | 1.41 | 1.45 | 1.49 |
2.3 Analysis Grey Relational (AGR) [13]
(GRA) is a measurement method for discussing the consistency of discrete uncertain sequence and its target. It initiates by the original sequence factor creation, the measurement space factor using grey-relational generation, that is classified into three types:
- Smaller-the-better grey-relational generation: the minimum of the sequence factors is the ideal factor.
- Larger-the-better grey-relational generation: the maximum of the sequence factors is the ideal factor is.
- Nominal-the-better grey-relational generation: the one with the sequence factors target value in line is The ideal factor.
In grey relational generation, (5) used for normalized data corresponding to criterion, when Lower-the-Better (LB):
![]() Equation (6) used for the normalized data when Higher-the-Better (HB) criterion:
Equation (6) used for the normalized data when Higher-the-Better (HB) criterion:
![]() Where:
Where:
Xi(k): is the value of yi(k) after the grey relational generation,
min yi(k): is the smallest value of yi(k), and max yi(k): is the largest value of yi(k).
The purpose of Grey relational grade is to appear the relation degrees between the sequences say, [X0 (k) and Xi (k), i = 1, 2, 3…, n].
The purpose of using GRA, in this research, is to normalize the values of realistic indicators by using (6) as the research intends maximum sustainability (higher is better).
3. Developing Economic and Social Sustainability Index
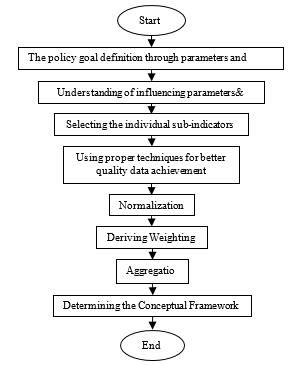 Figure 2: The Steps for establishing the framework of composite indicators [Researcher depending on [6]]
Reference [6] suggested steps for building the framework of composite indicators (index) as described in Figure 2. the steps for developing economic and social sustainability index in current study, are the following:
3.1. Developing Appropriate Sustainable Urban Framework
Reference [14] illustrated Developing three levels hierarchy Sustainable Urban framework for Iraqi cities (Dimensions, categories& indicators), as in Figure 3. This study deals with the economic and social dimension. Each dimension consists of two levels (categories level and indicators level). Six categories and eighteen indicators in The Economic dimension, and eight categories and forty-one indicators in The social dimension. the components for each dimension are shown in Table 3.
3.2. Determining Weightings Using AHP Method
Figure 4 illustrate the steps followed in the current research for determining framework components weighting by AHP method (Analysis Hierarchy Process).
The questioners used for finding the weight of categories, and indicators for economic and social dimension. The process of preparing questionnaire depends on research hierarchy framework and pair wise comparison. The questionnaire contains multiple issues and the answer accuracy needs a logical respondent with the following characteristics:
- Knowing about sustainability or urban sustainability.
- Involved in and active with projects and development of the governorate.
The researcher suggested to distribute at least (9) questionnaires for each governorate as in [15]. A list of the experts’ respondents and their other information is summarized in Table 4. The number of received questionnaire respondents varies from one province to another, and the highest number of questionnaire received is (9) as in governorate of Baghdad and Salah Al-Deen and the lowest number is (4) as in the province of Wasit.
After accomplishing categories and indicators pairwise comparisons by the specialists’ responses about the questionnaire, the aggregation for the individual judgments using the geometric mean as Saaty suggested in [16].
3.3. Determining Indicators Realistic Values
The researcher spent more than four months for collecting indicators realistic values for the study provinces. additional four months were needed for determining indicators values because of the difficulties to get fit value of indicator. The process of information gathering mainly depended on the Ministry of Planning / Central Statistical Organization & Information Technology (COSIT) in all its divisions, otherwise the values of indicators were obtained by other relevant ministries, authorities and departments, if information was unavailable. the process of determining values of indicators is as follows:
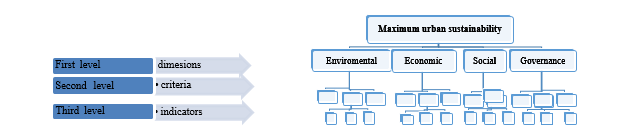 Figure 3: The hierarchy three levels Framework[Researcher]
Table 3: Economic and social sustainable framework component
| Code
code |
Details |
| 2. | The economic dimension
|
| 2.1 | The use of resources and energy |
| 2.1.1 | Electricity used per capita |
| 2.1.2 | Gasoline consumed per capita |
| 2.1.3 | Energy use per capita per year |
| 2.2 | Efficiency of economic development |
| 2.2.1 | Contribution of tourism to GDP |
| 2.2.2 | Investment share of GDP |
| 2.2.3 | Number of industrial projects |
| 2.2.4 | The share of government investment |
| 2.3 | Local government finance |
| 2.3.1 | Capital spending as a percent- age of total expenditures
|
| 2.3.2 | Spending on research and development as a percentage of GDP |
| 2.3.3 | Local government revenue |
| 2.4 | Services |
| 2.4.1 | Cost recovery |
| 2.4.2 | Loss in revenue as a result of power outages |
| 2.5 | Disasters |
| 2.5.1 | Percent of population living in areas at risk |
| 2.5.2 | Economic loss resulting from human and natural disasters |
| 2.5.3 | Safe design of the building of the topographic and geological |
| 2.8 | Economy population |
| 2.8.1 | Employment |
| 2.8.2 | Average family income |
| 2.8.3 | Per capita GDP |
| 3. | The social dimension: |
| 3.2 | Health |
| 3.2.1 | The proportion of the number of hospitals and health centers to the population |
| 3.2.2 | The proportion of the provision of potable water in urban areas, according to national standards |
| 3.2.3 | Hospital beds for every ten thousand people |
| 3.2.4 | rate of Mortality and birth |
| 3.2.5 | Number of doctors per capita |
| 3.2.6 | Access to sanitation facilities |
| 3.2.7 | Nutritional status of children |
| 3.2.8 | Immunization of children against disease infections |
| 3.2.9 | Prevalence of tobacco use |
| 3.3 | Education |
| 3.3.1 | The number of schools to population ratio |
| 3.3.2 | The number of researchers |
| 3.3.3 | Illiteracy rate for adults |
| 3.3.4 | Enrollment rates |
| 3.3.5 | The number of higher education graduates |
| 3.3.6 | The percentage of students who reach the fifth grade of primary education |
| 3.3.7 | The proportion of the number of students to teachers |
| 3.3.8 | The number of people who have graduated from junior high school career |
| 3.4 | Housing |
| 3.4.1 | Housing shortage |
| 3.4.2 | The dimensions of the deficit housing and shortage ;neighborhoods, slums |
| 3.4.3 | Rent-to-income ratio |
| 3.4.4 | Optional decent housing or authorized |
| 3.4.5 | Type of tenure |
| 3.4.6 | Random housing |
| 3.4.7 | Abandoned housing |
| 3.5 | Social development and poverty eradication |
| 3.5.1 | percent of population living below the poverty line |
| 3.5.2 | The proportion of poor women , children with special needs who do not have access to community facilities and services |
| 3.5.3 | Child labor |
| 3.5.4 | Death under the age of five suffer from malnutrition |
| 3.5.5 | The proportion low-birth weight infants
|
| 3.5.6 | The incidence of serious diseases |
| 3.6 | Violence and Crime |
| 3.6.1 | Violence in urban areas |
| 3.6.2 | Number of recorded crimes per 100,000 population |
| 3.7 | Urbanization and urban housing |
| 3.7.1 | The population growth rate |
| 3.7.2 | The number of families in one housing unit |
| 3.7.3 | Total net migration |
| 3.7.4 | The average household size for each family |
| 3.7.5 | The proportion of population living in urban areas |
| 3.8 | Culture of the community in sustainability |
| 3.8.1 | Public awareness of the population to hazardous substances and waste issues |
| 3.8.2 | Percentage of the population who have gardens |
| 3.9 | Household Spending |
| 3.9.1 | Household spending |
| 3.9.2 | Average savings per household |
- Some of the values were found directly.
- The researcher calculated some of these values with many equations and methods.
- Some indicators were calculated from some surveys that had a relationship to the indicators.
- Some indicators were new or that the relevant ministry responsible for providing the indicators values refused to provide the researcher with, so the researcher used an open interview questionnaire with Likert scale (i.e.,1: very low, 2: low, 3: medium ,4: high ,5: very high) to find its values.
- For the same reasons above, some of the economic indicators were found without monetary units.
- Some indicators included urban and rural regions together and some included urban only. In the first case, the indicator to be found was only for the urban through multiplication by the percentage of relevant urban in the governorate.
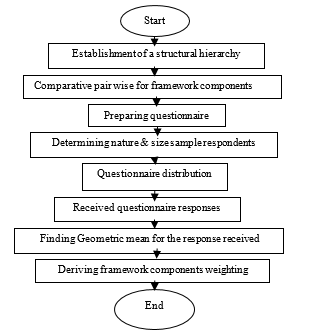 Figure 4: Flowchart for weighting framework components by
AHP method [Researcher]
Table 4: Summary the respondents’ information
|
provinces |
Diala | Al-Anbar | Baghdad | Babylon | Kerbela | Wasit | Salah ALDeen | |
| No. of respondents | 8 | 5 | 9 | 7 | 5 | 4 | 9 | |
| Certificate
|
B.A. | 2 | 0 | 0 | 0 | 2 | 2 | 3 |
| M.A. | 2 | 0 | 4 | 3 | 2 | 0 | 1 | |
| Ph.D. | 4 | 5 | 5 | 4 | 1 | 2 | 5 | |
| profession
|
Planner | 1 | 1 | 1 | 0 | 1 | 1 | 3 |
| Engineer | 4 | 1 | 1 | 1 | 2 | 2 | 1 | |
| Lecturer | 4 | 3 | 3 | 6 | 2 | 1 | 5 | |
| Years of practice | 10 to20 | 3 | 2 | 2 | 4 | 3 | 3 | 1 |
| more than 20 | 5 | 3 | 3 | 3 | 2 | 1 | 8 | |
3.4. Indicators Influence identifying on Sustainability
Table 5 illustrated the direction of indicators against sustainability.
Table 5: Signs of indicators against sustainability [Researcher]
| Signs of indicators | Means of the signs |
| – | If the indictor value increased lead to sustainability decreased. |
| + | If the indictor value increased lead to sustainability increased . |
3.5. Using Analysis Grey Relational for Normalization indicators values
Because of the indicators values were not the same each other units, the normalization was performed to obtain one unit for all values of indicators, additionally to obtain sequential in the indicators values.
Equation (6) was used for normalization indicators values, the limits of indicators values normalization are between (0-1).
3.6. Determining Dimension Sustainability Index (DSI)by Aggregation
The base for determining the economic and social sustainability Indices is the aggregation as in (7).
![]() Where:
Where:
DSI: Dimension Sustainable Index
Wc: Weight of Category c; Wi: Weight of Indicator i;
Xi: Normalized obtained of indicator value i in the study area;
Ai: 1 or -1, that depends on indicator i influence on sustainable; i: indicator Number for the category c;
c: categories Number.
4. Results
4.1. Categories and Indicators weight for Economic and Social Dimensions
Tables 6 and 7 show the weights and ranks of economic dimension categories.
It is clear from the table that the category(C2.1) ranking in two provinces is the second and fourth ranking and the highest weight in the Babylon province. the category(C2.2) ranking in two provinces is the first ranking and the highest weight in the Wasit province. The category(C2.3) ranking in three provinces is the first ranking and the highest weight in the Salah ALDeen province and sixth rank in two other provinces. The category(C2.4) ranking in three provinces is the first ranking and the highest weight in the Diala province .and second rank in two other provinces. The category(C2.5) ranking in three provinces is the sixth ranking and the highest weight in the Salah ALDeen province .and second rank in two other provinces. The category(C2.8) ranking in three provinces is the fifth ranking and the highest weight in the Diala province, third and fourth rank in two other provinces. Tables 8,9 and10 show the weights and ranks of social dimension categories.
It is clear from the table that the category(C3.2) ranking in three provinces is the first and the highest weight in the Kerbela province. the category(C3.3) ranking in two provinces is the first ranking and the highest weight in the Wasit province and second rank in four other provinces. the category(C3.4) ranking in two provinces is the fourth ranking and the highest weight in the Al-Anbar province and fifth rank in two other provinces.
the category(C3.5) ranking in two provinces is the third ranking and the highest weight in the Diala province and fifth rank in three other provinces. the category(C3.6) ranking in two provinces is the sixth ranking and the highest weight in the Salah ALDeen province and seventh rank in three other provinces. the category(C3.7) ranking in three provinces is the eighth ranking and the highest weight in the Al-Anbar province. the category(C3.8) ranking in two provinces is the third ranking and the highest weight in the Diala province and fifth rank in two other provinces. the category(C3.9) ranking in two provinces is the seventh ranking and the highest weight in the Baghdad province and eighth rank in two other provinces. Table 11shows the priority summary for economic and social dimension categories.
Table 6: Weights and ranks of economic dimension categories
| Category | C2.1 | C2.2 | C2.3 | |||
| Provinces | Rank | Value | Rank | Value | Rank | Value |
| Diala | 2 | 0.157 | 5 | 0.115 | 4 | 0.117 |
| Al-Anbar | 1 | 0.072 | 2 | 0.078 | 1 | 0.283 |
| Baghdad | 4 | 0.109 | 6 | 0.055 | 1 | 0.179 |
| Babylon | 2 | 0.177 | 1 | 0.199 | 6 | 0.030 |
| Kerbela | 4 | 0.148 | 3 | 0.159 | 6 | 0.074 |
| Wasit | 3 | 0.153 | 1 | 0.241 | 2 | 0.213 |
| Salah ALDeen | 6 | 0.072 | 5 | 0.075 | 1 | 0.238 |
Table 7: Weights and ranks of economic dimension categories
| Category | C2.4 | C2.5 | C2.8 | |||
| Provinces | Rank | Value | Rank | Value | Rank | Value |
| Diala | 1 | 0.181 | 6 | 0.080 | 3 | 0.132 |
| Al-Anbar | 2 | 0.273 | 6 | 0.065 | 3 | 0.086 |
| Baghdad | 2 | 0.178 | 3 | 0.122 | 5 | 0.093 |
| Babylon | 5 | 0.075 | 3 | 0.144 | 4 | 0.142 |
| Kerbela | 1 | 0.163 | 2 | 0.160 | 5 | 0.111 |
| Wasit | 1 | 0.163 | 6 | 0.037 | 5 | 0.053 |
| Salah Aldeen | 3 | 0.174 | 2 | 0.200 | 4 | 0.098 |
Table 8: Weights and ranks of social dimension categories
| Category | 3.2 | 3.3 | C3.4 | |||
| Provinces | Rank | Value | Rank | Value | Rank | Value |
| Diala | 4 | 0.115 | 2 | 0.148 | 6 | 0.107 |
| Al-Anbar | 8 | 0.068 | 4 | 0.111 | 2 | 0.169 |
| Baghdad | 1 | 0.160 | 2 | 0.149 | 5 | 0.135 |
| Babylon | 1 | 0.261 | 2 | 0.176 | 5 | 0.089 |
| Kerbela | 1 | 0.206 | 2 | 0.133 | 3 | 0.121 |
| Wasit | 3 | 0.132 | 1 | 0.220 | 4 | 0.128 |
| Salah Aldeen | 7 | 0.093 | 1 | 0.163 | 4 | 0.121 |
4.2. Economic and Social Sustainability Index
In the current research, many mathematical equations, Microsoft Excel program was used. Table 12 shows a sample of sustainability index calculations for the economic dimension of Diyala province in excel sheet: After making calculations, Table13 illustrate the values of each sustainability dimension index in the current research. Figures 5and6 illustrate economic and social index for each province in study area. In the economic dimension, Baghdad got the first ranking followed by Wasit, and Salah ALDeen got the last ranking followed by Babylon. As for the social dimension, Baghdad got the first rank followed by Babylon and Wasit got the final ranking followed by Diyala.
Table 9: Weights and ranks of social dimension categories
| Category | C3.5 | C3.6 | C3.7 | |||
| Provinces | Rank | Value | Rank | Value | Rank | Value |
| Diala | 1 | 0.153 | 5 | 0.109 | 8 | 0.077 |
| Al-Anbar | 5 | 0.094 | 6 | 0.083 | 1 | 0.200 |
| Baghdad | 3 | 0.143 | 7 | 0.066 | 8 | 0.037 |
| Babylon | 5 | 0.089 | 7 | 0.068 | 3 | 0.167 |
| Kerbela | 5 | 0.109 | 6 | 0.102 | 4 | 0.111 |
| Wasit | 2 | 0.139 | 7 | 0.060 | 6 | 0.074 |
| Salah Aldeen | 3 | 0.128 | 2 | 0.151 | 8 | 0.062 |
Table 10: Weights and ranks of social dimension categories
| Category | C3.8 | C3.9 | ||
| Provinces | Rank | Value | Rank | Value |
| Diala | 3.000 | 0.131 | 7 | 0.092 |
| Al-Anbar | 3.000 | 0.118 | 7 | 0.075 |
| Baghdad | 6.000 | 0.081 | 4 | 0.137 |
| Babylon | 4.000 | 0.105 | 8 | 0.036 |
| Kerbela | 7.000 | 0.097 | 8 | 0.076 |
| Wasit | 5.000 | 0.095 | 8 | 0.051 |
| Salah ALDeen | 5.000 | 0.113 | 6 | 0.113 |
Table 11: The priority summary for economic and social dimension categories.
| Economic Category priority | Social Category priority | ||
| Category | Rank | Category | Rank |
| C2.4 | 1 | C3.2 | 1 |
| C2.3 | 2 | C3.3 | 2 |
| C2.2 | 3 | C3.5 | 3 |
| C2.1 | 4 | C3.8 | 4 |
| C2.8 | 5 | C3.4 | 5 |
| C2.5 | 6 | C3.6 | 6 |
| C3.7 | 7 | ||
| C3.9 | 8 | ||
5. Conclusions
In general, Degree of sustainability dimensions of Iraqi provinces, was very low: and Baghdad province got first in the economic and social index maybe it’s because it is the capital. Salah ALDeen province got the last position in the economic index. Wasit province got the last position in the social index. The negative sign of the dimension index value means the sustainability was declined in that dimension. The economic index consisted of only one province with negative signal (Kerbela).
Table 12: A sample of economic sustainability index calculations of Diala
| Code | Wc | Ci | Wi | Xi | Ai | WiXiAi | CI |
| 2.1 | 0.157 | ||||||
| 2.1.1 | 0.416 | 0.026 | -1 | -0.011 | |||
| 2.1.2 | 0.200 | 0.001 | -1 | 0.000 | |||
| 2.1.3 | 0.384 | 0.016 | -1 | -0.006 | |||
| ∑ | -0.017 | -0.003 | |||||
| 2.2 | 0.115 | ||||||
| 2.2.1 | 0.228 | 0.000 | 1 | 0.000 | |||
| 2.2.2 | 0.211 | 0.049 | 1 | 0.010 | |||
| 2.2.3 | 0.377 | 0.028 | 1 | 0.011 | |||
| 2.3 | 0.117 | 0.021 | 0.002 | ||||
| 2.2.4 | 0.185 | 0.023 | 1 | 0.004 | |||
| 2.3.1 | 0.295 | 0.051 | 1 | 0.015 | |||
| 2.3.2 | 0.431 | 0.013 | 1 | 0.006 | |||
| 2.3.3 | 0.274 | 0.037 | 1 | 0.010 | |||
| 2.4 | 0.181 | 0.035 | 0.004 | ||||
| 2.4.1 | 0.439 | 0.016 | 1 | 0.007 | |||
| 2.4.2 | 0.561 | 0.006 | -1 | -0.003 | |||
| 2.5 | 0.080 | 0.003 | 0.001 | ||||
| 2.5.1 | 0.209 | 1.000 | -1 | -0.209 | |||
| 2.5.2 | 0.284 | 0.600 | -1 | -0.171 | |||
| 2.5.3 | 0.506 | 0.506 | 1 | 0.256 | |||
| 2.8 | 0.132 | -0.124 | -0.010 | ||||
| 2.8.1 | 0.184 | 0.084 | 1 | 0.015 | |||
| 2.8.2 | 0.494 | 0.282 | 1 | 0.139 | |||
| 2.8.3 | 0.323 | 0.065 | 1 | 0.021 | |||
| 0.176 | 0.023 | ||||||
| DI | 0.018 |
Table 13: The values of economic and social index
| Provinces | EconomicIndexDI2 | Social IndexDI3 |
| Diala | 0.018 | -0.116 |
| Al-Anbar | 0.02 | -0.062 |
| Baghdad | 0.202 | 0.092 |
| Babylon | 0.003 | 0.084 |
| Kerbela | -0.008 | 0.005 |
| Wasit | 0.046 | -0.128 |
| Salah ALDeen | -0.014 | -0.044 |
The social index consisted of four provinces with negative values (Wasit, Diyala. Al-Anbar and Salah ALDeen). The dimension sustainability indexes (DSI) were varied from one province to another because of the index value depends on the categories and indicators weights and the indicators realistic value where the weights are based on the nature of region and the opinions of experts while the indicators realistic value depend on several things, as the following:
- The difference in topography and geography of the region, which contributes to different capacities.
- The difference in population density in each province, which affects the distribution of economic projects and development plans.
- The direction of the longitudinal transport is determined along the Tigris and Euphrates rivers, neglecting the horizontal transport, which affects the distribution of economic projects and development plans in the study provinces in addition to the other aspects (environmental and social).
- The priorities of the governorate determined by the central and local governments in the province.
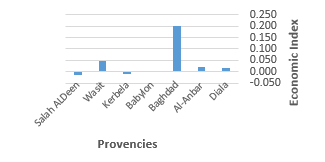 Figure 5: Economic indexes for each province in study area
 Figure 6: Social indexes for each province in study area
Conflict of Interest
There is many conflict such as respondents sample characteristics as mentioned in Section (3.2) are rare and if we find them, they will be very busy, so the researcher did the following steps for questionnaire distribution:
- Traveling for each governorate,
- Selecting most of the respondents,
- Distributing at least (9) questionnaires for each governorate, and
- Attending an open interview with respondents to ensure the understanding of questionnaire and to insuring the consistency of answers
Acknowledgment
I would like to thank Prof., Dr. Angham Ezzulddin Ali in the Department of Civil Engineering / University of Baghdad, Prof Dr. Mohammed Al-Quraishai and Dr. Abdul Wahab Ahmed at Urban and Regional planning centre /University of Bahadad, Prof. Dr. Numan Hussain and Prof. Dr.Sabah Faihan at Tikrit University ,Prof. Dr. Mohammed Yuosif at Diala university ,Prof.Adel Nuhair,Asst. Prof. Dr.Thair Shakeer at A-Anbar University , Dr.Azhar Hussain ,Dr.Mohamed Al-Said ,Dr Maher, Miss Huda Hadawi, Miss Ban and all the head of the departments at the Central Statistical Organization and Information Technology at the Ministry of Planning, and other Professors for their support and scientific assistance throughout this study. Great thanks to all persons including the esteemed professors, officials and engineers who gave me all the help and support in the universities and governmental institutions in the governorates.
- Portland State University, Twelfth International Conference on Environmental Cultural, Economic & Social Sustainability “Urban Sustainability – Inspiration and Solution”, Portland State University | Portland, USA, 2016.
- Environment Management Group Wang, A Framework For Advancing Environmental And Social Sustainability In The United Nations System, United Nations, Geneva, 2012.
- Spangenberg, J.H). “The changing contribution of unpaid work to the total standard of living in sustainable development scenarios”. Int. J. Sustainable Development, 5(4);461–475,2002.
- سـلیمان مھنا, ریدة دیب ,التخطیط من اجل الاسـتدامة ,مجلة جامعة دمشـق للعلوم الھندسـیة ,الم2009, 1 العدد 25
- Hsiang-Hsuan Chih, Yu-En Lin & Pin-Huang Chou, “Disposition Effect, Escalation of Commitment and Mutual Fund Performance”.Management Review methodology,28 (4); 103-107, 2009.
- Tanguay, G. Rajaonson, U., Lefebvre, J.F., Lanoie, P.,” Measuring the Sustainability of Cities: A Survey-Based Analysis of the Use of Local Indicators”. Ecological Indicators;10: 407-418,2009. Available on www.cirano.qc.ca /pdf/publication/2009s-02.pdf .
- Singh, R.K., Murty, H.R., Gupta, S.K., Dikshit, A.K., “An overview of sustainability assessment methodologies”. Ecological Indicators , 15; 281–299,2012.DOI of original article:10.1016/j.ecolind.2008.05.011. E-mail address: singh@pe- international.com (R.K. Singh). (Meadows, 1998). 1470-160X/$ – see front matter © 2011 Elsevier Ltd. All rights reserved. doi: 10.1016/j.ecolind.2011.01.007.
- Loken, E. . Use of multi-criteria decision analysis methods for energy planning problems. Renewable and Sustainable Energy Reviews, 11(7): 1584-1595,2007.
- Kendrick, J. D. &Saaty, D., “Use Analytical Hierarchy Process For Project Selection”. ASQ Six Sigma Forum Magazine, 6(4); 22-29 ,2007.
- Saaty, T.L.. A scaling method for priorities in a hierarchichal structure. Journal of Mathematical Psychology, 15, 234–281,1977.
- Saaty, T.L. . Fundamentals of the Analytic Hierarchy Process, RWS Publications, Pittsburgh, PA,2000.
- محمد أماني موسى , “التحلیل الإحصائي للبیانات “. مركز تطویر الدراسات العلیا والبحوث، كلیة. 2007 الأولى الطبعة، القاھرة جامعة، الھندسة .Available in www.capscu.com.
- Lin, S.T., Horng, S.J., Lee, B.H., Fan, P., Pan,Y., Lai, J.L, Chen, R.J and Khan,M.K..“Application of Grey-relational Analysis to Find the Most Suitable Watermarking Scheme”, International Journal of Innovative Computing, Information and Control,7(9): 5389-5401,2011. ICIC International 2011 ISSN 1349-4198
- Mansor, M. A.& Mohammed ,S. R. “Developing Sustainable Urban Planning Indicators Framework for Iraqi Cities by Using Content Analysis and Delphi Method” International Journal of Modern Sciences and Engineering Technology (IJMSET)ISSN 2349-3755; Volume 2, Issue 3, pp.46-56, 2015.
- Akadiri,O.P., “Development of a Multi-criteria Approach for the Selection of Sustainable Materials for Building Projects”. Ph.D. thesis, School of Engineering and the Built Environment, University of Wolverhampton, UK ,2011.
- Saaty, T.L., “Decision Making for Leaders: The Analytic Hierarchy Process for Decisions in a Complex World”. RWS Publications, Pittsburgh, 2001.
No related articles were found.