Modified HOG Descriptor-Based Banknote Recognition System

Adv. Sci. Technol. Eng. Syst. J. 3(5), 354–364 (2018);
 DOI: 10.25046/aj030541
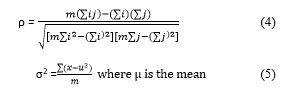
This survey paper deals with the structural health monitoring systems on the basis of methodologies involving intelligent techniques. The intelligent techniques are the most popular tools for damage identification in terms of high accuracy, reliable nature and the involvement of low cost. In this critical survey, a thorough analysis of various intelligent techniques is carried out considering the cases involved in civil structures. The importance and utilization of various intelligent tools to be mention as the concept of fuzzy logic, the technique of genetic algorithm, the methodology of neural network techniques, as well as the approaches of hybrid methods for the monitoring of the structural health of civil structures are illustrated in a sequential manner.
1. Introduction
Technological advancement has made life more comfortable, but it also has its downside as criminals have taken advantage of this progression. Initially, only printing houses had access to the technology needed to produce banknotes but today with the aid of a personal computer and a good laser printer people can duplicate paper money easily in their residence. Banknote counterfeiting is one of the core crimes on earth. The Apex bank of every country is responsible for providing the security features and in Nigeria it is the responsibility of the Central Bank of Nigeria (CBN). Every Nigerian banknote contains several security features that can be used to identify and recognize different note denominations [1].
Over the years, differentiating between fake and real currency banknotes has become quite tricky due to the fast-scientific progress in color printing, cloning, and imaging and because fake notes are now reproduced via top-notch technology that uses security paper [2]. In the same view, counterfeit banknote detection has become an essential task in billing machines. Its implemented by using image analysis methods (transmittance analysis, reflectance analysis) with different light spectra (visible, infrared and ultraviolet). The drawback of this system is its high cost and its usage with only Automated Teller Machines (ATM), where an elevated level of reliability is required. Anti-counterfeiting banknotes security features can be classified into three categories: printing, ink and substrate features. Printing features like intaglio printing, micro letters, serial number, signatures, Guilloches, Ink features such as UV glowing ink, pearl ink, infrared ink, color-shifting inks, and substrate features like planchets, security thread, see-through registers, and watermark [3].
This research presents a paper money recognition system that includes multiple banknote identifications and Counterfeit note detection that could aid in reducing banknote counterfeiting offenses and positively influence a country’s economy. The rest of the article is divided into the following sections: Section 2 discusses the research background and surveyed literature. In Section 3, the proposed system including its architecture, design, and stages of the approach is studied. Section 4 debates the analysis and discussion of the results of the system functionality, and the conclusion of the research and future work is given in Section 5.
2. Background & Literature Survey
Banknotes are utilized in every business venture in as much as electronic currencies is becoming identified as a substitute legal tender, the note is still dominant and central in the day to day dealings. Currency Recognition and detection is a critical problem in computer vision. Although, electronic and online currencies exist banknote is still the preferred option in daily transactions such as vending machine, the banking system, banks, shopping mall, railway ticket counter, ATM, vending machines, and currency exchange service. Furthermore, there are cases of money bundles withdrawn from ATMs contained a few counterfeit bills although banks are unwilling to accept these omissions. Even though this problem is majorly unavoidable, they are not also able to provide all branches with the needed counterfeit detection system [4].
One of the most straightforward methods that have been applied in paper money recognition system is the use of visible features found in notes like the size, texture, and color of banknotes. All banknotes have pictures and patterns impressed on them, such as portraits of historical persons or images of landmark buildings which are characterized as textures extracted as features using texture-modeling techniques. The drawback of this approach is that banknotes are mistreated so could get damaged and torn due to regular use leading to alteration of the notes thereby hurting the recognition rate [5]. On the other hand, [6] extracted the geometric features (length and width) and employed it in classifying bills with varying sizes such as Italy and Chinese banknotes. Although, this approach was simple and fast; it had significant limitations including its effectiveness for slant, stain, and tear. Furthermore, it was unsuitable for some banknote such as the US Dollars, which had several denominations of the same size.
Furthermore, many countries employ colors for differentiating banknotes although they could wear or tear it still retains its color [7]. [8] designed a system that identified the denomination of the Indian currency note based on its color. Likewise, another author also developed a technique that converted the image from RGB color space to HSV color space and then extracted the color feature. Their justification for employing the HSV color space was because of its nearness to the human conceptual understanding of color [9]. Additionally, a researcher recommended an approach based on characteristic point extraction of a unique part of the Euro paper currency that possesses the same color has also been conducted [10]. Similarly, [11] devised a US banknote counterfeit detection system that extracts its color feature and classifies the currency using fuzzy Hamming distance. Despite its high performance, if the system were tested on Euro banknotes. It would not be able to detect forgeries since its detection is based only on the color feature. Most countries have different colors distributed over the surface of its banknotes including the Nigerian Naira; all have only one dominant color. For instance, the dominant color of 10 Naira note is “Red.” Although, some banknotes have the same dominant color due to wear and tear the color quality may degrade; hence leading to difficulties in using the color feature for automatic recognition. Also, using only the color as a discriminative feature may fail because some banknote denomination does have the same dominant color [12].
Likewise, [13] proposed a banknote classification technique based on discrete real-valued wavelet transform (DWT), they calculated the feature vector using the statistical properties of decomposed coefficients from the approximation and detail sub-bands. The technique was applied successfully in spatial and frequency domain, although it does not shift invariant and has no phase information. Another researcher also devised a new method called a hyper-complex wavelet transform (CWT) that is shift invariant and has a single phase. However, it also had its limitation like its ambiguity when used for 2-D signals [14]. Furthermore, an invariant shift extension of DWT and CWT called the quaternion wavelet transform (QWT) was also adopted. The technique had three phases and one magnitude, the first two stages were on the local image shifts, and the third focuses on image texture information [15]. [16] also suggested a new feature extraction system using the quaternion wavelet transform (QWT) that combined the partial and total Hilbert Transform (HT) using quaternion algebra to form one magnitude and three phases. It captures the statistical characteristics of QWT coefficients using the generalized Gaussian density (GGD) and classifies the banknote using the neural network. Furthermore, [17] presented a banknote recognition system that used a wavelet transform for extracting features and classified the features using Multi-layer perceptron (MLP) neural network; the method experimented on Persian paper currency. In another research work, a feature extraction technique was developed based on the Discrete Wavelet Transform (DWT). They employed Daubechies 1 (DB1), and the approximate coefficient matrix of the transformed image is extracted from the estimated efficient model and used for recognition, classification, and retrieval of currency notes [18].
Additionally, [19] formulated an approach that uses the edge and corners of an object in detection, the system was invariant to image rotation but was not able to handle issues associated with image scale. [20] then presented another technique that could automatically determine the scaling of the objects, it computed the Hessian matrix and used the Laplacian operator to locate the block like feature points in the image. Similarly, [21] also conducted further research on automatic scaling selection and implemented a Harris-Laplace detector in addition to the Hessian-Laplace to improve the automatic scale selection process. [22] also developed a SIFT method that finds the limits of the scale space in an object. The technique was invariant to scale and rotation and was very useful in extracting interest point descriptors which can be utilized in matching and classifying objects. [23] devised a method for the classification of Slovak banknotes based on SIFT detector and descriptors. Although, the approach posed its issues which were its computational complexity leading to high processing time limiting its acceptability in real-time applications.
In the same view, [24] also developed a colored SIFT approach that combines the color feature and the geometric data using the SIFT algorithm. The Mikolajczyk and Schmid framework was further applied to normalize introduced a nonlinear SVM method that juxtaposed images of different color space in addition to combining color space descriptors to evaluate the accuracy of the approach [25]. On the other hand, speeded up robust features (SURF) was created, the process was designed to improve on the SIFT method, the procedure retains the robustness of SIFT but with a decreased descriptor size and shorter processing rate and time.
SURF is also an interest point detector that is robust to scaling and rotation. It creates a unique, repetitive and vigorous process for capturing the interest points. The technique creates an integral image and uses it in place of the original image to diminish the processing time. It then uses the Hessian matrix to detect the highest and lowest second derivative value after this is achieved the interest point orientation is detected and rotated to align with the orientation of the predefined direction to complete the SURF descriptor creation [26]. A researcher applied SURF descriptor in
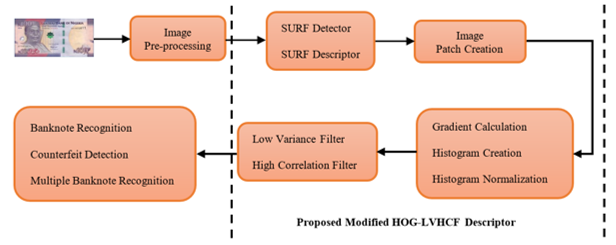 Figure: 1. Proposed Modified Hog-LVHCF based Banknote Recognition System
banknote recognition; the system was used to match reference regions with query images. It presented promising results and was robust to handle partial distortions as well as worn or wrinkled bills [27].
3. Proposed Methodology
In this research, we implemented a procedure for enhancing and cleaning up banknote images. It involves converting to grayscale then employing Gamma Correction and Histogram equalization to improve the image luminance and contrast of the intensity image. Furthermore, Weiner filter was applied to reduce the amount of noise after that the boundaries of the banknote are computed using Blob detection, cropped out and Gaussian pyramid utilized in standardizing the note. We also created a new feature set by extracting the Histogram of Gradient (HOG) Descriptors from image patches generated from the vertices of SURF interest points. After the HOG features have been obtained, the vector size may differ for each image in addition to being computationally demanding during processing. To minimize its effect on recognition/detection rate while maximizing the reduction of Feature dimensionality. A combination of dimensionality reduction techniques based on the descriptor correlation and variance is applied to reduce the Vector scale. A descriptor filter analysis using Pearson’s Product Moment Coefficient ρ and variance σ2 is employed to determine the best set of features for classification.
The approach answers two fundamental questions, determining the relevance of the descriptor to the feature set and its redundancy regarding other associated descriptors. Finally, we applied our technique to several datasets using OVO-SVM and Putative point matching to investigate the efficiency of the descriptor showing the effectiveness of Modified HOG/LVHCF descriptor for banknote identification, counterfeit detection, and multiple notes recognition. Figure 1 shows the phase of the proposed Modified Hog-LVHCF based paper money recognition system.
3.1. Image Pre-processing
During image acquisition, the irrelevant background image is also captured. This unwanted information must be removed to identify and recognize the notes. Furthermore, digitized banknote images sometimes have discontinuous particles, noise, illumination, positioning, and unanticipated boundaries. Also, when matching the image, if the banknotes are of varied sizes it could affect the recognition rate. In this research, image pre-processing plays a fundamental step as it involves enhancing and cleaning up the images for efficient feature extraction. Thus, in this research, a new combination of techniques for image pre-processing is presented, and a flowchart of the procedure is shown in Figure 2.
Step 1: The image was first converted to grayscale by calculating the weighted sum of the three channels of the RGB image and representing the result as a matrix whose fragments are assigned values based on how dark or bright the color of the pixel is at the corresponding position. The value allocated to the pixel during grayscale conversion ranges from 0 to 255 representing the brightness of the image.
Step 2: Gamma Correction was applied to improve the image luminance by enhancing the quality of the image in dark or blurry areas while also compressing the intensity of bright regions.
Step 3: Histogram equalization was then employed in enhancing the contrast of the intensity image, the approach redistributes the image histogram to ensure that the brightness value is constant across the image.
Step 4: Weiner filter was applied to reduce the amount of noise present in a signal comparing with an estimate of the desired noiseless signal.
Step 5: Background subtraction was also achieved by first finding all blobs in the image using Blob detection, select the boundary coordinates of the blob containing the banknote and cropping out the note using the detected blob edges.
Step 6: Banknote denominations sometimes are of varied sizes, and the note can also change due to the acquisition manner thus image reduction and standardization were achieved using the Gaussian pyramid.
3.2. Feature Extraction (Proposed Modified HOG Descriptor)
Feature extraction is a crucial step in image processing, the selection of features is vital in determining the recognition of an object, and an ideal feature set should be stable, invariant to rotation, scale, and illumination changes. Several feature
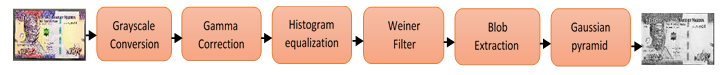 Figure 2: Block diagram of the procedures undergone in the Image Pre-processing
extraction methods have been proposed over the years. In this research, several useful descriptors and feature reduction approaches were investigated and compared to the proposed Modified HOG descriptor and Low Variance High Correlation Filter. In this study, six different descriptors were employed: Scale Invariant Feature Transform, speeded up robust features, gradient location and orientation histogram, Histogram of Gradient, shape context, and the proposed Modified HOG Descriptor. While to reduce the processing time several feature reduction methods were also implemented: Principal Component Analysis, Bag of Words, High Correlation filter, Low Variance Filter, and compared to the developed Low Variance and High Correlation Filter Algorithm. The proposed Modified HOG based descriptor technique is split into four phases: SURF point detection, SURF descriptor extraction, image patches creation from SURF points, and HOG feature computation.
3.2.1. SURF Point Detection
The SURF interest point detection is separated into four phases: integral image generation, calculation of the matrix, construction of the scale space and localization of the feature point.
Integral Image Generation: The Integral image generation was introduced to reduce the computational complexity of the square like convolution filters used in the future, it is mapped from the original image. The integral image is then computed by the sum of all pixels in the input image I within a given rectangle sector which can be deduced by Equation 1.
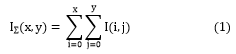 After the integral image has been calculated, three additions are carried out to compute the summation of the intensities over any four-sided vertical area consequently the computational time is not dependent on the image size using Equation 2.
![]() Computation of the Hessian Matrix: The box filters are used as an approximation of the second-order Gaussian derivatives, this is computed on the integral image calculated earlier rather than the actual image hence reducing the processing time. A 9×9 square-like filter was employed in the computation of the Gaussian denoted by with a scale of 1.2 which led to the creation of a blob response map over different scales in the image. A set of simple weights w were applied to the square-like sector to reduce the computational overhead.
Computation of the Hessian Matrix: The box filters are used as an approximation of the second-order Gaussian derivatives, this is computed on the integral image calculated earlier rather than the actual image hence reducing the processing time. A 9×9 square-like filter was employed in the computation of the Gaussian denoted by with a scale of 1.2 which led to the creation of a blob response map over different scales in the image. A set of simple weights w were applied to the square-like sector to reduce the computational overhead.
Construction of the scale space: The SURF approach is scale invariance, it applies the same filter at different sizes to the image at the same speed in parallel. The length of the dark lobe can only be increased by an even number of pixels to guarantee the presence of a central pixel (top). The scale space is categorized as a series of octaves; an octave is a set of filter response maps gotten by convolving each input image with a filter in different sizes. For an octave layer with a size N * N, the scale , the convolution of each layer in the image is computed on the response map using equation 3.
![]() Localization of the interest point: The final step in the interest point detection is localizing the image over the different scales, a threshold is set for removing weak responses in the map. Several thresholds are checked until a middle ground is reached that takes into consideration the number of interest points and the strength of the detected interest point. Furthermore, a 3-dimensional scale space is applied to the non-maximum suppression, and only points bigger than all the neighbors is selected as the given interest points. Finally, scale space interpolation is applied to obtain the best interest points [28].
Localization of the interest point: The final step in the interest point detection is localizing the image over the different scales, a threshold is set for removing weak responses in the map. Several thresholds are checked until a middle ground is reached that takes into consideration the number of interest points and the strength of the detected interest point. Furthermore, a 3-dimensional scale space is applied to the non-maximum suppression, and only points bigger than all the neighbors is selected as the given interest points. Finally, scale space interpolation is applied to obtain the best interest points [28].
3.2.2. SURF Descriptor Extraction
SURF Descriptor computation is divided into three phases: Assignment of the interest point orientation, Computation of the descriptor using Haar Wavelet transform and Feature matching using Fast Indexing.
Assignment of the interest point orientation: Assignment of Interest points orientation is needed to attain rotation invariance, so Haar Wavelet transform is used at each interest point (x, y) to determine the direction of a circular neighborhood in addition to its scale. After computing the wavelet transform the feature point is weighted using a Gaussian filter, the dominant orientation is decided by calculating the summation of all the horizontal and vertical responses within the sliding windows; the most extended vector is then selected as the local orientation vector for the feature point.
Computation of the descriptor using Haar Wavelet transforms: The previous step used a box area centered around the point of interest in determining the orientation. In this phase, each sector is further divided into a 4×4 square like sector, to improve the reduced the geometric distortions, and localization inaccuracies that could occur the interest pointed are first weighted with a Gaussian filter then the Haar wavelet transform is calculated horizontally and vertically for each 5×5 paced interest points. Furthermore, the computed wavelet transform is then summed for each sector and use as the first level entry in forming the feature vector set. Moreover, to capture the change in intensity after each interest point the absolute value of the responses is also computed to create a 4-dimensional descriptor vector for each sub-sector. Finally, the sectors which are made up of a 4×4 sub-sector is concatenated resulting in a descriptor with a length of 64 dimensions.
Feature matching using Fast Indexing: This phase presents an additional functionality to the matching stage, it uses a fast indexing technique based on the previous computed Laplacian in the Haar wavelet transform stage. The Laplacian value can be used to differentiate lighter blobs on darker areas from darker blobs in brighter areas. Hence, used in removing features that do not share the same type of contrast thus reducing unstable interest points from the feature vector set thus reducing the processing time and as the Laplacian has already been calculated earlier it to does not add any extra computation overhead. Figure 3 presents SURF point descriptors of sample USD and CAD paper money.
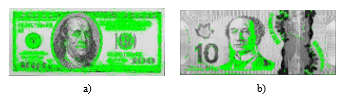 Figure 3. Detected SURF descriptors of a) the US, and b) Canadian Dollar
3.2.3. Creation of Image Patches
An image patch is designed from polygons defined by the coordinates of its vertices; it consists of one or extra polygons that might or might not be connected. In this research, the 43 x 43 patch is formed by specifying the coordinates of each unique vertex of the SURF square-like descriptors and a matrix that defines how to connect these vertices to create the faces. This technique is preferred for SURF points as its patches multifaceted, so vertices shared by more than one face need be defined only once thereby requiring fewer data to design the patches.
3.2.4. HOG Descriptor Computation
Histogram of Gradient (HOG) feature is a viable feature extraction technique with the ability to select feature points irrespective of the banknote image view. It is based on the histogram of pixel gradients neighbors for image sections or blocks thus it is hardly affected by changes in lighting conditions or image geometry. The HOG feature extraction technique can be grouped into three main stages: Calculation of Gradient for each pixel, computing its Histogram and by combining the histogram of all cells in a block to normalizing the histogram [29].
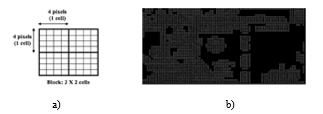 Figure 4. (a) Cell and block module (b) Sample HOG on Naira note
The feature depicts the gradient dispersion on the different positioning of a banknote image and is conducted to obtain the dimension and texture feature of the banknote. The HOG algorithm partitions all note image into small evenly-dimensioned sections called cells comprise several pixels which individually have a weight computed by getting the gradient magnitude and histogram. The histogram shows the dispersion of the pixel taking into cognizance the orientation of the gradient. Cell histogram is offered as a vector that is merged to get the HOG feature of the overall banknote image [30]. Figure 4 shows the terminology of the HOG feature extraction. Finally, Table 1 shows the HOG method specification that provided the best result in this research. The Cell size of 16, four cells per block, 1 to 1 block overlap, nine bins, and 18×1 bin centers. The number of HOG feature is different for each Dataset because it is chosen based on the feature size that presented the best recognition and detection rate.
Table 1. Specification of the HOG Descriptor
| Specification | Naira | USD | CAD | Euro |
| SURF Descriptor | 124864 | 196240 | 209002 | 205855 |
| Cell Size | 16 | 16 | 16 | 16 |
| Number of cells per block | 4 | 4 | 4 | 4 |
| Block Overlap | 1,1 | 1,1 | 1,1 | 1,1 |
| Number of bins | 9 | 9 | 9 | 9 |
| Number of HOG extracted | 38102 | 56109 | 76464 | 70136 |
| Bin centers | 18 x 1 | 18 x 1 | 18 x 1 | 18 x 1 |
3.3. Feature Reduction (Proposed LVHCF)
After the HOG features have been extracted, the vector size is computationally demanding. Therefore, to unify and reduce the feature dimension; the techniques aim to minimize its effect on recognition/detection rate while maximizing the reduction of Feature dimensionality. The experiment conducts a descriptor filter analysis using Pearson’s Product Moment Coefficient ρ and variance σ2 to determine the best set of descriptors for classification. The technique answers two fundamental questions: determining which descriptor is relevant or not to the feature set and if the descriptor is redundant or not concerning other related descriptors.
 The first question can be answered by just defining a threshold ρ value, but for the second question it is more complicated as it involves analysis of pairwise correlations between all descriptors. To answer both questions before filtering the descriptors we put forward an approach called a Low Variance and High Correlation Filter (LVHCF). In this experiment, it is assumed that if two descriptors are found to be redundant to each other one of them needs to be removed and removing the one that is less relevant to the descriptor-set concept keeps more information to predict the class while reducing redundancy in the data.
Table 2. Feature Reduction on Datasets
| Technique | Naira | USD | CAD | Euro |
| PCA | 680 | 740 | 690 | 755 |
| BOW | 600 | 650 | 650 | 670 |
| LVF | 1905 | 2805 | 2293 | 3507 |
| HCF | 1143 | 1685 | 2294 | 2104 |
| LVHCF | 581 | 661 | 764 | 701 |
As presented in Figure 5, given a dataset with M feature set and a descriptor set ds, the algorithm chooses a list of predominant descriptors Dbest for a given ds. It comprises two phases, the first phase (line 2-17) computes the Pearson correlation moment coefficient p for all pairs of descriptors in the ds using equation 1, extracts relevant descriptors into S1ilist based on the predefined threshold t1. The S1ilist is further processed to remove additional correlated pairs and only keeps predominantly uncorrelated Dq and Dp among all the earlier selected descriptors in the S1ilist (line 13). After one round of filtering all Dq pairs based on Dp, the algorithm will take the currently remaining feature right next to Dp as the new reference (line 18) to repeat the filtering process. The algorithm stops until there is no more feature to be removed from S1ilist. In the second phase (line 19 – 38), the variance σ2 of
Input: S (D1, D2, …, Dm, ds)// training dataset
t1 = 0.287 // a predefined threshold (ρ)
t2 = 0.045 // a predefined threshold (σ2)
output: Sbest // an optimal subset
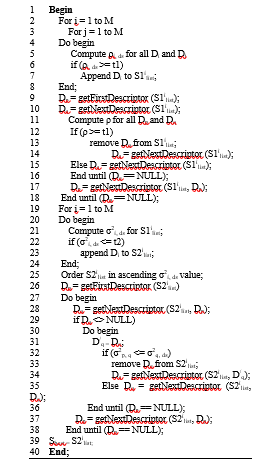 Figure 5. Low Variance and High Correlation Filter (LVHCF) Algorithm
each descriptor in the S1ilist is gotten using equation 2. Furthermore, the descriptors are extracted into a new list S2ilist based on the predefined threshold t2 and ordered in ascending order according to their σ2 values. The list is further processed to remove redundant descriptors and only keeps predominant ones among all the selected relevant descriptors. A descriptor Dp that has already been determined to be dominant can always be used to filter out other features that are ranked higher than Dp and have Dp as one of its redundant σ2 peers. The iteration starts from the first descriptor in S2ilist (line 26) and continues as follows. For all the remaining descriptors, if Dp happens to be a redundant peer to a feature Dq, Dq will be removed from S2ilist. After one round of filtering descriptors based on Dp, the algorithm will take the currently remaining descriptors right next to Dp as the new reference (line 37) to repeat the filtering process. The algorithm stops until there is no more feature to be removed from S2ilist. The descriptors matching the variance remaining in S2ilist is then used as the final dataset Best. Table 2 presents the feature reduction on the four datasets.
3.4. Classification
The classification stage is the decision segment of a recognition system, and it uses the features extracted in the previous phase. It involves identifying each banknote and assigning it the correct denomination class. Furthermore, the principal function of a pattern recognition system is to yield decisions concerning the class membership of the models with which it is confronted. Support Vector Machine (SVM) is a classification approach used for separating hyperplanes, it was designed in the 1990’s for building nonlinear separating function, and real-valued estimation [31].
The Multi-Class SVM-based system uses a binary classification approach for the one versus one technique, it designs a classifier for each class and creates a hyperplane between the classes. Furthermore, the system assigns a class to a test sample based on a distance margin for the classes. Each data set is split into two groups, the training, and test groups. The system used a randomized approach for data selection, and the class of the test data was predicted based on the established class of the training mechanism. The Multi-Class SVM has two application method approaches; One Versus All (OVA) method and One Versus One (OVO) method. OVA differentiate one class from the remaining classes, and the OVO distinguishes each class from one class at a time while ignoring the remaining class [32].
For this research, the system used the OVO technique in combination with error correcting output codes. The error correcting output code divides a Multi-Class scheme into a double class system that constructs a classifier for each binary division. OVO technique compares all classes against each other and builds a binary classifier to distinguish each pair of class while ignoring the remaining classes. When classifying an unknown image to a class, the classifier conducts a vote, and the class with the highest majority is selected as the best choice to assign the banknote [33]. Further analysis was conducted using K-Nearest Neighbor (KNN), Weighted K-Nearest Neighbor (WKNN), Random Forest (RF) Decision Tree, and multilayer perceptron (MLP) Neural network. In conclusion, it is hard to decide which classification method is the best as research has only been able to prove that a classifier could have a higher recognition and detection rate than others based on a specific problem.
4. Result & Discussion
This system was implemented in MATLAB as its toolbox provides built-in support for SIFT, SURF, HOG, GLOH in addition to the several classifiers. The hardware utilized comprised of a Core i3, 2.4 GHz processor with 4 GB Ram, the operating system used was Windows 8.0 64Bit and image processing techniques, and other related MATLAB toolboxes employed in the development of the system. This research utilized 10-fold Cross-Validation for the analysis of the data. It is a statistical technique used in evaluating predictive models by dividing the data into training and validation sets. The approach divided the dataset into K-fold equal data sizes and crossed over each K-dataset partition in successive rounds such that each data point has a chance of being in the validation process. The Centre for Pattern Recognition and Machine Intelligence (CENPARMI) has developed a database for Banknote Identification (Experiment 1), Counterfeit Detection (Experiment 2), and Multiple Banknote recognition (Experiment 3). The database comprised of eight classes for the Naira Notes, US Dollars had six classes, five classes for the Canadian Dollars, and seven classes for the Euro Bills for both genuine and counterfeit bills [34, 35].
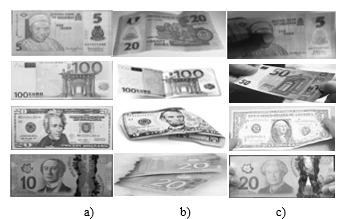 Figure 6. a) Full notes b) Folded notes, and c) Occluded notes
4.1. Banknote Recognition (Experiment One)
The obverse and reverse of the banknotes were captured using a Canon T2i digital camera. Banknotes suffering from scratches, wrinkle, stains, wear and tear which represent the image quality of the paper monies in the real-world were captured for this project. The statistical distribution of the Dataset was Nigerian Naira, US Dollar, Canadian Dollar, and Euro data sets. It comprised 1790, 1120, 1000, and 1400 genuine banknotes and 1320, 823, 733, and 1020 fake banknotes respectively. Each dataset included images with multiple notes, clutters, overlapping and partial paper money. Furthermore, the datasets were made up of images captured in four directions for each banknote: the front (upward and downward) and back sides (upward and downward).
Figure 6 depicts pre-processed images employed in the single banknote recognition phase of the system drawn from the four datasets used namely Naira (First Row), Euro notes (Second Row), US Dollar (Third Row), and Canadian Dollar (Fourth Row). a) Comprises banknotes without clutters or occlusions captured with minimal illumination interference, b) Consists of Partially Occluded Banknotes with clutters and distortions, and c) Made up of notes with wrinkling and folds held by a user in an open environment with minutiae illumination obstruction.
While Figure 7 measures the performance accuracy using SIFT, SURF, HOG, GLOH, Shape Context, and Modified HOG using KNN, WKNN, RF, MLP, OVO-SVM classifiers. The x-axis shows the accuracy while the y-axis gives the extracted features and the z-axis has the classifiers for the Naira, USD, CAD, and Euro Banknotes. From the results, the best accuracy for the Features and classifiers were SURF/Modified HOG and OVO-SVM while the worst performance was achieved with SIFT and KNN Respectively although the proposed Modified HOG presented comparatively higher accuracy in most cases it was barely higher than the SURF techniques. Furthermore, RF and MLP did produce promising results, but their accuracy was dependent on the descriptor and currency as RF outperformed MLP in some cases and MLP outweighed RF in performance accuracy in other feature and classifiers combination. Although, WKNN outperformed KNN they both still had low rates. Lastly, the most inferior combination accuracy was SIFT and KNN with an average of 82%, and the highest accuracy combination was Modified HOG and OVO-SVM with an average rate of 97.3% with the proposed SURF closely following behind with an accuracy of 97.29%.
Further experiments were conducted with feature reduction techniques to remove features that hinder the accuracy and precision of the proposed approach, and the error rate was utilized in measuring the performance of which is presented in Table 3 above. The table gives the Error Rate of OVO-SVM of the different Descriptors and Feature Reduction on the Four Datasets.
The proposed approach Modified HOG/LVHCF presented the lowest error rate within the average rate of 0.0270 after feature reduction while shape context/PCA had the worse error rate with an average of 0.0585. The rankings of the descriptor and Feature reduction technique ranging from best to worse are Shape Context, SIFT, GLOH, HOG, SURF, Modified HOG and PCA, BOW, LVF, HCF, LVHCF respectively. Additionally, each feature reduction approach was applied to all the descriptors to determine the best pair with the highest recognition rate. From the result, PCA had the lowest acceptance rate across all data sets while Modified HOG/LVHCF presented the best results across all datasets with relatively higher performance than SURF. Regarding datasets, Naira notes offered the best result while CAD had the worse rate although there were cases where CAD outperformed Euro and USD data sets when SIFT, SURF and Shape Context descriptors were employed. Lastly, the proposed approach presented promising results in comparison with existing techniques and can be engaged in descriptor dimension reduction.
4.2. Counterfeit Detection (Experiment Two)
Figure 8 depicts genuine and fake banknotes employed in this research, the first row consists of Naira notes, the second row has Euro paper money, the third row with the Canadian dollar, and the fourth/last row has US dollar. The dataset covers a wide variety of conditions, such as occlusion, rotation, changes in scaling, illumination, and viewpoints.
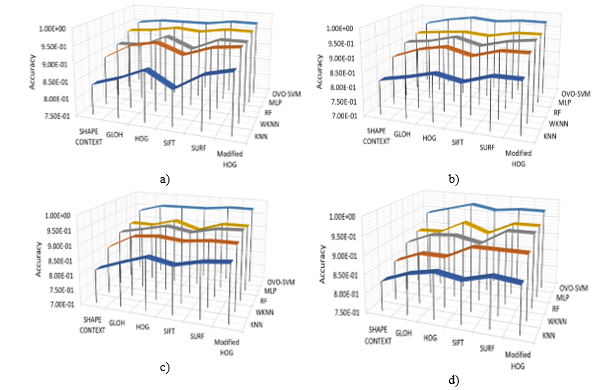 Figure 7: Accuracy measure of a) Naira, b) USD, c) CAD, and d) Euro using feature descriptors on different classifiers
The table presents the evaluation results of the proposed system on the data sets using OVO-SVM as it presented the best result during classification. For testing the system used 3110 samples for the Naira notes, 1943 instances for US Dollar, 1733 samples for Canadian Dollar and 2420 images of the Euro banknotes. Furthermore, the table also showed the Naira relatively had the highest correctly detected samples while the US dollar had the lowest successfully authenticated notes. However, all data sets had little incorrectly detected samples irrespective of the size of the data set; the system identified all images in the four datasets as paper money still, although some bills were wrongly classified. Finally, The Naira had the highest detection rate, the Euro came second, USA Dollar was third, and the Canadian dollar had the least authentication rate.
4.3. Multiple Banknote Recognition (Experiment Three)
For the multiple banknote recognition systems, an object detection method in a cluttered scene using point feature matching of extracted HOG features based on image patches computed from the vertices of SURF points normalized using low variance and high correlation filter. It reads the test image and preprocesses it by applying grayscale conversion, noise removal, background subtraction, and normalization. Furthermore, the HOG Feature points are detected and used in matching the test image containing multiple banknotes is paired with the template image using the putative matching technique. The approach computes the transformation matched points while eliminating outliers. This aids in localizing the object in the scene. Lastly, the system locates the bounding polygon of the detected image and draws a black box to indicate the denomination.
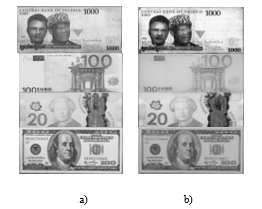 Figure 8. a) Genuine and b) Fake Banknotes
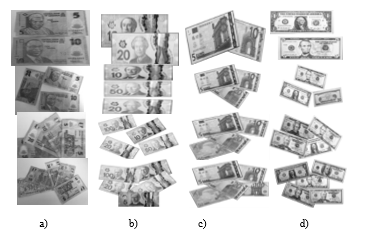 Figure 9. Multiple banknotes from a) Naira, b) CAD, c) Euro, and d) USD Dataset
Table. 3 Error Rate of feature reduction on different descriptors using OVO-SVM on the Four Datasets
| No. | Descriptor | Feature Reduction | Naira | USD | CAD | Euro |
|
1 |
Shape Context |
No Feature reduction
PCA BOW LVF HCF LVHCF |
0.0489
0.1500 0.1300 0.0950 0.0650 0.0700 |
0.0627
0.1948 0.1553 0.1269 0.0754 0.0654 |
0.0630
0.2104 1.7267 1.3056 0.0865 0.8721 |
0.0594
0.1956 0.1678 0.1284 0.7253 0.6893 |
|
2 |
GLOH |
No Feature reduction
PCA BOW LVF HCF LVHCF |
0.0387
0.1300 0.0930 0.0600 0.0550 0.0575 |
0.0421
0.1357 0.0892 0.0648 0.0540 0.0404 |
0.0395
0.1243 0.7507 0.6340 0.5425 0.0409 |
0.0415
0.1364 0.0885 0.0655 0.0574 0.0529 |
|
3 |
HOG |
No Feature reduction
PCA BOW LVF HCF LVHCF |
0.0379
0.1000 0.0900 0.0780 0.0550 0.0383 |
0.0283
0.1092 0.0921 0.0795 0.0484 0.0285 |
0.0379
0.1150 0.0988 0.0815 0.0502 0.0380 |
0.0233
0.1144 0.1077 0.0921 0.0665 0.0238 |
|
4 |
SIFT |
No Feature reduction
PCA BOW LVF HCF LVHCF |
0.0371
0.1010 0.0750 0.0586 0.0400 0.0380 |
0.0365
0.1204 0.0764 0.0582 0.0488 0.0469 |
0.0368
0.1155 0.0843 0.0577 0.0422 0.0388 |
0.0354
0.1288 0.0751 0.0549 0.0445 0.0363 |
|
5 |
SURF |
No Feature reduction
PCA BOW LVF HCF LVHCF |
0.0261
0.0907 0.709 0.558 0.350 0.0295 |
0.0276
0.1048 0.0977 0.0660 0.0408 0.0389 |
0.0268
0.1166 0.0928 0.0702 0.0502 0.3049 |
0.0275
0.1287 0.0845 0.0681 0.0455 0.0315 |
|
6 |
Modified HOG |
No Feature reduction
PCA BOW LVF HCF LVHCF |
0.0266
0.0837 0.0649 0.0351 0.02660.0265 |
0.0279
0.0884 0.0651 0.0257 0.0384 0.0277 |
0.0268
0.0874 0.0662 0.0318 0.0296 0.0268 |
0.0274
0.0865 0.0672 0.0328 0.0299 0.0276 |
Figure 9 shows multiple banknote samples utilized in this research: a) comprises Naira notes, b) Canadain Dollar notes c) Euro bills, and d) US Dollar. The first row contains two bank notes; the second row contains three banknotes, the third row includes four bank notes, and the last/fourth row has five bank notes. The multiple notes dataset included clutters, distortions, rotations and overlapping captured in different illumination conditions.
While Figure 10 presents the database employed for the numerous banknote detection phases of the system, it consisted of 460 Naira images, 372 US dollar samples, 440 Canadian dollar images, and 365 Euro Samples. Table 6 shows the dataset of Naira, Euro, CAD and US notes used in the multiple banknote recognition experiments ranging from images with one banknote to five bills. It shows the precision and recall of this analysis; this was computed to investigate the effectiveness of our systems in distinguishing many banknotes in one image and determine which of the several banknote classes can best predict the note denomination irrespective of distortions.
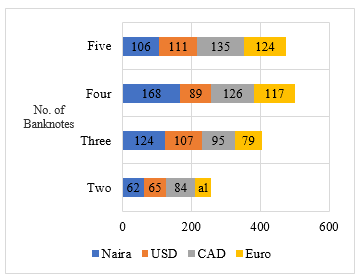 Fig. 10. Multiple banknotes Dataset
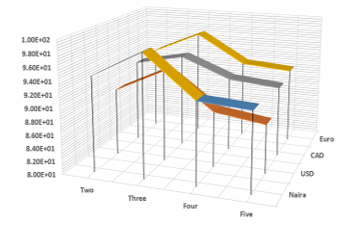 Figure 11. Recognition Rates of a) Naira b) USD c) CAD and d) Euro on multiple banknotes
Furthermore, in Figure 11 we have measured the Recognition Rate using One, two, three, four and five notes on the Naira, USD, CAD, and Euro Database. For simplicity, we have shown here only the recognition rate on the x-axis, while the number of the banknotes is fixed on the y-axis and the currency type on the z-axis. The reason for this experiment is to evaluate the effectiveness of the proposed feature extraction approach on multiple banknote recognition. The system recognized several currencies including same notes in the same image, separated, overlapped, cluttered and partially obstructed. After three bills the acceptance result reduced when the number of banknotes was increased. In all cases, the accuracy measure is more than 87%. Although one, two and three notes show more than 92% while four and five ranged between 87.50% and 92.45%. For this research, the best recognition rate across all datasets was three bills using Naira at 98.60%, and the worse was with five banknotes using USD at 87.50%.
Table 5. Qualitative Analysis of feature descriptors
| Method | Time | Scale & Rotation | Illumination | Affine |
| Shape Context | Better | Better | Common | Good |
| SIFT | Common | Best | Common | Good |
| SURF | Best | Common | Common | Good |
| HOG | Common | Common | Best | best |
| GLOH | Good | Best | Common | Good |
| Modified HOG | Best | Better | Best | Best |
In Table 5, we empirically compare the performance of all feature descriptors for multiple banknote identifications concerning its variants in five distinct scenarios: speed, scale, rotation, illumination, and affine invariance. The results of the experiment were analyzed qualitatively to give a general idea of the performance of each algorithm in distinct scenarios using four grades: Common, Good, Better, and Best. As shown in the table above, Shape context has significant advancements in speed, scale, affine, and rotation changes. But not illumination change. SIFT is slow; it is invariant to rotation and scale, maintains a stable degree of stability for affine transformation and a low threshold to illumination change. SURF is fast and has better performance than SIFT and GLOH, but it is not stable to the rotation and illumination changes. HOG is robust to rotation, illumination, positioning, and affine modifications but very slow and scale variant. GLOH has excellent performance in scale and rotation, presented reasonable speed and affine changes and had a deficient sense of illumination invariance. The Modified HOG descriptor maintains a proper stability illumination, rotation, and affine transformation. It can also handle reasonable scale invariance and compared with the other algorithms; it has distinct advantages regarding speed. Thus, can be deduced that the proposed technique presented a promising performance in banknote recognition. Lastly, the result of this qualitative analysis is not constant in all cases as changes to the dataset, and classifiers can lead to a different conclusion.
4.4. Training Sample Needed
One critical issue is determining the number of notes by denomination and authenticity is needed to ensure a reasonable performance from the proposed technique. To solve this problem, the various databases are evaluated concerning the sizes by varying the training set dimension. A remarkable increment on the recognition and error rate is seen when the training data set increases from 300 to 800 for banknote recognition, 100 to 250 for counterfeit detection, and 50 to 200 for multiple currency recognition. After which growing the data further only produced asymptotical performance improvement but had no effect on its accuracy and error rate, and this could be attributed to the inclusion of more distorted notes.
5. Conclusion and Future Work
This research was conducted to determine the efficiency of selected Modified HOG/LVHCF descriptor for automatic recognition of paper money. The proposed system was implemented using the Nigerian notes, and for experimental evaluation of the system, a further test was conducted on USD, CAD, and Euro notes. The proposed method extracted the HOG descriptor from image patches created from the vertices of SURF interest points feature of the banknotes, Low Variance, and High Correlation feature reduction filter was employed to reduce the feature set and classified using OVO-SVM in identifying and authenticating fake and genuine bills. Lastly, point matching technique was applied to detect feature vectors to match images containing multiple banknotes to determine the value of the currencies. Future research would include incorporating new feature descriptors and reduction approach to reduce processing time in addition to scaling down the application to work on mobile devices and reducing the computational complexity to enable embedding in micro-controllers and microchips.
Acknowledgment
This work was supported partly by the Centre for Pattern Recognition and Machine Intelligence (CENPARMI) Research Group of Concordia University and the Natural Sciences and Engineering Research Council of Canada (NSERC).
- D. Alekhya, G. Devi Surya Prabha, G. Venkata Durga Rao, “Fake currency detection using image processing and other standard methods,” IJRCCT, 3(1), pp. 128-131, 2014.
- M. Thakur, A. Kaur, “Various Fake Currency Detection Techniques,” International Journal for Technological Research in Engineering, 1(11), 2014.
- A. Berenguel, O.R. Terrades, J. Lladós, C. Cañero, “Banknote counterfeit detection through background texture printing analysis,” 12th IAPR Workshop on Document Analysis Systems (DAS), pp. 66-71, 2016.
- M.S. Uddin, P.P. Das, M.S.A. Roney, “Image-based approach for the detection of counterfeit banknotes of Bangladesh,” (ICIEV), 5th International Conference on Informatics, Electronics and Vision, pp. 1067-1072, 2016.
- H. Hassanpour, A. Yaseri, G. Ardeshiri, “Feature extraction for paper currency recognition,” ISSPA 2007. 9th International Symposium on Signal Processing and Its Applications, pp. 1-4, 2007.
- N. Kato, S. Omachi, “A handwriting character recognition system using directional element feature,” IEEE Trans. Pattern Anal. Mach. Intell, 21(3), pp. 258–262, 1999.
- F. García-Lamont, J. Cervantes, A. López, “Recognition of Mexican banknotes via their color and texture features,” Expert Systems with Applications, 39(10), pp. 9651-9660, 2012.
- H. Aggarwal, P. Kumar, “Indian Currency Note Denomination Recognition in Color Images,” International Journal on Advanced Computer Engineering and Communication Technology, 1(1), pp. 12-18, 2014.
- P.D. Pawar, S.B. Kale, “Recognition of Indian Currency Note Based on HSV Parameters,” International Journal of Science and Research (IJSR), 3(6), pp. 132-137, 2014.
- J. Lee, J. Seong-Goo, K. II-Hwan, “Distinctive point extraction and recognition algorithm for various kinds of euro banknotes,” International Journal of Control, Automation, and Systems, 2(2), pp. 201-206, 2004.
- M. Ionescu, A. Ralescu, “Fuzzy hamming distance-based banknote validator,” FUZZ’05, The 14th IEEE International Conference on Fuzzy Systems, pp. 300-305, 2005.
- H. Hassanpour, M.F. Payam, “Using Hidden Markov Models for paper currency recognition,” Expert Systems with Applications, 36(6), pp. 10105-10111, 2009.
- F. Poor, T. Mohammadpour, A. Kianis, “Persian Banknote Recognition Using Wavelet and Neural Network [A],” in Proceedings of the IEEE Conference on Computer Science and Electronic Engineering, 3, pp. 679-684, 2012.
- W. Selesnick, R.G. Baraniuk, N.G. Kingsbury, “The dual-tree complex wavelet transform,” IEEE Trans. Signal Process, 22(6), pp. 123–151, 2005.
- W.L. Chan, H. Choi, and R.G. Baraniuk, “Coherent multiscale image processing using dual-tree quaternion wavelets,” IEEE Transactions on Image Processing, 17(7), pp. 1069-1082, 2008.
- S. Gai, G. Yang, M. Wan, “Employing quaternion wavelet transform for banknote classification,” Neurocomputing, 118, pp. 171-178, 2013.
- F. Ahangaryan, T. Mohammadpour, A. Kianisarkaleh, “Persian Banknote Recognition Using Wavelet and Neural Network,” (ICCSEE), 2012 International Conference on Computer Science and Electronics Engineering, 3, pp. 679-684, 2012.
- A. Rajaei, E. Dallalzadeh, M. Imran, “Feature extraction of currency notes: an approach based on wavelet transform. (ACCT),” Second International Conference on Advanced Computing & Communication Technologies, pp. 255-258, 2012.
- C. Harris, M. Stephens, “A combined corner and edge detector” In Alvey vision conference, 15(50), pp. 147-151, 1988.
- T. Lindeberg, “Feature detection with automatic scale selection,” International Journal of computer vision, 30(2), pp. 79–116, 1998.
- K. Mikolajczyk, C. Schmid, “Indexing based on scale invariant interest points,” ICCV Proceedings. Eighth IEEE International Conference on Computer Vision, 1, pp. 525–531, 2001.
- D.G. Lowe, “Distinctive image features from scale-invariant keypoints,” International Journal of computer vision, 60(2), pp. 91–110, 2004.
- T. Reiff, P. Sincak, “Multi-agent sophisticated system for intelligent technologies,” ICCC International Conference on Computational Cybernetics, pp. 37-40, 2008.
- K. Van De Sande, T. Gevers, C. Snoek, “Evaluating color descriptors for object and scene recognition,” IEEE transactions on pattern analysis and machine intelligence, 32(9), pp. 1582-1596, 2010.
- T.H. Rassem, B. E. Khoo, “Object class recognition using combination of color SIFT descriptors,” IEEE International Conference on Imaging Systems and Techniques (IST), pp. 290-295, 2011.
- N.S. Pai, J.H. Hong, P.Y. Chen, J.K. Wu, “Application of design of image tracking by combining SURF and TLD and SVM-based posture recognition system in robbery pre-alert system,” Multimedia Tools and Applications, 76(23), pp. 25321-25342, 2017.
- F.M. Hasanuzzaman, Y. Xiaodong, T. Yingli, “Robust and effective component-based banknote recognition for the blind,” IEEE Transactions on Systems, Man, and Cybernetics, Part C (Applications and Reviews), 42(6), pp. 1021-1030, 2012.
- W. Chen, S. Ding, Z. Chai, D. He, W. Zhang, G. Zhang, W. Luo, “FPGA-Based Parallel Implementation of SURF Algorithm,” (ICPADS). 22nd International Conference on Parallel and Distributed Systems, pp. 308-315, 2016.
- Z.R. Wang, Y.L. Jia, H. Huang, S.M. Tang, “Pedestrian detection using boosted HOG features,” ITSC 11th International IEEE Conference on Intelligent Transportation Systems, pp. 1155-1160, 2008.
- T.V. Dittimi, A.K. Hmood, C.Y. Suen, “Multi-class SVM based gradient feature for banknote recognition,” (ICIT), IEEE International Conference on Industrial Technology, pp. 1030-1035, 2017.
- N.K. Verma, R. Abhishek, S. Al, “An optimized fault diagnosis method for reciprocating air compressors based on SVM,” (ICSET), IEEE International Conference on System Engineering and Technology, pp 65-69, 2011.
- A. Rashid, A. Prati, R. Cucchiara, “On the design of embedded solutions to banknote recognition,” Optical Engineering, 52(9), pp. 093106-093106, 2013.
- A. Govada, G. Bhavul, K.S. Sanjay, “Distributed multi-class SVM for large datasets,” In Proceedings of the Third International Symposium on Women in Computing and Informatics, pp. 54-58, 2015.
- T.V. Dittimi, C.Y. Suen, “Mobile App for Detection of Counterfeit Banknotes,” In Advances in Artificial Intelligence: 31st Canadian Conference on Artificial Intelligence, 31, pp. 156-168, 2018.
- T. Dittimi, C. Suen, A. Hmood, “Mobile Based Assistive Technologies for Authentication of Banknotes,” ICPRAI 2018 – International Conference on Pattern Recognition and Artificial Intelligence, pp. 366-371, 2018.