Q-Learning versus SVM Study for Green Context-Aware Multimodal ITS Stations

Adv. Sci. Technol. Eng. Syst. J. 3(5), 328–338 (2018);
 DOI: 10.25046/aj030539
Intelligent Transportation Systems (ITS) applications can take big advantage of Context Awareness approaches. Parameters such as user mobility, passengers comfort reaction and pollution emission levels (CO2) can enrich such applications during the decision making phase. Moreover, the expanding in ITS services offers great opportunities for travelers to find the best route to reach their destinations with the lowest or fair costs. It can offer a selecting methodology for optimal route that adapted with some processing parameters like CO2 level, ticket cost, waiting or connection times and the overall traveling time plus the comfortability reaction for each means of transportation) in real time environment using Machine Learning (ML) tools like Q-Learning or SVM: Support Vector Machines. This paper aims at conducting a comparison study for green ITS routes (i.e. the lowest CO2 levels). The study compares between Q-Learning and SVM techniques for identifying different variety of routes between two stops as ranked routes from best to lowest based on some traces gathered from some known transportation traces. Reinforcement Q-Learning is applied to validate the first phase in our approach to recommend the best means and SVM is used to validate the prediction phase about the best route among different routes built based on three means of transportation (metro, train and bus).
1. Introduction
The ITS network is considered as the most important element of concern to the countries in the modern smart cities era. It is being the arteries that pass through continues chain of business activities, social, cultural and tourism that promote the march of the national economy for its role in providing services to the sectors of production and other services, and is reflected from providing employment opportunities. Therefore, the new ITS construction projects occupy the first initiative in sustainable development programs and projects to achieve higher rates of growth and development through the provision of passenger traffic between all stations or cities of the proposed new development. The governments directions are focused on planning and implementations of future stations that help in the preparations and developments of the countries through intelligent decision mechanisms.
Today, the need for an ITS solution becomes crucial to provide a smart solution for managing the traffic on country’s roads network. Significant outcomes expected of using ITS are to provide a smooth, smart, and sustainable transport means.
Moreover, distributing the passengers over all the available transportation means (like buses, cars, trains, planes, and ships) can lead to some kind of balance between them and help in solving the problems of traffic jams. This aim can be achieved if there will be an implementation of intelligent systems having clear information about some states statistics like current traffic means available, roads status, passengers per day and pollution’s emitted per trip. Those implemented systems can predict the long term situation of city or state transportation system behavior and recommend the future planning for new smart cities. Another important thing is the world climate changes due to transportation activities. Those changes are serious and can be affected by the huge carbon emission levels from different means of transportation and hence the dangerous consequences on the humanity life. This could be an incentive to optimize and reduce the CO2 emission either from public or private transportation means that will lead the concept of Green-ITS.
Context Awareness (CA) approach can be used to enrich the ITS services as it can adapt the control system dynamics. This shall grasp the potential advantages, which influence the control strategies taken to manage the transportation system especially, in multimodal traffic management. The multimodal traffic station has different crossings of different transportation means like metro,train, bus, and etc.
This paper is an extension of the work originally presented in (ICECTA) conference [1].
Through the work, we improved the previous implementations about advanced ITS traffic flows management [2]. The aim of the previous paper was to choose among different transportation means the best one. We considered the recommendation of the best transport mean from the available three means of transportation in multimodal station with crossing of metro, bus and train. This recommendation is done based on some user and system parameters at any time (t) for any passenger decides to reach a specific destination using the previous means. We used a reward based Qlearning approach to choose the best transport means available in multimodal stations. In the second phase of this work, we propose using Support Vector Machines (SVM) for their reputation in classification accuracy or prediction speed comparing to the previous approach.
The context of SVM foundations had been developed in 1995 by Vapnik [3] and obtained high popularity in different applications due to some attractive and intelligent features, and the promising performance in empirical tests [4].
To conclude our work, the goal is to select among different routes available between two stations the best one for the destination. The selection is carried out by classifying some collected ITS traces about all the possible routes including combinations between different means of transportation at any time (t). Moreover, we considered the influence of new parameters that are missed in the previous work [2] like:
- The passenger waiting time at the starting station till the arrival of transportation mean.
- The passenger waiting time if there is a connection(s) between different or same transport means to reach specific destination.
- The measurement of CO2 pollution from each trip.
Furthermore, the performance evaluation study in this work is done based on real traffic statistics that gathered in real time from SNCF T ransilien [5] and V ianavigo [6] French sites. This data covered some working and week-end days during one month testing period from the French transportation network of Paris area.
The construction for paper is structured as follows: In Section 2, we introduce the related work done in ITS decision-makings analysis and management using Machine Learning (ML) tools. Then, Section 3 presents the Reinforcement Q-Learning model then the SVM for the context aware ITS multimodal stations. Afterward, the evaluations done for the proposed models and their results are compared with different selected use cases of working and week-ends days in Section 4. This is conducted through extensive simulations based on collected real-time statistics from the French SNCF T ransilien site [5]. Finally, Section 5 concludes and highlights the perspectives of this work.
2. Work Background
An Intelligent Agent (IA) term in ITS domain has been defined as: the agent which receives precepts from the environment and based on that takes smart actions [7]. The IA is considered as the transportation station in our study. This agent has the capability to take decisions based on the gathered reactions from the passengers. Upon received those reactions, a contextaware learning system is used to optimize the taken decisions. Then, it proposes an accurate guides for all passengers crossing this IA (i.e. the multimodal station). Hereafter, we highlight some relevant insights that tackled the intelligent transportation prediction systems based on reported reactions.
The following literature is organized in two sections. The first one reviews some propositions based on using reinforcement and Q-learning techniques [814]. The second section reviews the propositions based on using SVM techniques in ITS. As it seems to our problem context, there is no related work uses SVM learning algorithm to detect the travel time of each transport mean and hence predict the best one at each time (t). As will be seen, the most of these works in this section is relating to detecting the travel time for bus and cars on highways based on SVM.
2.1. Q-Learning based Prediction Systems
Q-Learning is typically used in reward based reinforcement learning in different ITS domains. The technique of arrival time estimation proposed in [8] a prediction model. This model considered its decision based on common context for both vehicles and their drivers. The proposed solution considered an increasing in the anticipated time of arrival based on some observations in the traffic flow patterns.
Moreover, the pattern anticipates the vehicles arrival time from the history of the passed routes (i.e. the whole previous traveled routes). The main weak point of this model is the lack of consideration either in backup routes to be used as parallel routes or in emergency situations due to traffic jam. But, this proposal is a good solution for ITS tracking systems.
The work in [9, 10] proposed the reinforcement learning model for the traffic-based control. This is for the case of classical pre-timed systems in signal control and the control agents are also independent. Through the model, the authors implemented the learning system for their control agent based on reactions’ rewards as a closed-loop control agent. This agent will interact with the environment to converge with the control policy for learning and achieving an optimal mapping for the optimal required control action and the environments state.
Moreover, the authors had been considered in another work [11] the use of the reinforcement learning approach in a decentralized system. They proposed an adaptive real-time agent for traffic signal control system that ables to minimizing the vehicles total travel time. Based on accumulated reward, Q-Learning agent is used to learn the optimal mapping between the environments state in one side and the corresponding control action in the other side.
The Q-learning model for traffic control considered in [11] is based on time varying and stochastic problems in the traffic flow while in [12], authors investigated the snag of agent-based self-optimization against multiple polices. They proposed the use of distributed w-learning reinforcement learning model. The purpose behind this idea applied in self-organized traffic control systems, is the performance improvement from multiple policies deployments simultaneously.
But, the work in [13] proposed a prediction model for the flow of traffic depending on the multi-agent reinforcement learning. This model is based on multicross roads control for the traffic signal.
Finally, authors in [14] concentrated on the coordination between control agents in order to adapt the roads traffic signals. Therefore, they propose to use an independent control agent mode besides an integrated mode merged with reinforcement learning. This model is capable of solving the agents’ communication problems. Their results indicate that there is a delay reduction for the connection travel time according to their model proposition.
2.2. Classification Systems based SVM
SVM as a supervised machine learning tool that is based on simple principles, originated from statistical learning theory [3]. The SVM simplicity is coming from the applying of simple linear methods on the data[15].
The accuracy as well as simplicity of the SVM models are the key for many contributions based on classification and regression.
In this part, we present the most research directions that used SVMs in ITS domain as follows:
The first main concern in this direction using SVMs was focusing on the time prediction for the trip. The authors in [16-18] introduced different models based on SVMs to predict the time of each travel on the highway routes. While in [19], the authors proposed their travel time prediction model using the SVM in urban transport networks.
Other contributions considered SVM for the bus travel times prediction. In [20], SVM based hybrid model was introduced for this time prediction. Their technique was based on combining between the classical SVM, the Grubbs test method and an adaptive algorithm.
In [21], a new bus travel time prediction model for multiple dynamic routes is proposed. The model used SVM with Kalman filtering technique.
The authors in [22] proposed their time prediction model for the flow of rail transit passengers in the city of Beijing using SVR to improve the rail transportation management. They used the PLSR: Partial Least Squares Regression method to resolve multi colinearity among the dependent variables.
Last direction in our study focused on the research directions in the traffic signs detection or prediction. In [23-26], the authors developed automatic systems for either traffic sign detection or recognition using SVM. Through [26], the authors proposed the use of SVM as a recognize module to analysis the keep-clear signs to enhance the traffic management in cities.
Another work [27] was focusing on using SVM for automatic video based vehicle detection. This is for an automatic traffic surveillance system based on ITS.
In [28], the authors proposed a design for a longhaul bus. This device is used for driving safety warning based on SVM. It is based on classifying the lane departure and forward collision.
To the best of our knowledge, SVM is not used in any ITS based model to nominate the best traffic mean or route for passengers to reach specific destination at time (t) under the context of multi-modal traffic. In the following section, the proposed model will be described and the both learning algorithms as well.
3. ITS Proposed Models
3.1 Green Transport Decision System Model (GTDS)
Usually, passenger(s) arrive to the Transport Station
(TS) for reaching certain destination. Therefore, they have to decide taking a Route i (Ri) which may includes one or more transport mean at time (t). Here, a model for Green Transport Decision System (GTDS) is proposed for facilitating the passengers travels. GTDS model nominates the best Ri for passenger(s) based on Q-learning. The system nominations rely on passengers reward reactions. In contrasting SVM with Q-learning, SVM is faster and has a higher accuracy. Therefore, in this paper SVM is proposed to be used in the second phase of this work. Figure 1 demonstrated the model main inputs and the collected reactions as system feedbacks.
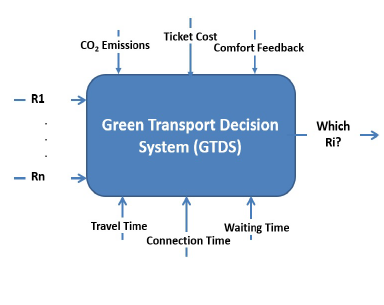 Figure 1: The main inputs and feedbacks for context aware GTDS framework
Stations apply the GTDS model should consider having multiple routes to the same destination. This is to provide different nominations at different situations aspects. According to that, the proposed model is applied on the departure station called: (Gare De P aris Montparnasse) and the arrival station called: (Gare De P aris Nord) as a study use case. The model is simulated by different week days activities (i.e. both weekend days and work days). The studied period consists of 25 quarters starting at 7:00 am until 1:00 pm. This period is intended to contain all the expected traffic conditions; either the rush hours or the free from traffic jam situations.
The choice of the best (Ri) is affected by many parameters, the most relevant are determined in the proposed model and illustrated in Fig. 1. The first factor is the passengers travel duration to reach the trendsetting. This factor will be considered taking into account the respect time for each means of transportation shown in Figure 2. The curves demonstrated in this figure have been obtained through the history of each transportation mean by collecting several observations. As indicated, the use of metro is more frequent and comfort than other transport means. The train achieves rank two and finally the bus. For this parameter which reflects respecting the arrival time, we are interested on some statistics which provide a wide sight for how the transport means follow or not the scheduled times arrival. This insight comes from the published SNCF statistics or real time scheduling plan for the transport means on the on-line site [5].
As clear in Figure 2, the best of the transport means in respecting the arrival times is the Metro. Even it may exceed its scheduled arrival times due to the rush hours. Therefore, when a passenger comes to the station and check in to see the best transportation tool to go to his destination D, the decision system inside the station uses the reactions from the station D about previous respecting arrival schedules to update the immediate reward function r when a passenger tries
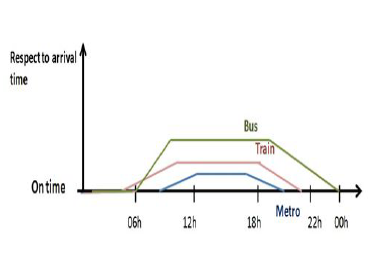 Figure 2: Arrival times respect ratio for the main three transportation means, the metro comes in the first rank followed by local train and then bus as worst respect ratio to arrival on time
By doing so, the decision system firstly tries to optimize its future decisions biased from the previous experience along the day.
Secondly, the travel cost which could affect the system decisions. As known, the most of passengers propose the use of the cheapest transport mean.
Thirdly, if there is a waiting time before catching the transport mean.
Fourthly, in the travels of multiple transport means, the connection time is considered as an effecting parameter.
Fifthly, the comfortability coefficient for the use of Ri at any time (t). This coefficient reflects the passenger satisfaction degree of current experience about using any route Ri. The impact is influenced by the available free chairs in rush hours comparing to the number of passengers intend to use this route. Therefore, passengers are more interested of using the more comfortable transport means. The comfortability reaction of the passengers is shown in Figure 3. The mentioned parameters are function of time even the ticket price. In some countries, ticket cost plan changes along the week days (i.e. working days and off days). At present, the major of the world countries became concerned about the CO2 emission because of the catastrophic effects on the world climate.
In this contribution, we are interested in adding the CO2 parameter that affects the selection of the transport means and hence the best route. In France, the government encourages the people to use the public transport means to decrease the emission of the CO2 and hence the air pollution. Moreover, France, during high air pollution days, encourages the use of public traffic means for free, and prevents the even/odd cars plate numbers in Paris area.
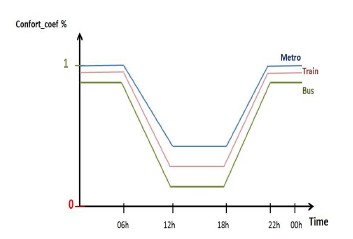 Figure 3: Passengers Comfortability Feedbacks/Reactions, comfort coefficient equal one (comfort coef=1) represents high satisfaction from the passengers while the low level equal zero for unsatisfied trips
3.2 Reinforcement Learning Model
Using reinforcement learning, any T S can learn from its experience to guide passengers and thus, optimize its interactions for the future decisions. The mentioned experience is stated as rewards and sanctions from the prior taken decisions. This model is initialized at each T S benefiting from the collected passengers reactions. When a passenger uses Ri to reach a destination, this Ri will be rewarded or sanctioned according to these parameters: the travel time for reaching certain destination, the passengers comfortability reaction, and finally the travel cost of every Ri. Consequently, each T S will tune its travel means nominations from its gained experience.
In this paper, the T S decision problem is formulated as a Markov Decision Problem (MDP), that can be solved by the reinforcement learning algorithm. The T S will elects the best Ri for reaching a destination biased by its experience at each day hour, or another duration period based on the traffic. Next to that, the system evaluates itself by assessing the decision taken as a reward or sanction. The MDP is defined as a tuple
[i,t,a,r].
- i: stands for the object that is considered in this study by the route Ri.
- t: stands for the system states set that are considered in this model by the under-study time shift periods during the day.
- a: stands for the decisions set that taken by the T S. In this work, the decisions of the T S are to nominate the best Ri that can cover the passengers requirements/expectations. Only six possible Rs between the proposed T Ss are considered in our use case.
- r: stands for the immediate reward that the passenger will get according to taking decision a.
A Qi(t,a) is an action-state matrix that is formed to store the gathered reward/sanction for each state and the action pair of a route Ri at a time (t). Giving an example to that, this matrix reflects the predicted reward when takes an action (a) after using the route Ri at a time (t). The updating function of Qi(t,a) can be defined by:
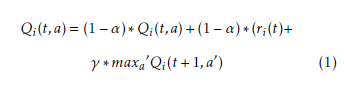 Where:
- α: indicates the learning rate representing how fast the Q-values vary corresponding to the dynamic users reaction.
- γ: indicates the discount factor. It reflects if the immediate reward status against the future one. For the comparison, high value future reward is more valued than the immediate one.
- ri: indicates the predicted immediate reward when choosing Ri at a time (t).
- maxa0Qi(t +1,a0): represents the maximum predicted future reward once the system reaches a state (t +1) when taking any decision action a.
Furthermore, once a passenger arrives the desired destination via Ri after the scheduled arrival-time, T S will get a sanction reaction. While, in case all the Rs are delayed, bonus is counted to the Rs of the minimum counted delay time.
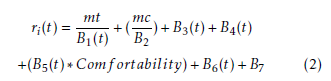 Where:
- mt is the reference trip duration of all Ri at a time (t) that represents the minimum travel time of Ri.
- B1 parameter indicates the travel time due to catching Ri.
- B2 parameter indicates the ticket price of the Ri comparative to a mean value (mc) that equals to one. It is assumed that, the ticket price plan is fixed during the week-days.
- B3 and B4 are bonus values for the Ri of minimum waiting and connection times respectively. These parameters are comparative between all the transport means and takes a value of 1 to the lowermost times up to 0.5 to the uppermost times.
- B5 is the passengers satisfaction reaction in percentage reflecting the comfortability of using Ri at time (t). The default value equals to 1 as shown in Figure 3.
- B6 is an added bonus to the Rs of low delays comparatively between them and on the contrary Ri of a highest delay has no bonus.
- B7 is an indication to the green transport means which is preferred to be used than others as it cause less pollution. This parameter is a bonus totaled to the Ri of low transport means CO2
Passengers reactions/feedbacks about the transport means are collected in real-time as reports. Each passenger is supposed to send his reaction/feedback using a dedicated simple mobile application that will supply the Decision System Algorithm DSA(t) shown in Algorithm 1.
3.3 Support Vector Machine Classification
SVM, a supervised machine learning tool, is used for classifying linear and non-linear dynamic systems. SVM decisions can be considered for the classification problems and the regression aspect. The best classification results from finding the best hyperplane fits data separation with error free and maximal distance between the closest vector to that hyperplane.
In this work, SVM is used to distinguish among two classes. Class one refers to the best route(s) to certain destination while the other class refers to the alternative routes that are available for use to the same destination.
The aim is to find a data separator between the two mentioned classes whatever linear or non-linear. From theoretical point of view, linear SVM matches our scenario as it is a question of only two classes. Assuming the routes data set (i.e. the collected traces) is D as:
![]() Where:
Where:
- x is the set of training vectors.
- n is the number of days quarters under study that is equal to 25 period.
- y is the classs labels.
And the hyperplane is:
![]() Considering a canonical hyperplane [4], where the parameters w, b are constrained by,
Considering a canonical hyperplane [4], where the parameters w, b are constrained by,
![]() The following constraints must be considered for a separating the canonical hyperplane, which is the most fitting assumption for non-linear classification,
The following constraints must be considered for a separating the canonical hyperplane, which is the most fitting assumption for non-linear classification,
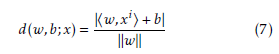
![]() The distance d(w,b;x) of a point x from the hyperplane (w,b) is:
The distance d(w,b;x) of a point x from the hyperplane (w,b) is:
 For optimal hyperplane, the margin, ρ has to be maximized based on the constraints of (6) and given by:
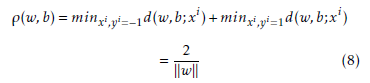 So, the optimal hyperplane, the data separator that minimizes is:
![]() The optimization problem solution of (9) using the constraints of (6) is given by the saddle point of the Lagrange function:
The optimization problem solution of (9) using the constraints of (6) is given by the saddle point of the Lagrange function:
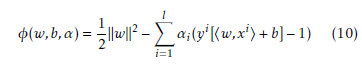 where α is the Lagrange multiplier that must be minimized with respect to w,b and maximized with respect to α ≥ 0. This dual problem is given by:
![]() To get the minimum w and b of the Lagrangian, φ is given by,
To get the minimum w and b of the Lagrangian, φ is given by,
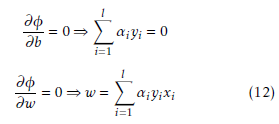 So, from (10), (11), and (12), the dual problem expressed by:
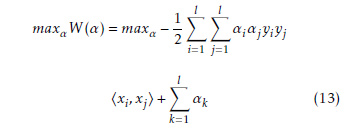 and the solution of this problem will be given as follows:
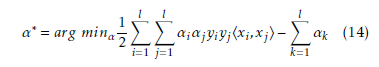 where αi ≥ 0, for i = 1,··· ,l.
By solving (14) according to its constraints defines the Lagrange multipliers then, obtains the optimal separating hyperplane as well as follows:
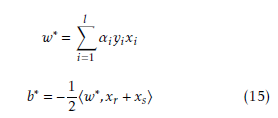 where xr and xs are the support vectors from each class satisfying:
![]()
![]() The input vectors classification that refer to the routes parameters can be solved as a nonlinear problem that fits our case as well. This depends on the input vectors distribution. For a general form in high dimensional feature space, lets suppose SVM maps the input vector x into a high dimensional feature space, z. So, the optimization problem becomes:
The input vectors classification that refer to the routes parameters can be solved as a nonlinear problem that fits our case as well. This depends on the input vectors distribution. For a general form in high dimensional feature space, lets suppose SVM maps the input vector x into a high dimensional feature space, z. So, the optimization problem becomes:
 where K is the kernel function for non-linear mapping into feature space with the same limitations, which are:
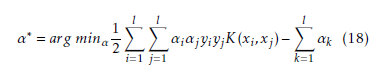
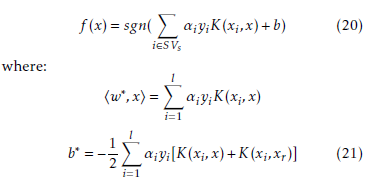
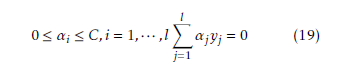 where C is a regularization parameter of the kernel function and represents the upper bound on the permissible values. Solving (18) with its constraints in (19), resulting the Lagrange multipliers, and a hard classifier as follows:
 4. Performance Validation
This section demonstrates the proposed GTDS model performance evaluations. It is evaluated based on using Q-Learning and SVM learning methods. Matlab
2012 tool is used for the simulation part with the following conditions:
- The model use case under study considers Paris region in France. The departure station is (Gare De P aris Montparnasse) and the arrival destination station is the (Gare De P aris Nord) as the most two famous stations in this Parisian region.
- The routes Rs available between the source and destination stations are many but, we processed and filtered them to form six routes only of closed results for simple comparisons.
- Time shift under study is divided into two sets. Set 1 is representing the two days of the weekend (i.e. Saturday and Sunday) and set 2 is representing the two selected working days which are Monday and Friday.
- Time shift under study starts at 7:00 AM till 13:00 PM
- The ticket price of Ri is supposed to be unity and its value is redeemed comparatively based on the transport mean used. The route cost is supposed to be the same as this fits the case in France that depends on dividing the destinations to zones.
- The collected traces of travel duration, waiting and connection times are gathered from the realtime schedules of the SNCF T ransilien official site [5].
- The passengers comfortability reactions/feedbacks of the transport means understudy follows the chart in Figure 3. This comprises many parameters such as the capacity, the design satisfaction, the rate of flow (periodicity), and the ease of catching each of them.
- The actual CO2 emission is measured in gram per person of each Ri and gathered from V ianavigo site [6].
- Number of stops: It is dynamic parameter. Its value depends on the route combinations that may comprise a combination of different transport means.
The simulations are categorized in two parts; part one is concerned about the SVM learning algorithm, and part two focuses on the Q-learning algorithm. In part one, the used traces of the determined source and destination are gathered for two weeks just for a proof of concept from [5]. We considered the first week traces as the training set and the second week traces as the testing set.
After the validation of SVM, the obtained testing set results are shown in Figure 4 and Figure 5. They illustrate the SVM accuracy calculated for both the week-end and working days respectively.
As illustrated in these figures (Figure 4 and Figure 5), the SVM classification accuracy is looking good in week-end days but has less accuracy in the working days. These are anticipated results as working days may have rush hours that influence on choosing the best route. Despite the results disorder, the system performs steady as the error is so small that is closed to one over six.
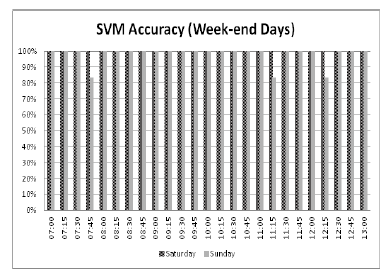 Figure 4: The output SVM system testing accuracy during weekend tested days, for the X-axis is represented the time shift from 7:00 AM to 13:00 PM as testing period
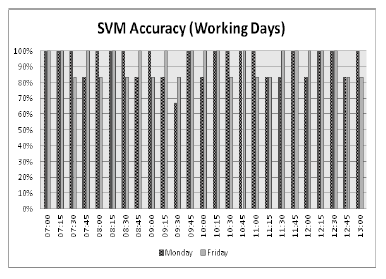 Figure 5: The output SVM system testing accuracy during working tested days, for the X-axis is represented the time shift from 7:00 AM to 13:00 PM as testing period
The second simulation part is concerned to the Qlearning machine results of choosing the best route Ri. The same traces and system settings are used for the Q-learning simulation. This simulation considers two use cases as follows:
- The week-end days: it concerns to the delay ofusing each transport mean on one of the week-end days (Saturday) as shown in Figure 6. The use of bus compared to Metro and Train has the largest delay at the same day quarter although roads are not easily suffering of congestion during the week-ends. Moreover, the metros are not far from buses statistics due to their limited circulations in the weekend days.
- Working-days: this simulation concerns to oneworking day like Friday traffic situation. The highest rush hours of the day are simulated. Figure 7 shows each transport mean delay. As clear in the figure, the use of the bus causes the largest delay with respect to Metro and Train at the same day quarter due to the traffic jams on normal routes.
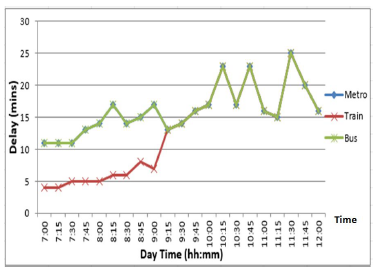 Figure 6: Saturday travel delay due to using either Metro, Train, or Bus. The hh: is the hour while mm: represents the minutes part
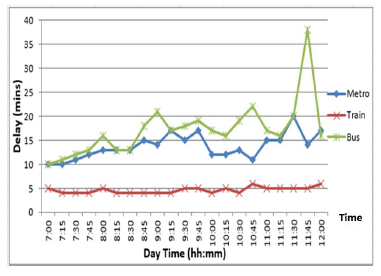 Figure 7: Friday travel delay due to using either Metro, Train, or Bus. The hh: is the hour while mm: represents the minutes part
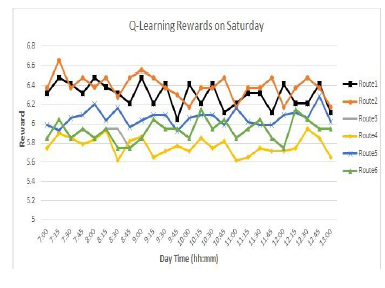 Figure 8: The rewards for Q-Learning algorithm based Saturday testing set. The hh: is the hour while mm: represents the minutes part
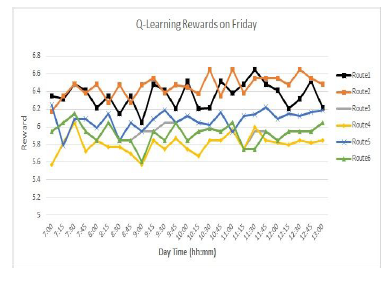 Figure 9: The rewards for Q-Learning algorithm based Friday testing set. The hh: is the hour while mm: represents the minutes part
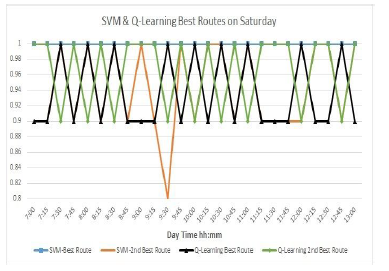 Figure 10: SVM versus Q-Learning algorithms results for the week-end selected day as Saturday
The results shown in Figure 8 and Figure 9 demonstrate the Q-values which stands for the rewards of the optional routes of each day quarter on Saturday and Friday respectively. As clear in the figures, the best route decision changes with respect to the day quarter time and routes conditions. These routes are composed of different two or more traffic means. Therefore, these figures illustrate that, the recommended routes to be used along the studied day hours depends on the conditions and delays for each route which is composed of different connections between the three-transport means (metro, bus and train).
Figure 10 and Figure 11 show the best two routes suggested by the two proposed machine learning systems (i.e. SVM and Q-Learning) for Saturday and Friday respectively. As appear in these figures, each learning algorithm decision is various due to the difference of the learning technique of both algorithms. Also, due to the difference of the input parameters weight.And finally, because SVM is a supervised learning model but, Q-learning is based on reinforcement learning.
The main purpose from these two figures is to clarify the criteria of each algorithm output and shows that each algorithm may fits according to certain applications. If the ITS system is merely in stable with no fluctuates, SVM would be a perfect fit for these scenarios. In contrast, Q-learning could suitable for infrequent cases such as accidents. This is because of Q-learning depends on conditions of the current collected data in addition to its decision history of the previous day while SVM depends on the training sets.
5. Conclusions
The framework of route selection in the ITS multimodal stations is investigated in this paper using context awareness decision model based on machine learning tools. Through this work, we used two different models; the Q-Learning as a reinforcement model and the SVM as a supervised model.
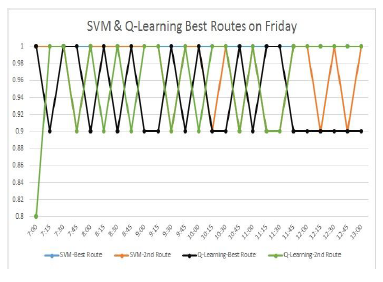 Figure 11: SVM versus Q-Learning algorithms results for the selected work-day as Friday
In the first phase, we built the Q-Learning to select among six studied routes the best one. After that, we used SVM model in order to first classify the proposed routes, second to calculate the model’s accuracy, and third to predict the best solution for the upcoming routes. The obtained results from the simulation part of both approaches indicated the advantages and disadvantages for each technique and when (time during the day or day during the week) or where (according traffic status) we can use them in ITS stations.
Actually, Q-Learning approach is best choice that can be used when the ITS system is not stable and subject to many disturbances while, SVM model is better used when the ITS system is stable and the variations over the time in data sets are steady. That is why we recommend using hybrid solutions to face such cases when searching the optimal classification based on different time intervals and with green parameters. On the positive side, ITS will enable the Green Transport Decision System (GTDS) to decide based on contextsensitive information the best route, to improve the efficiency of multimodal stations usage and to reduce the environmental impacts by including the CO2 effects.
In the future work, it will be more realistic to focus on three dimensional model approach that will consider in addition to user-location; the time. This spatio-temporal model can be applied in different universal applications. But, the problem is the difficulty of having such kind of statistics as it is subject to country regulations related to security and privacy issues. However, it can provide a new generation of traffic flows modeling that will add dynamic, predicative and adaptive control for multimodal traffic.
Acknowledgment
This manuscript is carried out under the Franco Egyptian research program called IMHOTEP Project
- A. M. Said, E. Abd-Elrahman and H. Afifi, ”A comparative study on machine learning algorithms for green context-aware intelligent transportation systems,” 2017 International Conference on Electrical and Computing Technologies and Applications (ICECTA), Ras Al Khaimah, 2017, pp. 1-5.
- A. M. Said, A. Soua, E. Abd-Elrahman, and H. Afifi, ”Context- Aware Multi-modal Traffic Management in ITS: A Q-Learning based Algorithm,” InternationalWireless Communications and Mobile Computing Conference (IWCMC 2015), Dubrovnik- Croatia, Aug. 2015, pp. 674-679.
- V. N. Vapnik, ”The Nature of Statistical Learning Theory,” New York: Springer, 1995.
- S. R. Gunn, ”Support Vector Machines for Classification and Regression,” Technical report:Faculty of Engineering, Science and Mathematics School of Electronics and Computer Science, 1998.
- SNCF Transilien 2018. [Online]. Available: https://www.transilien.com/en. [Accessed: 29-Sep-2018].
- Vianavigo 2018. [Online]. Available: https://www.vianavigo.com/en/home. [Accessed: 29- Sep-2018].
- S.J. Russel and P. Norvig, ”Artificial Intelligence: A Modern Approach,” Third Edition, Prentice Hall, 2010.
- D. Fagan and R. Meier, ”Intelligent time of arrival estimation,” IEEE Forum on Integrated and Sustainable Transportation System (FISTS), Vienna, 2011, pp.60 – 66.
- S. El-Tantawy and B. Abdulhai, ”Multi-Agent Reinforcement Learning for Integrated Network of Adaptive Traffic Signal Controllers (MARLIN-ATSC),” 15th International IEEE Conference on Intelligent Transportation Systems (ITSC), Anchorage, 2012, pp. 319-326.
- S. El-Tantawy, B. Abdulhai, and H. Abdelgawad, ”Multiagent Reinforcement Learning for Integrated Network of Adaptive Traffic Signal Controllers (MARLIN-ATSC): Methodology and Large-Scale Application on Downtown Toronto,” IEEE Transactions on Intelligent Transportation Systems, Vol.14, No. 3, 2013, pp. 1140-1150.
- S. El-Tantawy, and and B. Abdulhai, ”An agent-based learning towards decentralized and coordinated traffic signal control,” 13th International IEEE Conference on Intelligent Transportation Systems (ITSC), Funchal, 2010, pp. 665-670.
- I. Dusparic and V. Cahill, ”Distributed W-Learning: Multi- Policy Optimization in Self-Organizing Systems,” Third IEEE International Conference on Self-Adaptive and Self-Organizing Systems SASO ’09, San Francisco, 2009, pp. 20-29.
- J. Song and Z. Jin, ”Q-learning based multi-intersection traffic signal control model,” International Conference on System Science, Engineering Design and Manufacturing Informatization (ICSEM), Vol.2, 2011, pp. 280-283.
- J.Song, Z. Jin, andW. Zhu, ”Implementing traffic signal optimal control by multiagent reinforcement learning,” International Conference on Computer Science and Network Technology (ICCSNT), Vol. 4, Harbin, 2011, pp.2578-2582.
- A. Karatzoglou, D. Meyer, and K. Hornik, ”Support Vector Machines in R,” Journal of Statistical Software, Volume 15, Issue 9, 2006, pp.1-28.
- C. Wu, J. Ho, and D. T. Lee, ”Travel-Time Prediction With Support Vector Regression,” IEEE Transactions on Intelligent Transportation Systems, Vol. 5, No. 4, 2004, pp. 276-281.
- C. Wu, C. Wei, D. Su, M. Chang, and J. Ho, ”Travel Time Prediction with Support Vector Regression,” IEEE Intelligent Transportation Systems, Vol.2, 2003, pp. 1438-1442.
- A. Yusuf, and V. Madisetti, ”Configuration for Predicting Travel-Time Using Wavelet Packets and Support Vector Regression,” Journal of Transportation Technologies, Vol.3, No. 3, 2013, pp. 220-231.
- Y. Chen, H. J. van Zuylen, and Y. Qipeng, ”Travel Time Prediction on Urban Networks Based on Combining Rough Set with Support Vector Machine,” International Conference on Logistics Systems and Intelligent Management, Vol. 1, 2010, pp. 586-589.
- S. Zhong, J. Hu, S. Ke, X. Wang, J. Zhao, and B. Yao, ”A Hybrid Model based on Support Vector Machine for Bus Travel-Time Prediction,” PROMET Traffic and Transportation Journal, Vol. 27, No. 4, 2015, pp. 291-300.
- C. Bai, Z. Peng, Q. Lu, and J. Sun, ”Dynamic Bus Travel Time Prediction Models on Road with Multiple Bus Routes,” Computational Intelligence and Neuroscience (Hindawi Publishing Corporation), Vol.2015, No.432389, 2015.
- H. Zhou, Y. Qin, and Y. Li, ”A Partial Least Square Based Support Vector Regression Rail Transit Passenger Flow Prediction Method,” International Journal of u- and e- Service, Science and Technology, Vol.7, No.2, 2014, pp. 101-112.
- S. Maldonado-Bascn, S. Lafuente-Arroyo, P. Gil-Jimnez, H. Gmez-Moreno, and F. Lpez-Ferreras, ”Road-Sign Detection and Recognition Based on Support Vector Machines,” IEEE Transactions on Intelligent Transportation Systems, Vol.8, No.2, 2007, pp. 264-278.
- S. Sathiya, M. Balasubramanian, and S. Palanivel, ”Pattern Recognition Based Detection Recognition of Traffic Sign Using SVM,” International Journal of Engineering and Technology (IJET), Vol. 6, No. 2, 2014, pp. 1147-1157.
- S. B.Wali, M. A. Hannan, A. Hussain, and S. A. Samad, ”An Automatic Traffic Sign Detection and Recognition System Based on Colour Segmentation, Shape Matching, and SVM,” Mathematical Problems in Engineering (Hindawi Publishing Corporation), Vol.2015, No.250461, 2015.
- S. Lafuente-Arroyo et al., ”A decision support system for the automatic management of keep-clear signs based on support vector machines and geographic information systems,” Expert Systems with Applications, Vol.37, 2010, pp. 767-773.
- D. Kim, ”Prediction Performance of Support Vector Machines with Fused Data in Road Scene Analysis,” International Journal of Transportation, Vol.3, No.3, 2015, pp.41-48.
- C.C Lin, C.W Lin, D. Huang, and Y. Chen, ”Design a Support Vector Machine-based Intelligent System for Vehicle Driving Safety Warning,” 11th International IEEE Conference on Intelligent Transportation Systems, 2008, pp. 938-943.