
The Model Development of an Effective Triggering System of Production Kanban Size towards Just-In-Time (JIT) Production
Volume 3, Issue 5, Page No 298-306, 2018
Author’s Name: Mohd Norzaimi Che Ani1,a), Shahrul Kamaruddin2, Ishak Abdul Azid3
View Affiliations
1Manufacturing Section, Universiti Kuala Lumpur – Malaysian Spanish Institute, 09000, Kedah, Malaysia
2Mechanical Department, Universiti Teknologi Petronas, 32610, Perak, Malaysia
3Mechanical Section, Universiti Kuala Lumpur–Malaysian Spanish Institute, 09000, Kedah, Malaysia
a)Author to whom correspondence should be addressed. E-mail: mnorzaimi@unikl.edu.my
Adv. Sci. Technol. Eng. Syst. J. 3(5), 298-306 (2018); ![]() DOI: 10.25046/aj030535
DOI: 10.25046/aj030535
Keywords: Effective Kanban size, Triggering System, Dual feeders, Just-in-Time (JIT), Waiting time

Export Citations
The contents of this article consist of an extension original work presented at the 4th International Conference on Control, Automation and Robotics (ICCAR 2018) and aims to develop the systematic model of an effective triggering system of production Kanban size towards Just-In-Time (JIT) production system. The developed model was introduced based on the philosophy of continuous improvement program by selection of case study industry in automotive manufacturing floor and it has been carried out through the development of an effective material Kanban size model using triggering system towards achieving a JIT production system. This developed model was analysed and verified by implementing through three phases which are the investigation of the Kanban size, analysis the production idling time and analysis of the time management for material replenishment process. The implementation was carried out to ensure the main objectives of the developed model in minimizing the waste of waiting through effective Kanban size for production system will be achieved by focusing on the communication between material incoming warehouse and production floor. The significant results were obtained during the verification process where the dual material feeders were identified for every process in the production floor to ensure the effectiveness of the production system. Throughout the implementation of the developed model, the production losses time caused by miscommunication between the production floor and warehouse had been identified and it was successfully minimized and the waiting time was reduced by 36.64%.
Received: 30 July 2018, Accepted: 02 October 2018, Published Online: 12 October 2018
1. Introduction
In the current revolution of the production system, the crucial issues of efficiency and effectiveness of manufacturing flow are the main challenges in meeting the demands as expected by the customer. Jasti and Kodali [1] have stated in their study, in encountering this challenges, the main requirement in fulfilling customer expectations is industrial practitioners required to accelerate their corrective action by performing continuous improvement program to survive and increase the competitiveness. One of the effective approaches practiced by automotive industry is Lean Manufacturing (LM) concept which is pioneered by Toyota Production System (TPS). The ultimate goals of LM concept are eliminated the wastes of operation in between process to process in manufacturing plant and ensure the smoothness of the production process to ensure the process flow are streamlined and efficient [2]. The LM concept was industrialized through the techniques of process improvement program by introduced a variety number of tools and proper methods to ensure the continuous improvements culture is adopted among the employees. TPS is targeted to eliminating or minimizing all type of identified wastes and smoothing the production flow by utilizing the LM philosophy known as Just-in-Time (JIT) and Jidoka or also known as production leveling [3]. JIT production system developed by TPS is an efficient concept with the main aim to minimize the production lead times within operation of production floor as well as quick response times in solving any arising issues between process to process, or communication between material supply chain system [4]. The main purpose of JIT system is to increase the smoothness of production flow and minimizing the overall costs of manufacturing operation covering minimization of the reject rate between process to process, optimizing the resources of production floor including space allocation for required processes, movement of the direct and indirect workers, standardization of the raw material inventory and synchronization of the internal and external transportation [5].
As introduced by TPS, LM concept focusing on the seven types of production wastes known as transportation, inventory, motion, waiting, over-production, over-processing, and defects. In the group of seven types of wastes, the most critical waste in influencing the efficiency and effectiveness of production flow is managing the inventory. Inventory means the management of raw materials from the warehouse into production floor or semi-finished products between process to process in production floor chain system, normally called as Work-in-Progress (WIP). Ineffective coordination and controlling of the WIP in the production floor causing the number of inventory will keep increasing and queues of the raw material prior transfer into production floor causing the waste of waiting in between process-to-process. As introduced by TPS in solving this issue, the LM concept has been introduced through implementation of the Kanban system. Kanban is a Japanese word was introduced in the scheduling system of raw material management for LM concept and JIT production system and it works as a management and controlling the inventory system either between production floor and raw material warehouse or management the internal supply chain which is controlling the WIP between process to process in production floor [6, 7]. As current practice, most of the automotive industries was implementing the Kanban system and the main benefits was obtained is ability to standardize an optimum limit or quantity of the inventory or WIP and preventing tasks of overloading during performing production processes, or also known as minimizing the 3M (Muda, Mura, Muri) [8]. LM concept well accepted and recognized by most of the industrial practitioners in the worldwide based on fruitful accomplishment in TPS especially controlling the inventory through one piece flow activity especially in automotive industries. However, the implementation of the one piece flow activity in di different types of industries is impossible as implemented by TPS because of several factors such as distance and location between suppliers and customers, facilities of the transportation system, a designed system of production flow and the availability of the facilities inside production floor. In tackling this issues, an effective WIP system through standardization of Kanban size was introduced with the main purpose to ensure effective management of holding inventory and minimize the waiting time in the production floor [9, 10].
In the current scenario, as practiced by the majority of the industrial practitioners in improving the efficiency and effectiveness of production system through implementation the Kanban system, but unstandardized numbers of inventory due to multiple products in production floor is required and it was caused miscommunication between production floor and incoming material warehouse due to inefficient inventory management system. Even though Kanban system widely applied in automotive industries but the main issue facing by automotive industry is to every single unit of finished-good vehicle needs thousands number of raw materials or semi-finished product and dealing with the various level of suppliers [11]. Hence, a direction of this research paper, the implementation of the Kanban system using an effective number of feeders by standardizing Kanban size for in-house production floor has been developed and introduced. In ensuring the effectiveness of the developed Kanban system, the “triggering system” of management WIP was initiated to ensure production floor meeting the principles of JIT production system.
The focus of this paper is directed towards various literature that discussed the implementation of Kanban system in manufacturing system especially the inventory interaction between the incoming material warehouse and production floor. The first objective is to identify the critical success factor of achieving the optimum efficiency and effectiveness of production system by exploring the mechanism of the production flow. For a second objective, even though the Kanban system has been successful in manufacturing industries and widely recognized, but as the issues in effective communication between an incoming material warehouse and production floor are usually overlooked, the effective triggering system production Kanban size is introduced. In this paper, Section 2 describes the concept of production system to identify the critical area of influencing production efficiency and effectiveness, Section 3 presents on the development of the Effective Triggering System Production Kanban Size model, Section 4 presents the results and discussion of model verification in selected case study, and Section 5 concludes the overall results of the developed model.
2. The Concept of Production System
In this section, the current concept of the production system in various manufacturing industries of the production system will be discussed and explored. Since the production system is the main subject in manufacturing industries, the production efficiency and effectiveness must be closely monitored and performed to ensure the organizations meet the customer expectation and become competitive with other competitors. As indicated in the era of global competitiveness, the manufacturing organizations are enduring enormous pressure from their customers and competitors [12]. All these factors have given means to integrate the effective system of production flow with the complete production process (starting from the suppliers to the delivery to the customer) [13].
Expanding the inductive research approach, the attention has been focused on the flow of the production system according to the general factory set-up from various industrial sectors. That means, practically, the production system can be segregated into three sections; incoming raw materials, production processes and outgoing finished good product. In general interpretation, the production system can be summarized as input, process, and output. The input consists of incoming raw material, known as downstream area, which requires multiple numbers of tasks to ensure supplying the right parts at the right time into the process. The process in the production floor involves multiple numbers of sub-processes of semi-finished product and the process is continued until product completion. The output consists of inspection, packaging and shipping the good product to the customer based on the order in outgoing section.
2.1. Key Elements of Production System
As the production system can be generally divided into three sections, the key elements of the production system involving all these sections. For input, the management of the raw material begins with the preparation of the raw materials either semi-finished product from sub-contractor or the child part from suppliers. A verification process of the raw materials by OEM normally goes through acceptance sampling analysis to ensure that raw materials meet the specification [14]. Acceptance sampling involves the process of inspection and testing of the product. A sample of goods is taken randomly from the lot or batch and a decision is made whether to accept the raw materials from suppliers based on the results of acceptance sampling and it will determine whether a batch of the raw material of goods should be accepted or rejected [15]. Once the quality of raw material is confirmed, it will be stored in warehouse storage area for the inventory purpose. The raw material will then be retrieved from the storage area, and the assigned worker will perform the preparation activity to ensure the specification quality and quantity according to the order from production, and this whole process is known as an upstream process. The raw materials will be temporarily parked at designed area, normally called kitting area or Work-in-Progress (WIP) area, with the purpose of the replenishment process. At this stage, the raw materials are now ready for use in production processes.
The next element is process, also known as midstream process, which means the raw materials will be processed from raw materials or semi-finished products. The production process is concerned with transforming a range of inputs into outputs as required according to the customer [16]. In the production processes, normally the Statistical Process Control (SPC) will be applied to ensure the finished product meets the specification. SPC is a statistical technique used for measuring, analyzing and controlling process variation in order to prevent defects or non-conformance in products. SPC involves inspecting a random sample of the output from a process and it will decide whether the process is producing products with characteristics that fall within a predetermined range [17]. Abnormality results from the SPC process will lead to the process improvement activity in order to solve the issue. After production processes are completed, and then the finished product will be transferred to the next section which is the output.
In the output stage, also known as a downstream process, the product will involve with the specific package which are packaging and shipping [18]. The finished product will be packed according to the customer expectation and at the same time, the assigned worker will perform the visual inspection to ensure that the finished product is free from defects. Some of the issues might arise at this stage such as cosmetic issue due to handling process and lead time. After completing the packaging process, then the finished product will be transferred into the transportation system for the shipping process. The production system is considered completed once it reaches the stage of shipping.
2.2. Issues pertaining to the elements in Production System
In the current global scenario, the competitiveness in the manufacturing industries keeps increasing as the customers ask for the minimization of the operation costs and increased quality of the product at the same time [19]. In order to ensure meeting this situation, the efficiency and effectiveness of production system play main roles in improving the production system and at the same time minimizing the cost of operation. To achieve these objectives, the whole chain of the production system, upstream, midstream and downstream, should the improved. This is also highlighted by Lean Manufacturing (LM) approach, where the process improvement should be studied from suppliers to customers [20]. Since the upstream section is the predecessor process for the production process, it should be prioritized to achieve optimum efficiency of the production system. Even though the upstream process is typically seen to play a minor role in the production system, it affects the lead time, part shortage, part mixing or product failure, which leads to inefficient production. Thus, the upstream process must achieve high efficiency, reliability and traceability to ensure the parts transferred into the production process meet the expectation.
In achieving high efficiency of communication for the upstream process, the synchronization interaction between warehouse and production must be effective in term of planning daily production required, quality requirement and time management of raw material replenishment process. Usually in achieving effective synchronize communication, the process of internal supply chain between warehouse management and production floor will be connected using inventory control system [21]. The chain of the production process was started with warehousing because it is the first section in the manufacturing process which is responsible controls physical of the receiving material and it performs the material verification tasks during the process of receiving from suppliers or vendors, incoming material sampling analysis and segregating the raw material before transferring into the production floor. The management of the warehouse must know the physical shape of the raw material and also know all information of the time and place of supplying raw material into production floor. The process of monitoring and verification of the raw material inventory is about the measurement of the critical parameters and quality inspections for achieving an effective management of the inventory [22]. Inefficient inventory management in the upstream process will be caused interruption of the whole production flow and it can lead to high stoppage time, increasing the production lead times, congested queues of transferring raw materials, smoothness of product flow and increasing costly operation setups [23].
3. The Development of Effective Triggering System of Production Kanban Size Model
In order to ensure achieving the optimum efficiency and effectiveness of production system, an effective triggering system for Kanban management system was developed and introduced in this research-based philosophy of continuous improvement program through three phases. The first phase required analysis of Kanban size then follows by the second phase consists of the investigation of the production idling time using queuing analysis and third phase the material preparation ‘triggering system’ was introduced. The framework development of an effective triggering system for Kanban management system is illustrated in Figure 1.
Based on the framework illustrated in Figure 1, in the first phase, the analysis of the production Kanban size was properly carried out in ensuring achieve the optimization of the material replenishment cycle through minimizing the production losses time during raw activity of raw material replenishment. During executing this phase, the actual size of production lot size is required to be identified to ensure determination of the suitable number of production lot size achieving the optimum solution. The number of the production lot size considered same from day-to-day production operation based on long-term production planning but the quantity of the raw material or semi-finished products from suppliers would be different due to the production requirement as daily planned by production planner. In the determination of an effective production Kanban quantity, the reliable information on the individual process cycle time from production floor and raw material preparation per unit of the finished-good product were needed to ensure the accuracy of calculating the effective Kanban size as formulated in Equation (1).
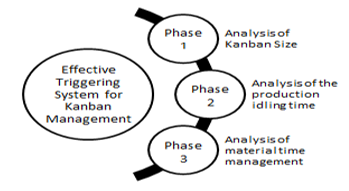 Figure 1. The framework development of effective triggering system for Kanban management system
![]() The Kanban size was identified to ensure planning of the upstream process in proper manner. Once the Kanban size was determined, the analysis of every motion performed by warehouse personnel for the upstream process will be analysed. The worker will be performed the assigned tasks to complete the material preparation process and time will be recorded. Since the warehouse activities and production floor normally set-up based on segregated building, the traveling time from the warehouse into the production floor must be considered in motion time study analysis of material preparation activities. This situation created the waste of transportation and the production process will be interrupted during the material replenishment process.
The Kanban size was identified to ensure planning of the upstream process in proper manner. Once the Kanban size was determined, the analysis of every motion performed by warehouse personnel for the upstream process will be analysed. The worker will be performed the assigned tasks to complete the material preparation process and time will be recorded. Since the warehouse activities and production floor normally set-up based on segregated building, the traveling time from the warehouse into the production floor must be considered in motion time study analysis of material preparation activities. This situation created the waste of transportation and the production process will be interrupted during the material replenishment process.
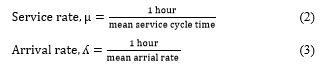
Once the Kanban size has been determined in Phase 1, then in the following phase which is Phase 2 the application of the queuing system theory will be used to analyse the production idling time for each process in production floor with the purpose to identify the wastes of production waiting time. The queuing theory model consisted of mathematical study based on the application of the probability concept to identify the production waiting time, or idling time-based on the queuing behavior of raw material management [24]. The application queuing theory model was considered in this research, because in the queuing analysis theory, the queuing behavior will be counted as raw material queues waiting for prior transfer into production floor is based on consideration of the production processing time and cycle of raw material replenishment from warehouse into production floor, and both of the parameters are then will be converted into hourly service rate, known as µ and hourly arrival rate, known as ʎ. The determination for both µ and ʎ were analysed based on Equations (2) and (3).
 In queuing system theory, a customize model of queuing behavior is constructed to determine the queue lengths (number of inventory) and the waiting time (production idling time) that can be predicted based on systematic analysis of queuing behavior either single queuing behavior model or multiple queuing behavior models. As practiced by most of the industries, normally production floor where the process-to-process in connected and receiving the raw material from the warehouse, the material preparation activity in warehouse considered as a supplier for production floor. Based on this condition the single queuing is more suitable for the further analysis. Single queueing theory model normally practices by using Kendall’s notation in the form A/S/C where A describes the time arrivals to the queue, S the size of queues and C the number of servers or counters at the node [25]. Even though the single theory model required a single queues length and single server, but multiple situations of queuing behavior are possible to adopt. Based on available theories of algorithms for basic single theory model, several conditions have been identified such as basic single server, constant or undefined service time, finite queuing line and finite calling population. The selection of an application for each condition depending on the activities conducted in queuing behavior. Shortle et al. [26] were segregated the group of basic queuing theory as summarized in Table I.
Table 1: Type of queuing system
Theory of Queuing System Queuing Behavior
Algorithms
Single server Basic single server Determined cycle
time
Single server Undefined or constants Undefined or fixed
service time cycle time
Single server Finite queuing line Finite input
Single server Finite calling population Finite server
Multiple server Multiple servers Multiple similar waiting line servers
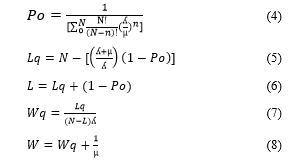
Once a single model of the queuing system was determined, then detailed analysis using probability theory in queuing analysis system will be carried out. In queuing theory, generally five main parameters will be analysed which are the probability the server is idle (Po), the average of number of customer in the queuing system (L), the average number of customers in the waiting line (Lq), the average time a customer spends in the total queuing line (W) and the average time customer spends waiting in the queue to be served (Wq). As practiced in the production system, smoothness interaction between warehouse and production floor is required, the definition L and W was customized to suit with a production system. L was defined based on the number of production processes waiting to be completed for material replenishment activity in production floor, while W was defined as an average time the production process waiting for completion of the material replenishment activity. Subsequently, the determination for both of the L and W will be based on the identified service rate, µ, and arrival rate, ʎ as mentioned earlier. Since this research focusing on the material replenishment process versus the production system, the most significant queuing behavior system was finite calling population as indicated in Table I. It was used in this research because the main constraints during material replenishment activity is the quantity of material feeder where is considered as terminal or server and the production processes considered as customer for the warehouse during replenishment activities. Furthermore, in ensuring the reliability of the determination of both L and W, the number of entire processes in production floor also considered. The determination for both L and W for finite calling population queuing system was formulated as Equation (4) until Equation (8).
 Successful implementation and completion of Phase 2, the ‘triggering system’ for effective management of WIP will be developed in the third phase. In this phase, time management analysis of inventory planning was carried out in determination the cycle time of WIP ‘triggering system’ in ensuring sustainability of the developed production Kanban system towards achieving optimum efficiency and effectiveness of production system. Hence, in this phase, the raw material replenishment time from warehouse and cycle was determined based on the daily production scheduling and planned operation hours to ensure the effective preparation time of warehouse activity. The identification of the cycle for material replenishment activity will be determined based on planned working time per days such as a number of working shifts and the daily targeted output as per planned by production planning. Once the material replenishment cycle and time was identified, then the traffic management for movement of raw material activities in production floor could be identified to ensure smoothness of material replenishment process. This is important because the process of transferring the raw materials from the warehouse into production floor required high repetitive movements and traveling due segregated warehouse and production floor from different buildings. In this phase, the proper management of internal transportation system is required by implementing visual management system such as color coding and alarm system.
4. Results and Discussion of Model Development
The selected case study industry for this research is an automotive manufacturing industry which operating the process of assembling the car. The production system was designed using single production assembly layout with connected from process-to-process and the entire production floor and it was divided into five sections which are a trim section, chassis section, final assembly section, accessories assembly section, and final inspection section. The raw material warehouse was segregated from the different building which is next to the production floor building and the material preparation and acceptance sampling process were performed in the warehouse building and it will be transferred into the production floor based daily production planning. Each section in the production floor and warehouse management was managed by the different groups of management and it needs an efficient material preparation activity during establishment the smoothness of production system.
Since the processes of production floor in the selected case study was set-up based on five sections, one of the section will be selected as initial improvement area to be conducted to verify the developed model in this research. Even though five sections is required in assembling the car, but only three sections were considered and possible conducting the improvement activity of verification process, which are Trim section, Chassis section, and Final Assembly section. These three sections were identified as potential sections in influencing unsmooth production process due to interaction with the multiple types and quantity of raw materials from the warehouse. The other two sections which are Accessories Assembly and Final Inspection were not involved with replenishment of raw material because only conducting the process of checking and verification of finished-good product and it was considered as a stand-alone process. Based on the several criteria, Trim section was selected and in implementing the developed model as a case study for this research. The Trim section was selected according to two criteria which are this section considered as a predecessor for overall production chain system because it was set-up as first process and the failure or inefficient process of Trim section would be interrupted the entire production flow. Furthermore, which is the second criterion in the selection of Trim section because a number of the assembly sub-processes was the highest compared to the other two sections.
Table 2: Result of motion time study for material preparation activity in warehouse
Activity Cycle time (Minutes)
- Unboxing 00
- Quality Inspection 00
- Segregation 00
- Material arrangement 00
- Transferring process 00
Total Cycle Time : 40.00
Currently, as practice by selected case study industry, the Trim section required nine sub-processes, while Chassis and Final Assembly only required six sub-processes for each section. Means, 21 assembly processes are required to assemble a finished-good product. A higher number of sub-processes in production floor meant it required a higher number of raw materials. Based on this supported condition, the Trim section was finalized as a selected section to implement the developed framework of effective Kanban system.
In Phase 1, motion time study of material preparation activities in the warehouse has been observed using motion time study analysis which are every step of activities was measured and the results show the required cycle time in of material preparation averagely at 40 minutes to complete a set of raw material for a single unit of finished-good product. The cycle time of material preparation was defined based on detailed analysis as shown in Table 2. This information would be used in this phase for the determination of the effective Kanban size.
Once the process cycle time of material preparation in warehouse activity was determined, then the cycle time of production processes was analysed using motion time study analysis in production floor. The motion time study was captured and compiled based on detailed activities for every process was analysed to determine the actual process cycle time with the purpose to calculate the effective Kanban size. The selected production layout was identified consists of 25 processes from five sections to complete a single unit of finished-good product. All related activities and detailed motions practiced by the workers for every process was captured using a stopwatch during the workers performing their tasks and the captured results of the motion time study for the entire processes was converted into average as shown in Table III. As presented in Table III, from the entire 25 processes, the sub-process sequence number 14 was identified as the bottleneck process because it is required 47.25 minutes. This cycle time was considered as the production cycle time because it was identified the highest cycle time compared to others processes. As mentioned earlier, from entire 25 processes, only 21 processes were considered in determination of the effective Kanban size because that processes involved with material replenishment and the other 4 processes (process 22 until sub-process 25) were verification, checking and testing process without involvement of raw material replenishment process and the average process cycle time of these 21 processes is 37.63 minutes. That means, averagely every 37.63 minutes production processes required to replenish with a new set of raw materials from warehouse regularly based on the planned production output.
Table 3: Result of motion time study for selected production layout
Process 1 2 3 4 5
Time (Min) 40.51 22.50 45.20 42.38 32.34
Process 6 7 8 9 10
Time (Min) 36.42 40.16 45.25 42.37 42.20
Process No. 11 12 13 14 15
Time (Min) 47.20 45.00 47.20 47.25 45.56
Process No. 16 17 18 19 20
Time (Min) 25.52 35.00 26.20 25.22 35.00
Process No. 21 22 23 24 25
Time (Min) 47.00 10.00 10.00 8.00 8.00
Successful identification of the production cycle time and warehouse cycle time, the Kanban size was calculated by using Equation (1) as mentioned in the previous section. As derived by Equation (1), the optimum Kanban size was then identified at 0.85 units or can be roundup into 1.0 unit. The results of calculated Kanban size represents material replenishment with minimum Kanban size of 1 unit was required in production floor in order to complete one unit of finished-good product in every process for current production floor as planned output by production floor. The internal transportation activity between warehouse and production floor required raw material trolley as a material handler, as in material replenishment activity, and it known as a material feeder. Based on identified information of Kanban size, then the queuing system theory was conducted in the following phase to analyse the production waiting time during material replenishment processes.
Since the production floor only required a single unit of the material feeder to operating the production processes, the comparison in term of production waiting time was made by increasing number of the material feeder into two units, known as dual feeders. The two units of material feeders were identified based on an assumption of the change-over process which is one of the material feeder was considered as work-in-progress (WIP) during performing an assembly process by production personnel and the other one feeder was parked as standby area for replenishment purpose. Means, each process of production floor was occupied with two material feeders. During the operation of the production system, the emptied material feeder would be transferred into the warehouse for performing the material preparation activity. In the material preparation activity, some processes are required such as unboxing, quality inspection, material segregation; material arrangement and transferring into production floor are required to ensure the requirement was met. At the completion of the first phase, Phase 2 was performed using queuing analysis theory to analyse the waste of production waiting time.
The queuing system analysis was conducted in the selected section of case study analysis based on the determined service rate and arrival rate as identified from process cycle time of production floor and material preparation in the warehouse. The verification process in the determination of the optimum number of the material feeders was simulated based on two conditions based on calculated effective Kanban size from the previous section. Based on the results of Kanban size is 1 unit per feeder, and then the simulation was decided based on two conditions which are a single feeder and double or dual feeders. The results were obtained from this simulation was then analysed by comparison on the average waiting time or idling time of production process due to material replenishment process. In the analysis of queuing theory system, the arrival rate known as ʎ according to the capacity of the hourly arrival rate of raw materials from the warehouse into production floor. As identified from previous phase, the warehouse only can supply the raw materials from warehouse into production floor at every 40 minutes, and then it was converted into hourly service rate of material replenishment known as µ at 1.5 by using Equation (2). Then, the arrival of raw material from the warehouse was converted into hourly arrival rate known as ʎ by using Equation (3) resulted as 1.69 based on one hour divided by production average production cycle time which is 37.63 minutes as presented in Table 3 earlier. Then, the optimum number of the material feeder was determined to minimize the wastes of production waiting time or idling time by comparing the idling time between a single feeder and dual feeders as simulated. Based on the results of both conditions, the arrival rate could be different from single and dual feeders because increasing number of material feeder during material replenishment process, simultaneously decreasing the cycle of material replenishment process. This situation required to further analyse of cycle time for material replenishment process and converted into service rate, µ and the results show increasing from 1.5 into 3.0 as using Equation (1). This situation occurred because dual feeders required multiplying by two and the service rate, µ as summarized in Table 4.
Table 4: Result of queuing analysis
Variables
Feeder Service rate, µ Arrival rate, ʎ No. of processes, N
Single 1.5 1.69 21
Dual 3.0 1.69 21
The results presented in Table IV then were then further investigated to analyse the wastes of production waiting time by application of Equation (4) until Equation (8) as mentioned in the previous section. Both of the feeders systems were then analysed in details to ensure the justification of the most effective system for material preparation frequency with the purpose of waste elimination and minimizing the production idling for achieving JIT production system and smoothing the production flow. The results of the comparative analysis between both feeders systems were calculated as presented in Table 5.
Table 5: Result of feeder comparison
Parameter Single feeder Dual feeders
L 19.11 18.22
W 6.66 4.22
Based on the result obtained from Table V, according to number processes in production floor consisted of 21 processes, the average number of process waiting to be replenished by the material handler is 19.11 processes by using a single feeder. That means that once the raw material was emptied in any process in production floor, the subsequent process needs to wait the next cycle of replenishment process for required to wait completion of replenishment process for another 19.11 processes to fulfill its request. Translating into cycle time, it could be interpreted as a average individual process in production floor waiting to be replenished by a new set of raw material is 6.66 hours per cycle of raw material replenishment process. Simulation of single feeder impacting the production losses time or stoppage time due to the waste of waiting is 6.66 hours per day. Comparing with the simulation results using dual feeders of material replenishment, the average number of production waiting time to be replenished is 18.22 processes, while the average production waiting time to be replenished is 4.22 hours. Both of the simulation results were then compared in term of production lost time or stoppage time. Since dual feeders is only 4.22 hours per day instead of 6.66 hours per day by a single feeder and it was chosen as effective Kanban size based on elimination 36.64% of the lost time or production stoppage. The results of queuing analysis was presented the dual feeders is an optimum number of material feeders to meet the production requirement because of reducing the waiting time at 36.66% in production floor and simultaneously increasing the production capacity. This situation improved the production efficiency in term of capacity planning because closing the gap between actual production outputs versus planned production output.
Once an effective Kanban size and material preparation frequency was determined in the first phase, and number of optimum material feeders was identified in the second phase, then in third phase, the process of standardization was carried out in the production floor by using visual management concept to ensure achieving and sustaining the optimum production efficiency and effectiveness towards JIT system. As resulted from comparison simulation results from single and dual feeders, a number of material feeders was identified as dual feeders because it was recognized as the most effective. Accordingly, the comparison of the number of production output for both situations; single and dual feeders also were analysed. Application of the single feeder, production floor required planning for the stoppage time is every 6.66 hours due the material replenishment activity and the planned production time for this case study industry is 8 hours per day, means the effective production time only 1.34 hours or 80.40 minutes per day which is during material replenishment process, the production was idling. This situation will be impacted on the actual output of production process where the production system can only achieve for 2 units per day based on the effective available time after deducting the lost time divided by bottleneck process as presented in Table III. Comparing by the implementation of the dual feeders for material replenishment process, the effective available production time will be maximized through parallel performing the job tasks during material replenishment process. Thus, the simulation results was recommended the dual feeders must be implementing during material replenishment process in production floor which is one feeder was considered “in-use” and another feeder considered “standby”. The implementation of the dual feeders for material replenishment process in production floor was eliminated the production stoppage time due to waste of production waiting for raw material to be replenished. The effective available production time was increased as planned 3.78 hours or equivalent to 226.80 minutes after deducting 4.22 hours of lost time or stoppage time from planned production time 8 hours. The production output was drastically increased by 150% which is from 2 units into 5 units per day based on calculation from 3.78 hours available hours divided by identified production bottleneck cycle time which is 47.25 minutes as resulted from Table III.
The determined number of optimum material feeders indirectly identified the number of production Kanban size. To ensure synchronize communication between an incoming material warehouse and production floor, the optimum the number of Kanban size must be similar with number of material feeders. Since dual feeders is an optimum solution for material replenishment process, the Kanban size also suggested as 2 units similar to the number of material feeders to ensure synchronize communication and maximizing the production efficiency. According to Kanban size of 2 units per lot and current production capacity only produced 5 units per day based on eight hours production planning, 1,400 units of finished good products will be achieved per year with planned working days is 280 days. Based on this result, the number of the cycle for part replenishment was determined three cycles per day formulated from the comparison between daily production planning and Kanban size. Three cycles of material replenishment at production floor is mandatory for everyday activity according to dual material feeder concepts and production forecast. The three cycles meant the upstream time cycle of the process must be at every 2.67 hours according to the derivation from available time, 8 hours per day and cycle required, 3 cycles per day.
Based on the observed time, the result showed that the cycle time completion for one cycle of an upstream process according to the seven tasks was 40 minutes, as defined in Phase 1. It meant the material preparation process time per Kanban size or per dual feeders required 80 minutes per cycle upon verified by supervisor and the feeders were then transferred to the production area.
In the process of maintaining the sustainability of the improvement process for material replenishment process, the routing of the material replenishment feeders was designed for easy and quick detection of empty feeder based on designed “triggering system” from the previous phase. The suitable area in the production floor was marked with “ready-in-use” for parking the materials feeder and it was located in the dedicated area known as WIP area. The main purpose of floor marking is for easy triggering by production personnel and ensure on the readiness of the raw material to be used once required. The location of emptied feeder also was designed and located at the next to each process of the production floor and close to the pathway. The identified area in the production floor was marked with “vacant” and using red color marking to trigger the emptied feeder during the replenishing process. Once the emptied feeder triggered by the material handle, then he/she would be communicated with warehouse personnel for the preparing of raw material according to triggering production process. Since the finite frequency of material preparation cycle was applied in production floor, the scheduled time of each cycle for the material preparation was identified based on three cycles of per day as planned by production floor. All the three cycles of replenishment time were defined and fixed on 09:20 am, 12:00 am and 03:40 pm every day to maximize the production output as shown in Table 6.
Table 6: Part preparation scheduling for triggering system and comparison between single and dual feeders
Time 08:00 09:20 12:00 15:40
Replenish Cycle 0 1 2 3
Achieving efficiency and effectiveness of production system required a systematic approach of wastes elimination. In actual industrial practices, most of the industries performed their continuous improvement activities to improve production efficiency by implementing a Kanban system as benchmarked by LM. But, inefficient determine the Kanban size causing miscommunication between the production floor and warehouse which is created the waste of production waiting time. In order to solve this issue, this research was developed and implemented to ensure an effective way in the determination of the production Kanban size will be achieved through calculated effective number of feeders and develop the triggering system of the material replenishment activity. The main focuses of this research is in an automotive production system which is automotive manufacturer required dealing with thousands number of the raw materials from multiple levels of suppliers or vendors. This condition required optimum efficiency and effectiveness of interaction between process to process and suppliers to customer to ensure synchronization of interaction are achieved. Using the developed approach of effective Kanban size, the wastes of production idling causing waiting to be replenished was drastically improved by 36.64% and indirectly optimized material replenishment process and the production output was increased from 2 units into 5 units per day.
Achieving optimum efficiency and effectiveness of production system is the main goal of any management organization in industrial practices as practices through continuous improvement program, but the lesson learned from this research is that the continuous improvement program should not just focus on inside the production floor only, but outside of production floor also must be considered as potential area of improvement activity such as upstream and downstream processes. Organizations are strived to reduce the wastes of production system inside production floor as much as possible. Using this developed triggering system of production Kanban size, the production waiting has been drastically reduced and drives the production floor towards JIT production system. Widely continuous improvement activity focusing on the interruption time of the production process is expected in the long run after implementing the continuous improvement program in all related sections of the production system. As an encouraging result in this research through the development and implementation of the improvement model, the team decides to continue performing more improvement activities project for production floor for other sections in the future research. The positive results from this developed framework in this research, the impacts from obtained results also change the mindset of the industrial practitioners in avoiding “fire-fighting method” of tackling the production issues.
5. Conclusion
In this research article, the continuous improvement activity in the manufacturing industry concentrating on inventory management has been conducted by introducing and implementing the model of effective Kanban size. The developed model was verified and implemented in the selected case study and the obtained results were analysed through utilizing the number of optimum material feeders according to calculated effective Kanban size and analysis of the production idling time using queuing system theory. Two conditions of material replenishment activity were simulated and analysed which are single and dual material feeders in order to achieve JIT production system. The behavior of the production system through communication between warehouse and production floor was investigated in order to ensure the accuracy and reliability of the improvement process. The ultimate objectives are to ensure the implementation of the Kanban system using an effective number of material feeders for production floor achieving optimum efficiency and effectiveness. To ensure sustainability of the developed model the WIP “triggering system” was introduced based on time management and visual management. Successful implementation of the developed framework of an effective Kanban size based on an effective quantity of feeders and triggering system leads production system eliminating the wastes of waiting by 36.64%. In overall, the results of this research was meeting the research objectives which are effective communication between the incoming material warehouse and production floor was developed through designing the effective Kanban size and the systematic triggering system was introduced based on effective scheduling of material replenishment process.
Acknowledgment
The authors acknowledge the YUTP-FRG grant (0153AA-E36) provided by Yayasan Universiti Teknologi Petronas (UTP), Malaysia for funding the study that resulted in this article. Also highly appreciation extended for selected case study industry and anonymous reviewers for the comments and advises given which lead to the significantly improved the quality of this research article.
- N. V. K. Jasti and R. Kodali, “Lean production: literature review and trends,” International Journal of Production Research, vol. 53, pp. 867-885, 2015.
- S. Bhasin and P. Burcher, “Lean viewed as a philosophy,” Journal of manufacturing technology management, vol. 17, pp. 56-72, 2006.
- J. K. Liker and J. M. Morgan, “The Toyota way in services: the case of lean product development,” The Academy of Management Perspectives, vol. 20, pp. 5-20, 2006.
- K. Amasaka, ““New JIT”: A new management technology principle at Toyota,” International Journal of Production Economics, vol. 80, pp. 135-144, 2002.
- R. R. Fullerton and C. S. McWatters, “The role of performance measures and incentive systems in relation to the degree of JIT implementation,” Accounting, Organizations and Society, vol. 27, pp. 711-735, 2002.
- W. J. Hopp and M. L. Spearman, “To pull or not to pull: what is the question?,” Manufacturing & service operations management, vol. 6, pp. 133-148, 2004.
- B.-R. Lea and H. Min, “Selection of management accounting systems in Just-In-Time and Theory of Constraints-based manufacturing,” International Journal of Production Research, vol. 41, pp. 2879-2910, 2003.
- E. Lander and J. K. Liker, “The Toyota Production System and art: making highly customized and creative products the Toyota way,” International Journal of Production Research, vol. 45, pp. 3681-3698, 2007.
- B. Rouwenhorst, B. Reuter, V. Stockrahm, G.-J. van Houtum, R. Mantel, and W. Zijm, “Warehouse design and control: Framework and literature review,” European Journal of Operational Research, vol. 122, pp. 515-533, 2000.
- Y. Monden, Toyota production system: an integrated approach to just-in-time: Productivity Press, 2011.
- Z.-L. Chen, “Integrated production and distribution operations,” in Handbook of quantitative supply chain analysis, ed: Springer, 2004, pp. 711-745.
- ] H. W.-c. Yeung, “Regional development and the competitive dynamics of global production networks: an East Asian perspective,” Regional Studies, vol. 43, pp. 325-351, 2009.
- A. Gunasekaran, C. Patel, and R. E. McGaughey, “A framework for supply chain performance measurement,” International journal of production economics, vol. 87, pp. 333-347, 2004.
- C.-W. Wu and W. L. Pearn, “A variables sampling plan based on C pmk for product acceptance determination,” European Journal of Operational Research, vol. 184, pp. 549-560, 2008.
- K. Dumičić, V. Bahovec, and N. K. Živadinović, “Studying an OC curve of an acceptance sampling plan: a statistical quality control tool,” in 7th WSEAS International Conference on Mathematics and Computers in Business and Economics (MCBE’06), 2006.
- J. C. Aurich, C. Fuchs, and C. Wagenknecht, “Life cycle oriented design of technical Product-Service Systems,” Journal of Cleaner Production, vol. 14, pp. 1480-1494, 2006.
- C.-W. Wu, W. Pearn, and S. Kotz, “An overview of theory and practice on process capability indices for quality assurance,” International journal of production economics, vol. 117, pp. 338-359, 2009.
- M. Rother and J. Shook, Learning to see: value stream mapping to add value and eliminate muda: Lean Enterprise Institute, 2003.
- J. Knezevic and V. Narayan, “Business performance and maintenance: How are safety, quality, reliability, productivity and maintenance related?,” Journal of Quality in Maintenance Engineering, vol. 18, pp. 183-195, 2012.
- G. A. Zsidisin and L. M. Ellram, “An agency theory investigation of supply risk m anagement,” Journal of supply chain management, vol. 39, pp. 15-27, 2003.
- A. Sinclair and M. Monge, “Concept facility based on single-use systems, Part 2,” BioProcess Int, vol. 3, 2005.
- A. Neely, M. Gregory, and K. Platts, “Performance measurement system design: A literature review and research agenda,” International journal of operations & production management, vol. 25, pp. 1228-1263, 2005.
- M. Rosvall and O. Christensen, “A model for cost effective improvement of a raw material management in the inventory: A Case study,” ed, 2012.
- R. Nelson, Probability, stochastic processes, and queueing theory: the mathematics of computer performance modeling: Springer Science & Business Media, 2013.
- O. Handel and A. Borrmann, “Service bottlenecks in pedestrian dynamics,” Transportmetrica A: Transport Science, pp. 1-14, 2017.
- J. F. Shortle, J. M. Thompson, D. Gross, and C. M. Harris, Fundamentals of queueing theory vol. 399: John Wiley & Sons, 2018.