A Ubiquitous and Configurable Wrist-Worn Sensor Node in Hazardous Gases Detection

Adv. Sci. Technol. Eng. Syst. J. 3(5), 248–257 (2018);
 DOI: 10.25046/aj030530
The monitoring of environmental parameters is a critical topic in occupational medicine. With advances in technology, during the recent years, the wearable sensors are widely used to evaluate the ambient parameters. In this paper a compact, small, light-weighted, and configurable sensor node in three physical layers for prolonged chemical ambient monitoring is described. The device is designed and demonstrated by using MLMS (Multi-Layer Multi-Sensor) concept. The device application is not only limited to hazardous gas (CO & NO2) monitoring but physical ambient elements (air pressure, air humidity and temperature) and motion tracking are tracked, too. The device consist of integrated (ambient physical and motion tracking) and add-on sensors (hazardous gases) and enables centralized data processing. The integrated sensors are distributed on the middle physical layer on both sides (host platform). The host platform also includes micro controller and antenna for data transmission to the smartphone. The gas sensor along with the gas sensor driver board form the gas sensor node which for easy gas exposure is located at the top of the device and stuck at the top of host platform. The gas sensor driver is designed universally to be compatible with 3-lead gas sensors with low power consumption. This layer is replaceable and can be substituted with one more target gas (e.g. NO2 instead of CO). The sensor configuration and initialization is performed via sending commands from the smartphone to the device by the wearer. In addition, the device is equipped with the notification system (beeper and vibrating motor) for early user warning in an abnormal detected. The notification driver layer is located at the bottom of the proposed device. All physical layers are stuck on top of each other appropriately through a board to board connector. The collected data from integrated and add-on sensors are transmitted in various time interval to the smartphone for screening and logging. Filter design and calibration process are also briefly described in this work.
1. Introduction
1.1. Ambient air monitoring and wearable devices
Measuring hazardous and toxic gases such as nitrogen dioxide (NO2) and carbon monoxide (CO) in the environment (indoor/outdoor) and also meteorological parameters (atmospheric temperature, humidity and pressure) is usually expensive. Increasing number of elderly, and costly healthcare monitoring systems in hospitals from one side and high degree of penetration of wearable devices (applied to wide range of applications) in particular healthcare and tele-monitoring on the other side, attract much attention as a potential solution. This paper is an extended version of presented paper in [1]. The work is extended in terms of filter design, calibration process and providing more details. Furthermore, the device is configurable in the new version; switching between different gas sensors is possible through sending commands from the smartphone to the device.
Information on air-quality in urban environments due to cost of equipment and space is typically measured only in limited number of sites [2]. In recent years, wearable devices and technologies are being popular and demand is increasing for the application in ambient air monitoring. Especially employees who are working in chemical, biological or medical laboratories can be exposed to gases which might affect the individual performance and health. The form factor (wearability), enabling technology, accuracy, low cost and prolonged ambient monitoring are some of the most important criteria that can push and increase the penetration and popularity of the wearable devices in the environmental parameter monitoring. The non-linear response of the chemical sensors in ambient air monitoring, is significantly affected by the environmental conditions and the applied heating pattern for the sensor initialization [3], especially in the regime of the on-demand sensing including off-time periods [4].
Electrochemical gas sensors due to the acceptable merit and criteria are the adequate candidate to be the major player in a wearable/portable gas measurement device. These merits include the very low power consumption, high sensitivity, repeatability and mostly the electrochemical gas sensors from the wide and different range of families, approximately have a linear response under controlled conditions [5]. The linear response may extensively be useful in calibration and recalibration. Although, the gas sensors are relatively costly in personalized wearable device application, but recently it is getting closer to an affordable range, especially in mass production. In some cases, (e.g. Spec sensors) the life time of sensors are expected between 5 and 10 years.
One of the major contribution of this work is multi-parameters measurement, while the solution is still compact, small and wearable. In fact, the effort is placed to draw the attention from the 2-D design to 3-D. Therefore, z axis also is added to the calculation of prototype implementation. In this new concept known as Multi-Layer Multi-Sensor (MLMs), each physical layer is dedicated a particular function and these layers are stuck on top of each other. This would shrink the x-y plane size and slightly extend the altitude [6]. This concept deploys board to board connectors to link the layers.
The second important features of this work is the continuous monitoring for several hours without need of battery charge. This is accomplished through careful electronics circuit design and hardware selection. Where, of the critical application of ambient monitoring is in personal healthcare monitoring, thus a longer observation of ambient parameters may protect the individual health status for longer. In other word, the larger data acquisition database is, the larger information may be provided for health status analysis. However, as the tool is consist of the notification system, if the air is unhealthy, the warning signal is generated for protection.
Creating a data base and data analyzing for the health status of the individual long-term monitoring has become an aim to enable an early notification of individual health status by analyzing the large amount of collected data. The prolonged monitoring is the function of power consumption. The power mostly is dissipated by the driver, sensors and data transmission. As a consequence, the sensor selection, driver electronics circuit design and frequently data transmission to the smartphone (time interval) and sensor sampling rates, must be carefully investigated. Once the total energy consumed by the device is estimated, the battery should be selected which mostly determines overall size and weight of the sensors and therefore user’s convenience [7].
The gas sensor in this wearable is the most effective indicator in the final prototype in terms of form factor, power consumption and device performance. Conventional gas detectors including the most widely used (metal oxide), relatively small Pallisters require large power consumption (hundreds of milli-Watts to Watts) with slow response time (tens of seconds). The technical specifications for gas sensors, indeed for all sensors, are challenging, and typically [8]: small and light weight, low power (e.g. less than 200 mW), long life (e.g. 5 years), high selectivity (e.g. low cross sensitivities), range of operation -50 °C to +125 °C, range of operation between 5 and 95% relative humidity.
This paper is structured as follows: In section II some related research works are introduced. In part III, we concentrate on the proposed system architecture and the main components are described. In section IV, filter design, configurability and experimental results of a possible application scenario are presented to validate the efficiency of the proposed new multi-layer architecture design. Conclusion is summarized in section V.
1.2. Related works
With the great improvement in semi-conductor and wearable technology, the criteria for implementing a qualified device in the area of ambient monitoring in wearable devices are becoming more and more sophisticated to demonstrate. Multi-tasking operation, prolonged evaluation, flexibility and user friendliness are more crucial among others. In addition, flexibility in software and hardware extension for further development without starting from the scratch design, is a point that may not be forgotten. Future developments can upgrade the device with the latest technology development and move on the edge.
This section includes two general subsections: first the latest efforts by academic community is briefly described and after in the second subsection the available industrial tools in the marker are presented in this area of interest. The features, characteristics and most critical merits for each is addressed.
Crowd sensing is one of the major methodology in the ambient air screening, a sensor node by using this technique is presented by Oletic et al. in [9]. In this approach, the individuals are able to participate in the experiment by the infrastructure of a network of mobile sensors, to measure the factors. The device is a fixed structure sensor node with the constant and predetermined sensors which is powered on by a li-ion battery. The tool consists of two electrochemical gas sensors, temperature, and relative humidity and atmospheric pressure sensors. These sensors are sampled and data are transmitted to the smartphone with Bluetooth. In [10] Ritcher and et al. introduce a wearable environmental monitoring called Eco-Mini. This prototype is designed to investigate the feasibility of wearable device in ambient air monitoring in clinical studies. In this preliminary work, the wide range of toxic/hazardous gases (ozone, sulfur dioxide, volatile organic compounds) are evaluated in a predefined mode. Furthermore, noise, humidity, temperature, and ambient light color balance are monitored. In addition, motion tracking is performed through 3-axis accelerometer. This prototype also is equipped with location (GPS). In spite of advantaged and a wide range of monitoring, this device is suffering from some features and critical requirements. This first notable issue is the fixed structure which does not give the flexibility to the user to select the sensor according to the needful. Furthermore, Eco-mini is connected to a smartphone and stores the sampled data locally through a SD card. The wearability mode of this tool is the next concern (waist-worn) which may lead to daily routing activity user interference. Sanfilippo et al. in [11] is using Cooking hacks platform to perform an investigation. In this work the physical parameters are supported to the vital signs (blood pressure and heart rate) sensors to screen the broader range of parameters which play role in health status. The whole structure is wire based. The different sensors are communicating to the platform to transmit the data, these data are sent to the smartphone through Bluetooth Low Energy (BLE). The last device from the academic community in the first subsection is a wrist-worn watch that published by Haghi and et al. [12], [13]. This watch is introduced for monitoring several physical parameters (air pressure, temperature and humidity) as well as toxic/hazardous gases (CO, NO2). In addition, the motion tracking through 9 degree of freedom (DoF) by the gyroscope, accelerometer and magnetometer sensors is demonstrated. Tis device, deploy 3-lead electrochemical gas sensors to detect and evaluate the target gases. A notification through a beeper and vibrating motor are generated for user attention in abnormal status detection. In addition, the prototype utilizes BLE 4.1 to transmit the data to the smartphone in a predefined time interval.
In the second subsection which the attention is paid to the available industrial tools in ambient air monitoring, a brief description, advantages and disadvantages of each is outlined. In spite of costly devices in the market, these are mostly single task and parameter detector which are only produced for a particular gas detection. This makes these tools hardly affordable for the personal monitoring. However, this is not only obstacle. This gets critical when a user intend to detect several gases in different working places. Gas alert extreme device is introduced in [14]. This well-known device is an example of such devices. Gas alert is available in the market in a medium size and waist worn mode wearability. The device is already available for NO2 and measure the concentration of up to 5 part per million (ppm). This range is extended due to the nature of CO up to 1600 ppm. It’s equipped with alert notification and vibration motor as well. The disadvantages of Gas alert is lack of data storage in an external memory nor smartphone. The data are only observable through display and in real time.
In [15] Texas instrument (TI) introduces Single-Chip tool based on MSP430. This portable/ waist-worn is a single gas detector of TI and detects carbon monoxide (CO). Due to gas calibration, humidity and temperature sensors are integrated on board. Data storage in an external memory and real time data screening is of advantages in this costly TI product. This gas detector is provided in rectangular shape and is slightly larger than gas alert extreme.
The next presented industrial gas detector in this subsection is a circular single task product of TI. This evaluator is the CO gas detector [16]. This circular device with relatively high altitude that make it more portable than wearable, is capable of being connected to both Android and iOS. The gas detector has the capability of monitoring different hazardous gases by changing the sensor. Lack of display, external memory and notification system are the disadvantages. However, the device does not support any other physical parameters.
Jain et al. introduced a wearable environmental monitoring system (WEMS) [17]. In this platform OAQ for SO2, NO2 and O3, in addition to UV radiation, humidity and temperature is evaluated. It is utilized a display for data monitoring and transmit the data through BLE to a smartphone. This WEMS is wrist worn. The platform is based on MSP430 TI dual processor with M4 and maximum rate of the frequency is 168 MHz WEMS consumes 6.5 mAh in standby mode and 98 mAh in watch display mode, this power consumption in sensing mode is 250 mAh.
In this work, the infrastructure approach based on the physical layers toward design and implementation of a personalized environmental parameters monitoring is introduced. To maintain the solution, small and wrist-worn the configurability through sending command from a smartphone and sensor node replaceability as the top layer is investigated. This features enable the approach to be more flexible to be applied in different applications according to the user decision.
2. Approach, Methodology and Layers’ Description
Nowadays with excellent improvement in semiconductor technology, the size of sensors is shrinking continuously. Thus, the integration of numbers of sensors of different types in the same device becomes possible. Therefore, it is expected to reduce the dimension of the tools accordingly. This is one of the reason that the wearable sensors are coming to foreground and playing a more important role in different fields of applications (e.g. healthcare, smart city, smart home, agriculture and etc.).
The presented device (hereafter called Multi-Layer Multi-Sensor Environmental Monitoring-Gas (MLMS-EMG-3.2)) is working based on MLMS (Multi-Layer Multi-Sensor) concept [12]. MLMS is applied to create a wrist-worn device by shrinking the size of X-Y and extending the solution to Z vector (XYZ-42×42×25mm). In traditional approach more often the sensors and components are located side by side across the X-Y dimension, and length and width of the board is expanded. In the presented approach in this work, the X-Y plan plus Z are involved in development. To reach a wrist-worn in the design, the width and length of the device is not supposed to be expanded. In MLMS approach, each task is dedicated to a physical layer with its own sensor(s) and components. The signaling bridge between the different layers is created through board to board connectors. In addition to this, this connector also stuck the layers on top of each other in a firm and reliable way. The gas sensor node, host platform and notification system are the three physical layers in this approach. However, the solution might be extended to further parameters measurements and more number of layers, while still being compact, small and light-weighted. Each layer specifications and features are described in the following sections.
In a large perspective MLMS-EMG-3.2 is working as a client and sends the collected data from the ambient physical and chemical sensors to a smartphone via Bluetooth low energy (BLE) for logging. The data for each parameter also are observed on the smartphone. In the following will realize that, the communication between smartphone and the wrist-worn is bidirectional. In the large and completed system, the data are transmitted through Wi-Fi to a server for a permanent storage and further analysis (Figure 1).
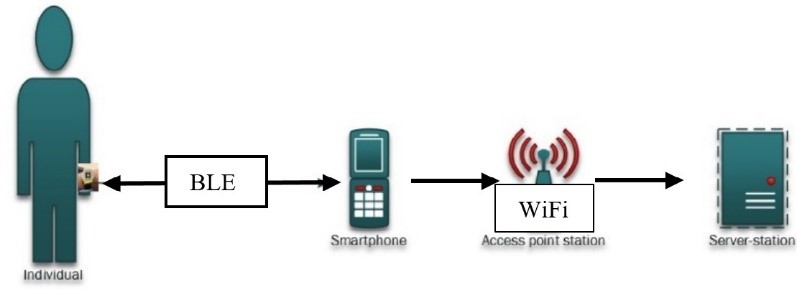 Figure 1 The general structure of whole system.
2.1. Physical Layers‘ Description
This approach consists of three physical layers, each dedicated to a special tasks. The layers are physically separated but are linked via board to board connectors to construct the whole device and to communicate to the micro controller and the host platform. Each layer is described as the follows:
- Middle Layer (host platform): host platform is the motherboard of MLMSEMG- 3.2. A careful host platform selection according to the requirements and criteria is mandatory to enable the integration of different sensors in this wrist worn device. The selected platform must be capable of expansion from both sides (z vector) physically. In addition, to support the number of sensors, a variety of communication protocols (ADC, SPI and IIC) is necessary. The platform should also enable the data transmission. Thus the iProtoxi host platform board based on nrf51822 (Nordic semiconductor) is the most adequate host platform for this prototype [18]. All three motion tracking sensors (gyroscope, magnetometer and accelerometer) and physical parameters measurement sensors (temperature, humidity and air pressure) are integrated on the board. These sensors are distributed on both sides of the board and allow the initialization through IIC communication. One of the extremely critical notable point is the future development of the prototype. The designers are intended to maintain the development extendable for more number of add-on sensors. This is possible with the two-side expansion in z axis through integrated board to board connectors. On the other hand due to limited number of pins on the board, the IIC communication is chosen to be applied to the all integrated sensors for ease of use. Even the gas sensor as an add-on sensor is partially use the IIC for driver initialization and programming.
- Top Layer (gas sensor node): gas sensor node is located at the top layer stuck on top of the host platform for ease of use (replaceability) and also free exposure to air. The gas sensor node is formed of two layers: gas sensor and gas sensor driver. A hardware independent, lower power consumption and flexible sensor node is demonstrated for efficient functionality. In general the gas sensor driver is compatible with 3-lead gas sensors (with some physical and size limitation), but each sensor has its own configuration, gain and filter design. Thus, these components (gain and filter) might be added externally by the designer according to the requirements. For ease of use, the gas sensor and the gas sensor driver are soldered together to form the gas sensor node. This sensor node is the layer at the top. Where the filter design and gain of driver board is the specific parameters for each gas sensor, the general architect and structure of the gas driver is the same for gas sensors but it is customized for in these specific parameters. As the conclusion, each gas sensor is coming with its driver. Furthermore, the soldered gas sensor node, protect the sensor from frequently touch by the user and possible damage.
- Bottom Layer (notification system): The warning system is a mean to reduce the potential risk. When the monitored parameters (here toxic/hazardous gas) are exceeding the thresholds, the notification system detects an abnormal status and is activated. The notification system is consist of a driver board that activate the actuators in unhealthy status exposure when the observing parameters exceed the threshold. Beeper and vibration motor are considered as the warner means in this prototype (Figure 2). The driver is located at the bottom of prototype and both beeper and vibrating motor are connected to the board through wire. The primary idea is to target the office working of the users who are more often are working in quiet places with the beeper. The beeper is positioned in the surface of the wearable toward the user for better sound quality. The beeper is quite tangent with the device housing box. In this design in fact, micro vibration as a complementary actuator to get the attention of group of people who are working in noisy environment and my not draw the attention in risky situations. The vibrating motor is located at the bottom of the 3-d housing case and touches the bone of the forearm for haptic warning. The vibrating motor and beeper both are connected to the driver board and synchronized. The notification system is programmed in three states. In one state which all observing parameters are in the safe range, it is off and no signal is generated.
The working category of the system is two modes while depending on the degree of risk. While the threshold is exceeded but not in extremely dangerous condition, the warning signal for actuators activation is created in low frequency. This frequency and duration of signal activation is extended in highly risky situation to attract the user attention.
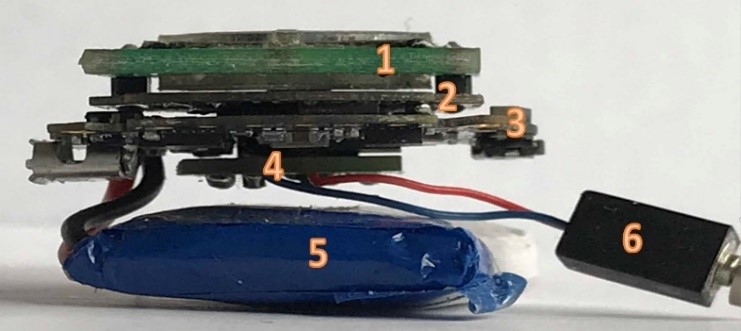 Figure 2 Platform, notification system layer, integrated and add on-board sensor of MLMS-EMG-3.2. (1)(2): gas sensor node consist of (1) sensor, and (2) gas sensor driver. (3): host platform, (4): notification driver, (5): battery, (6): vibrating motor connected to the driver.
2.2. Sensor Node’s Specifications and Features
In this subsection, the most important features of the wrist-worn that provides some specific capabilities are bolded. This version of the prototype is implemented in three physical layers including one layer as the gas sensor node, host platform consists of integrated sensors and the bottom layer dedicated to the notification system driver (Figure 3, Figure 4). The MLMS-EMG-3.2 is provided as a wrist-worn in small size (42×42×25mm) and quite light (51.18 gr.). This box includes the platform, two layers at top and bottom and a LiPo / Li-Ion battery (Figure 4) in addition to beeper and vibrating motor that are located in the case’s wall. Powering on/off of MLMS-EMG-3.2 is possible through a power accessible pin at the right side. In addition, the LiPo / Li-Ion battery is directly rechargeable with a USB window that is placed at the left side of the device. These specifications are limited to the physical design. The software implementation is discussed in different subsection.
- Ubiquitous device for hazardous gas detection: the flexibility, wearability, ease of use and cost of this wrist-worn, make it suitable to be applied by anyone in anywhere to detect anything (here hazardous gas). Usually, the type of hazardous gases in a specific environment are known to the user. (e.g. chemical laboratories). Many gas sensors operation at the same time (while might not be necessary), increase the power consumption and expand the size of the device by deploying number of gas sensors. One solution to reduce the difficulties to the least is to dedicate the sensor selection to the user. If the wearer can decide for the target sensor at any time and place, the efficiency of the design is improved.
- Power consumption and wearability: the sensor size, resolution, response time, accuracy and power consumption directly affect the final prototype form factor, efficiency and prolonged monitoring. The electrochemical gas sensors are selected from the low power consumption family (0 mV and -200 mV bias for Co and NO2 respectively) with small size (Spec sensors [20]). The driver design is critical because it must be compatible with large range of gas sensors. This large range compatibility demand various configurations and gains. Whatever, the issues are pushed to the software side to be handled, the bottleneck dealing is more flexible. Consequently, the configuration is implemented in software side, filter and gain adjustment are performed manually on the hardware side. To the best of our knowledge, the best candidate which provides a complete solution is a Front End Amplifier (AFE) LMP91000 with very low power consumption. The LMP91000 is a micro-power AFE operating in the range of 2.7 to 5.25 V (in the MLMS-EMG-3.2 is used in 3.3v). The total current consumption with appropriate programming through I2C could be less than 10 µA [19]. LMP91000 amplifier converts the output current of the sensor to voltage proportionally and feeds to ADC of the microcontroller. LMP91000 is configurable for each target gas via I2C communication. In addition, a board to board connector in milli-scale also is soldered at the bottom of the sensor node. Bias V ref., R TIA, RE are configured and unique for each gas sensor (Figure 2). Another factor for efficient performance is filter design. Depending on the sensor the filter design is varied. In general, a low pass and an integrator filter are implemented.
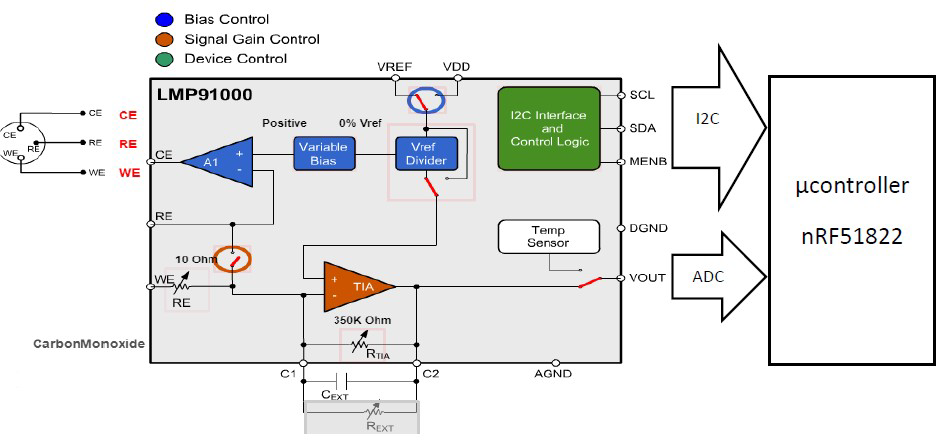 Figure 3 The internal architecture of LMP9100 and the communication with the host platform.
- Gas sensor node replaceability: to enable the sensor selection by the user, gas sensor node “replaceability” is considered as the solution. The gas sensor node that is located at the top of device through board to board connector, can be replaced by a different target gas sensor node easily. This can dramatically extend the number of gases that may be monitored (one at each time). By this feature, the device flexibility in terms of number of detected gases and wearability are improved and the power consumption is reduced. However, each gas sensor has its own configuration and requirements. The gain, filter and initialization of each sensor is customized. The number of utilized enable pins in the microcontroller are restricted due to the 24-pin board to board connector. As a conclusion, the hardware limitation is transferred from hardware side to software side for the more flexible solutions.
2.3. Device configuration and Sensor Selection
In the previous system version, the switching between the gas sensors was realized manually by the wearer. Each gas sensor was dedicated an enable pin; the enable pin was point to the gas sensor configuration and initialization. This was demonstrated in hardware. Due to limited number of pins and future integration of other sensors (other than gas sensors), the pin utilization must be carefully performed. MLMS-EMG-3.1 version was in the scope of a one-way communication (data transmission) with a smartphone. In this version this communication is improved to bidirectional, where data are sent to the smartphone and also commands are received from the smartphone sent by the user.
In the developed version, the sensor is selected via sending a command from the smartphone. All gas sensors are enabled via one enable pin. With sending each command (CO/NO2/SO2/…) the respected function of the gas sensor is initialized and configuration function is executed. This feature highly improves the device flexibility and future development possibility. The instruction is quite straightforward. The user replaces the target gas sensor node, turns the device, and at the end the gas sensor command for activation, configuration and initialization is sent.
Each command is sent through pressing the button on the smartphone screen. These buttons are implemented on the same screen as data observation, at the bottom.
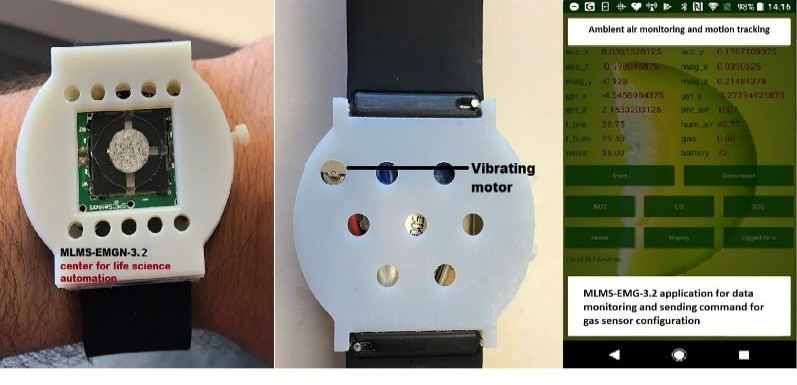 Figure 4 Top and bottom side of MLMS-EMG-3.2 and data transition to android application.
2.4. Data packet transmission to the smartphone
In MLMS-EMG-3.2 data are categorized and transmitted in 3 separate packets (Figure 5): The data that are correlated due to transient efficiency and power consumption are combined and sent in one packet. For each packet different ID’s have been assigned for identification.
- F1: motion elements, 19 bytes (including 2bytes don’t care): For more accuracy, this packet is sent through BLE every 20ms. A 3DoF accelerometer, 3DoF gyroscope and 3DoF magnetometer are integrated for a precision user tracking. Each sensor reserves 12 bits (1.5 byte) which are highlighted with different colors. The packet F1 is started with Seq. which is used in data number counting as well as data logging. F1 is a data ID causing identification, byte separation and recognition process in android APK. The last two bytes are reserved for further development (see Figure 6).
- F2: environmental parameters (temperature, air pressure, and humidity), 12 bytes. This packet (see Figure 13b) is sent to the smartphone every second. In the same policy, it is started with seq. and followed by F2 and then air pressure, temperature and humidity are the parameters which are measured (Temperature also is possible to be measured through integrated sensor in humidity and pressure sensor through adequate configurations). All environmental elements are using 2 bytes divided to two higher and lower byte. Temperature data is represented also in signed 16-bit format, and the corresponding Celsius value can be computed by dividing the value with 256. Air humidity is also 16-bit value, but it is unsigned and the resulting value shows the relative humidity in percent (RH %). Air pressure uses also 16-bit representation, but the value is unsigned and the value must be divided by 32 to be converted into m bars.
- F4: Target gas (NO2), 4 bytes: 4 bytes for gas data transition is sufficient (Figure 13c). These data are sent every 2 minutes due to sensor nature, application requirements, lower power consumption and response time. On the other hand data are sent to the display in real time (1 Hz).
- F5: Sound level, 4 bytes: The sounds packet construction is very similar to gas (see Figure 13d). However, the sound level detection is discussed in this paper and is a part of future development of the MLMS-EMG-3.2.
*F3 is reserved for further development.
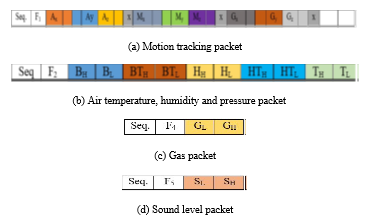 Figure 5 Packet structure of data transmission to the smartphone.
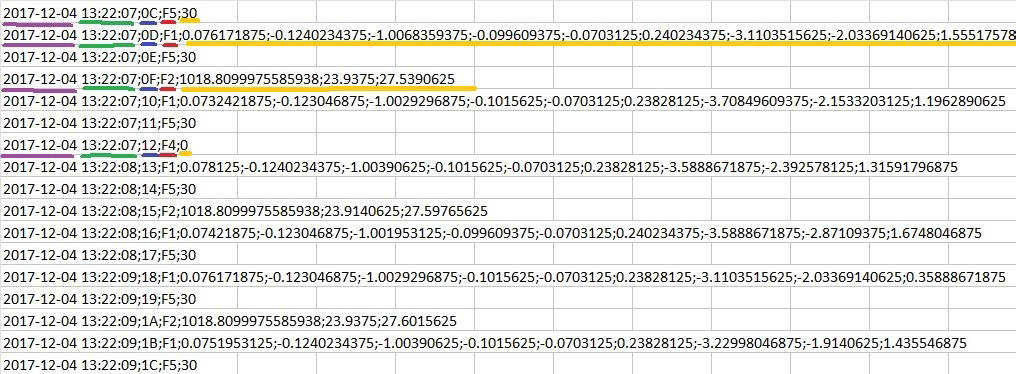 Figure 6 Date, time stamp, sequence, ID and value of each packet
2.5. Filter design
One of the most critical and challenging parts of this work is filter design. The filter must be implemented to eliminate the unpredicted and undesired signal noises from different sources as well as pass the real signals from the gas sensor. The filter in this project is a two-step Low Pass Filter (LPF-passive and active both are integrated in the circuit) as well as code implementation which forms a strict LPF with adequate cut-off frequency (Figure 8).
The first filter (input filter) includes a loaded resistor seen by the sensor and a capacitor (first filter including R1B and C2-passive). This resistor plays a crucial role in this circuit. It must be adjusted between 10-100 Ohm in the way that from one side it accomplishes the low pass filter design and on the other hand holds the gain in an acceptable range. R1 is a tradeoff between response time and noise. Indeed, any noise on the WE probe is amplified by the op-amp with a gain of:
![]() As this filter is receiving the signal from the gas sensor, it has a higher cut-off frequency and consequently higher pass band. The first LPF is carefully designed to pass the real signals from the gas sensor. The strict filtering with narrow band pass might eliminate both real signal and noise together.
As this filter is receiving the signal from the gas sensor, it has a higher cut-off frequency and consequently higher pass band. The first LPF is carefully designed to pass the real signals from the gas sensor. The strict filtering with narrow band pass might eliminate both real signal and noise together.
The second filter step is carried out through a strict active LPF. The real data from the sensor passed the first LPF are fed to the amplifier which amplifies the current signal as well as filters the noises with high frequency. This filter is a feedback filter which cut-off uniquely is function of C1 and R2B. This C1 capacitor improves the stability too. Figure 9 shows the results from first LPF and second feedback filter. The combination of both filters is simulated in Multisim simulator and results are shown in the Figure 10.
The combination of these components is working well and has been simulated in a wide range of frequency (1 Hz – 270 kHz). In higher frequencies, almost all noise signals are eliminated properly, the phase and amplitude change of the output signal vs frequency is shown in Figure 10. Each gas sensor depends on the environment parameters, sensor calibration and sensor application must be uniquely studied. It is remarkable that, first step filtering does not have to be very narrow pass band than second one. PCB design of the sensor driving board and schematic are shown in Figure 7.
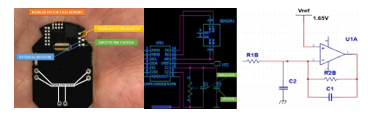 Figure. 7 Gas sensor driver including its components (left) and schematic design of the driver board (right).
2.6. Calibration
A strict filtering is implemented which can successfully reject majority of the noises. For further data, validity an additional filtering step is performed through code implementation. With the
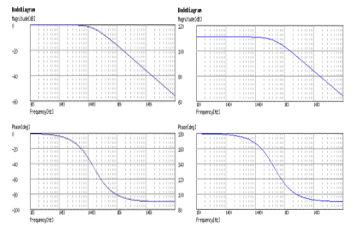 Figure 8 Cut-off frequency and phase input and feedback filters
 Figure 9 Results of filter application on gas sensor.
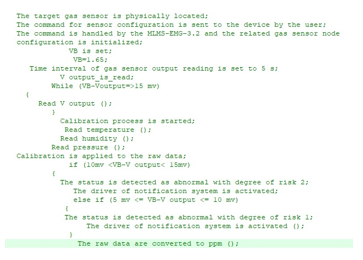 Figure 10 MLMS-EMG-3.2 gas operation algorithm.
particular gas sensor, configuration and environmental parameters no more than 15 mV changes (VB – V output) can be achieved through gas concentration reaction with sensor membrane (otherwise it is not considered as a real signal but noise). If the V output changes > 15 mV, this sample is rejected and immediately another sample is taken (Figure 11). If not, it is going through a calibration process (it’s described in a separated paper). This procedure is followed by the second question on V output change due to the degree of risk and two modes of notification system. As can be seen in the algorithm, the notification system configuration is strictly a function of gas concentration. At the end, raw data are converted to ppm values. The final value of the target gas might be measured at the end of sensor stability (meanwhile in each sampling it is possible that the data reading is getting closer to the real value), but environmental evaluation status is notified to the user meanwhile (see Figure 10).
3. Result and discussion
Carbon monoxide (CO) is a colorless, odorless, and tasteless toxic gas that is slightly lighter than air. The toxicity of CO is variable according to the concentration (Table 1). Long term exposition causes serious health issues. Therefore, measuring the CO concentration with a wearable device equipped with a notification system leads to an early individual notification and exposure avoidance. The focus of this work currently is on CO and NO2 detection. The CO sensor is replaceable with NO2 gas sensor.
Table 1 Risk of carbon monoxide in different concentrations [18].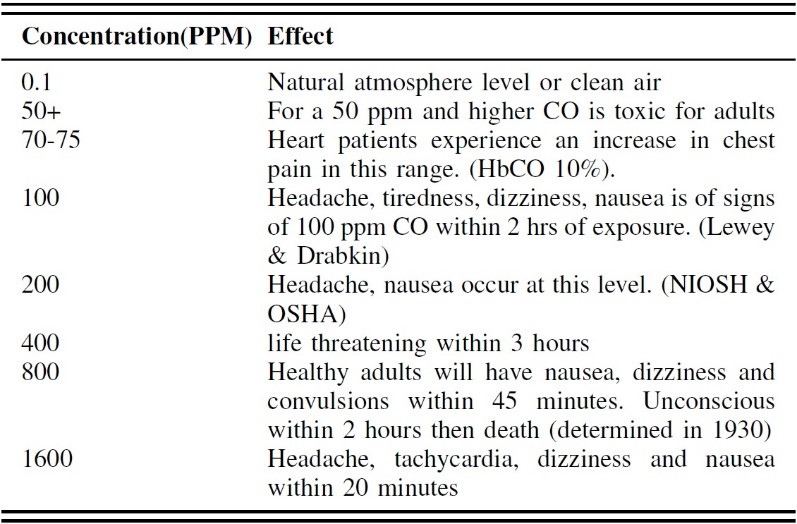
3.1. Experiment conditions
The experimental results presented in this paper are demonstrated under the controlled conditions in the chemical laboratory in center for life science automation (celisca) (air humidity: 59.1%, temperature: 22.7 °C, and air pressure: 1020.3 mbar). All results are produced from the prototype descripted above in the same laboratory and under the same conditions. For calibration, reliability and accuracy test three different gas sensor node layer were applied with different calibration factor (CF). MLMS-EMG-3.2 and BW clip as the calibrator were frequently exposed to the target gas and depending on the gas, the results were recorded in the specific time interval. The test container was a small closed transparent one. These experiments were experienced for 200 times a regular time interval within a week.
3.2. Device configuration
CO and NO2 are two toxic gases from different families. CO is a reducing gas. When the gas sensor is exposed to CO, the internal resistor is reduced and consequently the output voltage is increased proportionally to the gas concentration. From these statement, it is understandable that, to detect the maximum range of gas concentration and avoid saturation (wider span), the LMP91000 of the sensor driver should be configured and set to the minimum initial voltage value. The deployed gas sensor is overloaded at 5,000 ppm. To cover this relatively large range, the LMP91000 is configured to:
 indicates a gas concentration of 0 ppm. With
(external source voltage) and , the difference should cover the range of 0 to 5,000 ppm in CO concentration. According to the Table I, the CO measurement at very high concentrations (>1,700 ppm) does not help in individual rescue due to instant danger. In this paper, the experiments are limited to 1,700 ppm (majority of CO detectors are limited to 300 ppm). Consequently, RTIA and also variable bias are configured. In Figure 2, the current flowing through RTIA is called I sense. Therefore, the V output is a function of:
![]() The ADC is reading the V output generated by the gas sensor. This value is in the range of:
The ADC is reading the V output generated by the gas sensor. This value is in the range of:
![]() Generally, in design, calculation and calibration of the gas driver sensor the polarity of I sense is a significant factor in (2). For reducing gases including CO, this polarity is always positive in the presence of target gas, thus VB is expected to increase with the gas concentration. The opposite scenario is the case for oxidizing gases (e.g. NO2). The sign of I sense is negative and the respected generated voltage is reduced from the VB. Consequently, V output is proportionally smaller at higher concentrations. MLMS-EMG-3.2 has been exposed to different gas concentrations from 0 to 1,620 ppm. Within this range, performance, response time, recovery time and accuracy of the device are evaluated. The resolution of CO is categorized into two sections: 7.5 ppm (for CO concentrations < 50 ppm) and 5 ppm (for CO concentrations up to 1,620 ppm). All configurations, setting values for two groups of gas sensors, calibration process and conversion of each gas sensors are embedded in source code. Initialization for each target gas sensor is realized by sending the related command from the smartphone. During the experiments, several significant observations were perceived which are summarized as the follows:
Generally, in design, calculation and calibration of the gas driver sensor the polarity of I sense is a significant factor in (2). For reducing gases including CO, this polarity is always positive in the presence of target gas, thus VB is expected to increase with the gas concentration. The opposite scenario is the case for oxidizing gases (e.g. NO2). The sign of I sense is negative and the respected generated voltage is reduced from the VB. Consequently, V output is proportionally smaller at higher concentrations. MLMS-EMG-3.2 has been exposed to different gas concentrations from 0 to 1,620 ppm. Within this range, performance, response time, recovery time and accuracy of the device are evaluated. The resolution of CO is categorized into two sections: 7.5 ppm (for CO concentrations < 50 ppm) and 5 ppm (for CO concentrations up to 1,620 ppm). All configurations, setting values for two groups of gas sensors, calibration process and conversion of each gas sensors are embedded in source code. Initialization for each target gas sensor is realized by sending the related command from the smartphone. During the experiments, several significant observations were perceived which are summarized as the follows:
- At high concentrations, when the different volume of gas is released into the container, the experiment for the gas with higher concentration is reaching to the some specific value in a faster rate rather than a test with lower concentration and volume of gas (both sensors reach to this point at the different time slopes). To differentiate between experiments, the time interval for the recording of the concentration must be at the same time interval, but before saturation state. In observation sections figures, number of portions are seen in each figure with the slop rate of response time or recovery time within the test (Figure 6, Figure 11, and Figure 13).
- During the measurement two status were observed in data recording: stable state and temporary unstable state. Stable state is a safe level that the recorded values are constant and reliable. In spite of stable state, the second state is consist of gas values which are quickly recorded and disappeared. In fact, in this status a swinging values of measurement is recorded. Approximately every 50 ppm, the stable state was observed. This is experienced more often in higher concentration due to high volume of released target gas. In a normal exposure of target gas in low concentration, the response time might be as small as 15 second or less, while when the gas sensor is exposed to high concentration, the gas sensor does not have enough time for stability, therefore, the dynamic value updating in the form of swinging values are monitored. During the experiment the response time of 47 s was recorded for some tests, while this time might be more for the lower released gas volume. Halt time is increased with time and gas volume intensity and only occurs within stable points (Figure 12).
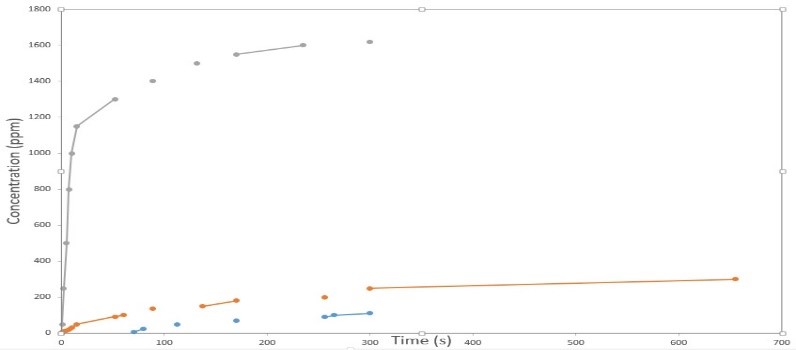 Figure 11 Response time for 110, 300 and 1620 ppm (CO).
- The instability or in the other word fast changing values of gas concentration, is taken place right before the steady state level. When the sensor node is exposed to the high target gas concentration (e.g. > 500 ppm), due to fast response time and value tracking by the gas sensor, these unstable points are not detectable at the beginning of the experiment. But are exhibited in the observation gradually with the time. Stable level and halt time for 1,620 ppm are depicted in Figure 7.
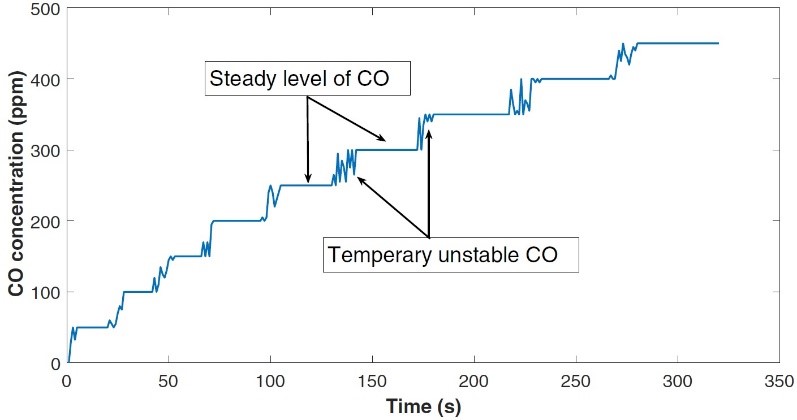 Figure 12 Stable level and halt time for 1,620 ppm (CO).
- The rate of response time is reduced gradually with the time (Figure. 8). The fastest response time is seen at the beginning of each experiment for the first measurement test. The rate of flowing gas into the container is constant for all experiments. To increase the concentration of the gas in experiments, the determined volume of the gas is pumped for longer time under the constant flowing rate.
- “Recovery time” for a gas sensor is defined as the essential required time for the sensor to reach from a non-zero ppm to zero ppm and is ready for the next experiment. The observation of several experiments in the laboratory, indicate after removing the sensor node from the gas exposure, for small period of time (seconds) the measured gas value is seen the same with the last change. Then a quick and large value drop is occurred. This drop, if followed with a sharper reduction of recorded values. The evaluation is continued to reach zero ppm but with slower rate than the previous stage. This pattern was repeated for three different gas concentrations (several experiments for each gas concentration), this is depicted in Figure 13.
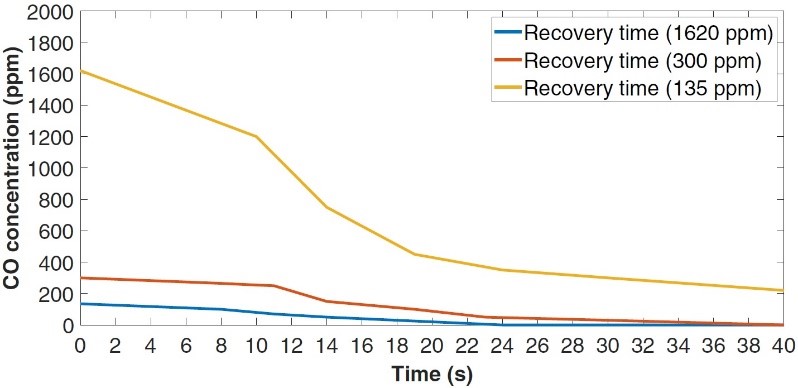 Figure 13 Recovery time for 135,300 and 1620 ppm (CO).
- Table 2, exhibits a limited number of recorded samples during the experiments under the different gas concentrations. These data are validated in conjunction well-known BW CLIP [21]. During the experiments MLMS-EMG-3.2 and BW CLIP were located into a container under the quite the same conditions. The maximum recorded error in the experiments is 6.5 %. Care must be taken that, the accuracy of the measurements are strongly the function of the “when the data are read”. The authors would recommend for the average time of five minutes for the data assessment. The mean time of each test in our experiences were five minutes, however this time in some individual tests could be extended up to ten minutes. In the majority of the cases, the recorded gas concentration reaches to 75-80 % of the final value at the first five minutes.
- To switch from NO2 to CO (or vice versa), the target gas sensor node is physically replaced and once the communication channel (BLE) is established between the smartphone and the device, the command to activate the target gas sensor is sent. It is observed that, it is not necessary to switch off the device for gas sensor node replacement but it is recommended.
Table 2 Experiment results of calibrator and MLMS-EMG-3.2.
4. Conclusion
In this work a compact, small and light weighted wrist-worn device for hazardous gas measurement was introduced. This prototype is based on physical layer design, named MLMS approach. Host platform including the physical ambient air sensors, and motion tracking sensors, is the middle layer. The gas sensor node consisting of the gas sensor and sensor driver is located at the top and the notification driver which is activated in abnormal status is located at the bottom of the host platform. MLMS-EMG-3.2 is designed for a large range of applications, due to particular feature that the gas sensor node is replaceable with some other target gas sensors. The target gas sensor is configured through sending commands from the smartphone by the user. By using the commands from the smartphone to activate the target sensor, the separate enable pin for each gas sensor is eliminated. This leads to a reduction the complexity and restrictions in hardware; instead a more flexible solution is presented in software side. Future developments of this prototype will include noise (sound level) detection.
Conflict of Interest
The authors declare no conflict of interest.
Acknowledgment
This work is funded by the Ministry of Economics, Employment and Health of Mecklenburg Vorpommern, Germany under project number MV (TBI-V-1-127- VBW-044).
- Haghi, Mostafa, Kerstin Thurow, and Norbert Stoll. “A Multi-Tasking, Multi-Layer and Replaceable Wrist-Worn Environmental Monitoring Sensor Node.” In 2018 5th International Conference on Control, Decision and Information Technologies (CoDIT), pp. 25-31. IEEE, 2018. 10.1109/CoDIT.2018.8394781
- E. of the European Parliament, of the Council of 21 May 2008 on ambient air quality, and cleaner air for Europe, 2008. http://ec.europa.eu/environment/archives/enlarg/handbook/air.pdf [Accessed on August 13, 2018].
- I. Kousuke, and J. Watson. The Stannic Oxide Gas Sensor Principles and Applications. CRC press, 2017. Town is missing
- D. Oletic, V. Jelicic, D. Antolovic, and V. Bilas, “Energy-efficient atmospheric co concentration sensing with on-demand operating mox gas sensor,” in SENSORS, 2014 IEEE. IEEE, 2014, pp. 795–798. DOI: 10.1109/ICSENS.2014.6985119
- R. S. Istepanian, E. Jovanov, and Y. Zhang, “Guest editorial introduction to the special section on m-health: Beyond seamless mobility and global wireless health-care connectivity,” IEEE Transactions on information technology in biomedicine, vol. 8, no. 4, pp. 405–414, 2004. DOI: 10.1109/ACCESS.2015.2437951
- M. Haghi, K. Thurow, and N. Stoll, “A multi-layer multi-sensor wearable device for physical and chemical environmental parameters monitoring (co & no2)” in Information and Digital Technologies (IDT), 2017 International Conference on. IEEE, 2017, pp. 137–141. DOI: 10.1109/DT.2017.8024285
- M. Haghi, K. Thurow, and R. Stoll, “Wearable devices in medical internet of things: scientific research and commercially available devices,” Healthcare informatics research, vol. 23, no. 1, pp. 4–15, 2017
- I. Stassen, N. Burtch, A. Talin, P. Falcaro, M. Allendorf, and R. Ameloot, “An updated roadmap for the integration of metal–organic frameworks with electronic devices and chemical sensors,” Chemical Society Reviews, vol. 46, no. 11, pp. 3185–3241, 2017. DOI: 10.1039/C7CS00122C
- D. Oletic and V. Bilas, “Design of sensor node for air quality crowd sensing,” in Sensors Applications Symposium (SAS), 2015 IEEE. IEEE, 2015, pp. 1–5. DOI: 10.1109/SAS.2015.7133628
- R. R. Fletcher, N. M. Oreskovic, and A. I. Robinson, “Design and clinical feasibility of personal wearable monitor for measurement of activity and environmental exposure,” in Engineering in Medicine and Biology Society (EMBC), 2014 36th Annual International Conference of the IEEE. IEEE, 2014, pp. 874–877. DOI: 10.1109/EMBC.2014.6943730
- F. Sanfilippo and K. Y. Pettersen, “A sensor fusion wearable health monitoring system with haptic feedback,” in Innovations in Information Technology (IIT), 2015 11th International Conference on. IEEE, 2015, pp. 262–266. http://doi.ieeecomputersociety.org/10.1109/INNOVATIONS.2015.7381551
- M. Haghi, K. Thurow, and N. Stoll, “A three-layer multi-sensor wearable device for physical environmental parameters and NO2 monitoring,” in Smart Systems and Technologies (SST),2017 International Conference on. IEEE, 2017, pp. 149–154. DOI: 10.1109/SST.2017.8188686
- M, Haghi, R. Stoll and K. Thurow, 2018. A Low-Cost, Standalone, and Multi-Tasking Watch for Personalized Environmental Monitoring. IEEE transactions on biomedical circuits and systems, (99), pp.1-11. 10.1109/TBCAS.2018.2840347
- http://site.jjstech.com/pdf/GAExtremeManual.pdf. [Accessed on August 13, 2018].
- http://www.ti.com/lit/ug/tidub41/tidub41.pdf. [Accessed on August 13, 2018].
- http://www.ti.com/lit/ug/snoa922/snoa922.pdf. [Accessed on August 13, 2018].
- H. Cho, “Personal environmental monitoring system and network platform.” Sensing Technology (ICST), 2015 9th International Conference on. IEEE, 2015. DOI: 10.1109/ICSensT.2015.7438496
- https://iprotoxi.fi/ [Accessed on 10October 02, 2018].
- http://www.ti.com/lit/ds/symlink/lmp91000.pdf. [Accessed on August 13, 2018].
- https://www.spec-sensors.com/wp-content/uploads/2016/05/Carbon-Monoxide-Risks-at-Low-Levels.pd. [Accessed on August 13, 2018].
- http://www.honeywellanalytics.com/en/products/BW-Clip. [Accessed on August 13, 2018].