
Spatial Modeling of Flood Risk in Karawang
Volume 3, Issue 5, Page No 200-206, 2018
Author’s Name: Bambang Riadi, Yustisi Ardhitasari Lumban-Gaola) and Rizka Windiastuti
View Affiliations
Geospatial Information Agency, Jalan Raya Jakarta-Bogor Km.46, Cibinong 16911, Indonesia
a)Author to whom correspondence should be addressed. E-mail: yustisi.ardhitasari@big.go.id
Adv. Sci. Technol. Eng. Syst. J. 3(5), 200-206 (2018); ![]() DOI: 10.25046/aj030524
DOI: 10.25046/aj030524
Keywords: DEM, Hazard, High resolution, Imagery, TWI

Export Citations
Conceptually, flood modeling can be done based on process and data availability (data driven model). The implementation of flood mitigation requires accurate data, which can be obtained from high resolution satellite imagery, vertical air photos and high-resolution Digital Elevation Model (DEM). Modeling using high accuracy DEM data can detect landforms in more detail. The objective of this research was to develop flood risk assessment using Topographic Wetness Index (TWI) method. Areas with high humidity indicated that the area was a flood hazard area. Flood spatial risk analysis used hazard mapping methods, vulnerability mapping and capacity assessment. The results obtained indicated that 8,838 ha area was in high flood hazard, while 9,780 ha was in moderate flood hazard and 7,652 ha was in low flood hazard. When incorporating the risk factors, 12,898 ha areas was in high risk, 9,357 ha was in moderate risk, and 4,015 ha was in low risk.
Received: 16 August 2018, Accepted: 23 September 2018, Published Online: 27 September 2018
1. Introduction
Land form has an important role when studying the flood, because the shape of the land is one form of cross-section for the process of water flowing into the sea [1]. The areas that are most affected by flood are areas with flat reliefs and ramps. The indicators of flood-prone landscapes are in the form of flood plains, sea terraces, swamps and back swamps. Geomorphological flood areas are characterized by concave morphology or flat land forms associated with rivers, with winding and or meander flow patterns, as one area with potential flooding and this area needs to be mapped [2].
The research located in Karawang Regency was chosen because it met the criteria as a flood-prone area, which is located on a coastal area with slope characteristics < 2%. With an average rainfall of 200 mm per year, this study area is categorized as a flood hazard area [3]. The development of geospatial technology gives good hope because flood-prone areas can be determined more quickly, precisely and accurately. The use of DEM data is expected to provide efficiency in identifying and mapping flood-prone areas [4].
Several flood studies had been conducted using DEM SRTM (Shuttle Radar Topography Mission) data and topography maps at 1:25,000 scale, including [5] and [6]. Some research on floods which is conducted by [7] and [8] use data DEM 15M radar, which is better than the DEM SRTM 30m resolution. The data used in this flood study, when used as a basis for making contours, would yield the accuracy of ± 10m or in the accuracy category of topography map scale 1: 25,000. Floods that occur in the study area are between 70 cm to 150 cm. If the flood research use DEM data with a precision of 10m, then the results of the research will not meet the standard accuracy.
Flood research in this study used TerraSAR-X DEM data with high spatial resolution and could be an alternative as an accurate source of DEM data [9]. The high spatial resolution of the TerraSAR-X sensor provide access to surface heterogeneity on a better scale [10]. The method used in this study is the Topographic Wetness Index (TWI), which could provide an illustration of an area that have a high flood hazard potential by using the accumulation of flow and slope functions to display the potential flood basin area [11].
Flood risk was analyzed for spatial and temporal aspects of a flood event. Spatial aspects involved the location and coverage of floods, while the temporal aspect included the time of the flood event. Flood modeling could be carried out conceptually based on processes and models according to data availability (data driven models). Flood hazard modeling in paddy fields was assessed from the physical and hydrological conditions of the land supported by statistical data and the results of field surveys [12]. This approach was considered suitable for assessing flooding in paddy fields because it fitted to the facts in the field. Flood risk assessment was carried out by identifying three components, namely hazard, vulnerability and flood exposure. The objectives to be achieved from this study were: 1. identifying and delineating flood hazard areas using accurate DEM in Karawang regency, and 2. analyzing the risk of flooding in paddy fields.
2. Materials and Method
2.1. Investigated field
The research location was in Karawang Regency, West Java Province (Figure 1), which is geographically located in the north of West Java Province, between longitude 107o 02 ‘- 107o 40′ BT; and latitude 5o 56 ‘- 6o 34′ LS. The study area consisted of 30 districts, 309 villages with land use dominated by technical irrigated paddy field (97,352 ha or 65.44%), and simple irrigated paddy fields (2,204 ha). Other land uses included fields (5,830 ha), yards (44,931 ha) and uncultivated (1,817 ha) (BPS 2016). The land use condition of Karawang Regency reflected the characteristics of the rice farming area and as a rice granary in West Java Province.
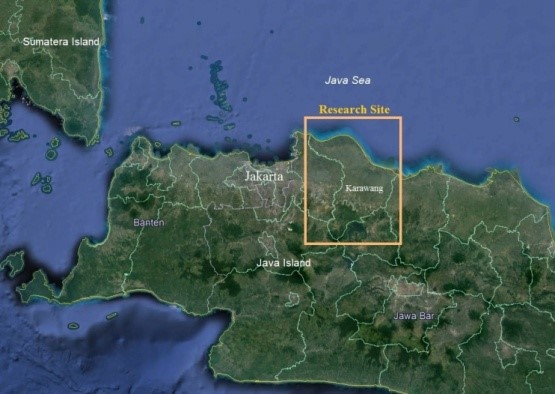 Figure 1. The location of Kerrawang Regency, West Java.
2.2. Materials and data used
This research was carried out in three stages as follows: (a) preparation and data collection of the topography map and TerraSAR-X DSEM (TerraSAR-X DSM was exported to the 16 bit geotiff and then imported into the ILWIS system), (b) data processing for identification of flood hazard areas with TWI (Topographic Wetness Index) method (through the fill sink process, flow direction, flow accumulation and compound index calculation which resulted in a wetness index), and (c) risk analysis and results validation, where risk analysis was preceded by an analysis of land physical vulnerability and vulnerability. Risk analysis was done by overlaying flood hazard maps with physical vulnerability maps and socio-economic vulnerability maps using ArcGIS software and generating risk maps. Validation was carried out by checking the modeling results at 20 points and confirming with the local government or the community at the observation points of flooded areas. The flowchart is shown in Figure 2.
2.3. Flood Hazard
Identification and delineation of flood hazard areas were done by recognizing damp areas using the Topographic Wetness Index (TWI) method. The result was a derivative map from processing DEM data under fixed conditions – steady state – using the flow and slope accumulation functions. The wetness index was a key variable that controls the hydrological process [13]. The TWI model described water trends that accumulated at certain points and local slopes which indicated the influence of gravitational forces on the movement of water [2]. A location that had a gentle slope would have a high wetness index and had a high potential for waterlogging. Conversely a location that had a steep slope would have a low wetness index, so the potential for flooding was also low.
The wetness index was a key variable in the hydrological process. The wetness index value of more than 25 indicated that the area had a gentle slope so it had the potential for waterlogging. The value of the wetness index 12 in this study was assumed to be the inundation area boundary. If the wetness index was lower than 12, it indicated an area with steep slope and had a low potential for flooding.
Table 1. Types of data, data sources, analysis method and output.
| No. | Research objevtive | Data | Data source | Analytical method | Output |
| 1. | Identification and delineation of flood hazard areas | Topographical map 1:25000, DSM TerraSAR-X,high resolution satellite imagery,irigation network map | BIG, BPN, PJT2, DPKPP, field survey | Topogra phic Wetness Index, (TWI), digitization,visual interpretation, | Flood hazard map |
| 2. | Flood risk analysis | Flood risk map, high resolution image, flood history,rainfall | Analysis results, BPS, DPKPP, PJT 2, field survey | GIS analysis, land physical vulnerability, socioeconomic vulnerability, overlay vulnerability map | Flood risk map |
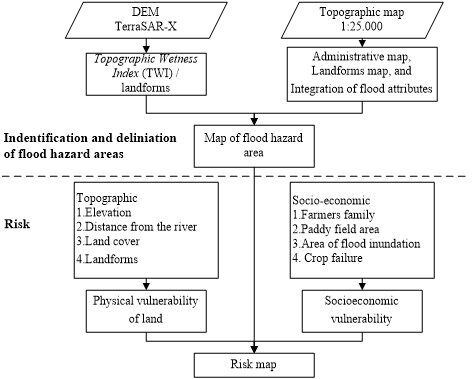 Figure 2. Research flowchart.
Withdrawal of flood inundation boundary areas was carried out through visual interpretation. The flood event attributes in the form of frequency data, inundation height and flood duration in paddy fields [14] were integrated into the flood hazard map [15]. Floods that occurred every year with a puddle duration of more than 7 days with an average height of flood water more than 70 cm, had the potential to become a flood hazard area with high criteria [16], as compiled in Table 2.
Table 2. Criteria for classification of floods in paddy fields.
| Frequency/year | Average flood height (cm) | Duration of inundation/day | Criteria |
| 1 – 2 | 60 – 150 | < 7 days | Low |
| 2 – 3 | 60 – 150 | 7 – 14 days | Moderate |
| > 4 | > 70 | ≥ 15 days | High |
2.4. Risk
Risk is an interaction between the vulnerability level of an area with a hazard that exists. The cause of the flood hazard usually comes from natural events in the form of natural disasters. Mapping of flood risk areas was done by utilizing Geographic Information Systems (GIS), overlaying flood hazard maps with flood vulnerability maps. Each has a parameter which was then calculated using the scoring method and classified according to the score.
Vulnerability is a condition of reduced resilience due to the effects of floods that threaten lives, livelihoods, natural resources, infrastructure, economic productivity, and welfare. The relationship between danger and vulnerability, that vulnerability produces a risk or interaction between the level of vulnerability of the region and the threat of danger [17]. The impact of flood has risks that can cause damage and potentially cause losses, loss of security, and disruption of community activities [18]. The overlay method between flood hazard maps and vulnerability maps produced a risk map which was then classified into 3 classes, namely high risk, moderate risk, and low risk [19]. Risk criteria are arranged in a risk level matrix as in table 3.
Table 3. Analysis of risk level matrix.
| Pv1 | Pv2 | Pv3 | |
| Sv (1) | 3 | 4 | 5 |
| Sv (2) | 4 | 5 | 6 |
| Sv (3) | 5 | 6 | 7 |
Pv = Physical vulnerability of land; Sv = Socioeconomic vulnerability.
Source: analysis result
3. Results and Discussion
3.1. Flood Hazard
The TWI process was through several stages:
- Correction of depression / sink due to noise with the fill sink process (Figure 3). The results showed that the northern region had a low elevation value with the number of colors 0 to 50. The number of colors did not reflect the value moisture but represented the height of the area.
- Flow direction process, where flow direction (Figure 4) spread throughout the study area which indicated that the study area was a potential area of flooding.
- Flow accumulation, where the higher the value of flow accumulation was, the more likely the cell became a stream, regardless of the real conditions on the cell field in the form of rivers, ditches or irrigation channels (Figure 5). Values of flow accumulation were associated with the basin and or direction of gathering water flow. Large values were associated with high flow density. This function modeled the amount of accumulated water flow that occurred in a particular area, the value of water accumulation which was usually also identical to the actual hydrological flow in the field and this area had an indication of a flood-prone area.
- The calculation compound index that produced wetness index. Locations that had a gentle slope had a high wetness index that gave a high indication of potential flood areas. Locations that had steep slopes, had low wetness indices that gave a low indication of potential flooding (Figure 6). The limit of the flood potential area was delineated in the wetness index of 12, and the flood hazard area map was the result of the integration of the TWI map by adding historical attributes to flood events (Figure 7).
Figure 8, as a result of overlaying flood hazard maps with landform maps, showed that the majority of flood hazard areas were in the plain estuarine land. Overlaying flood hazard maps with slope maps showed that flood areas were mostly located in areas with slopes < 2% (Figure 9). The analysis showed that the flood hazard area covered 26,270 ha (Figure 10.), where 8,838 ha (part of Jayakerta district, Rawamerta district, Telukjambe Barat district and Telukjambe Timur) was in high flood hazard, 9,780 ha was in moderate flood hazard and 7,652 ha was in low flood hazard.
3.2. Vulnerability
Vulnerability to floods was classified in land physical vulnerability and socio-economic vulnerability. The physical
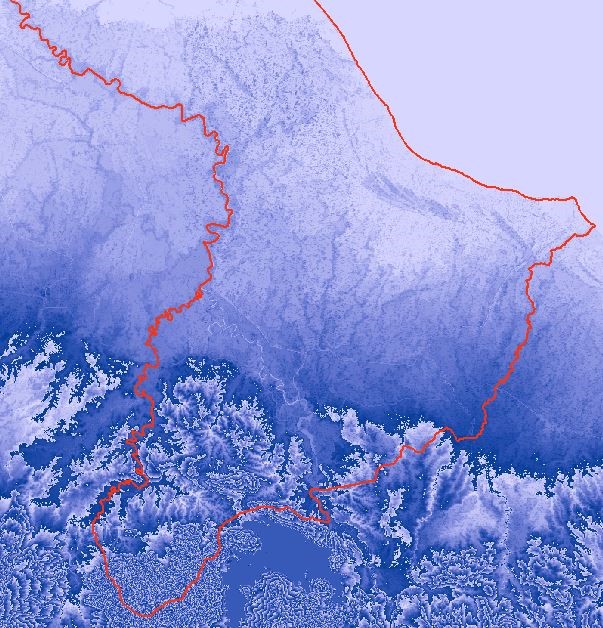 Figure 3. Fill sink.
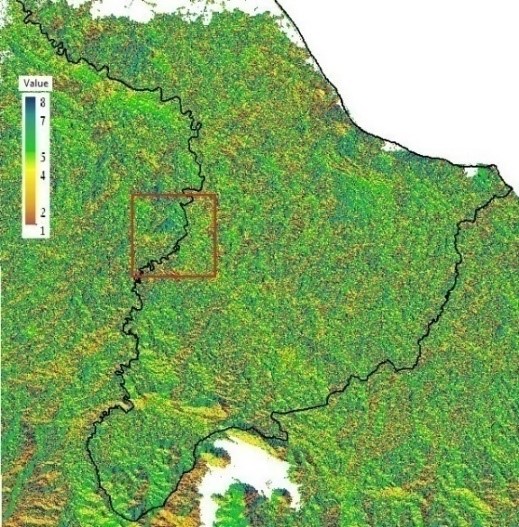 Figure 4. Flow direction.
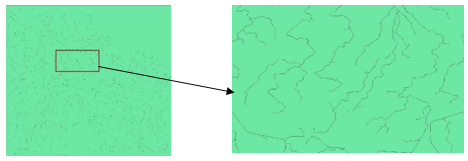 Figure 5. Flow accumulation.
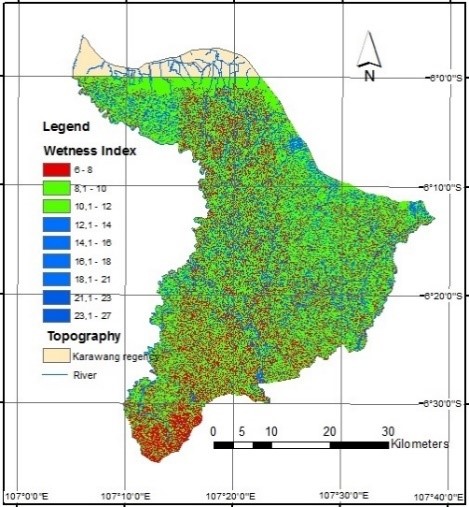 Figure 6. TWI Map.
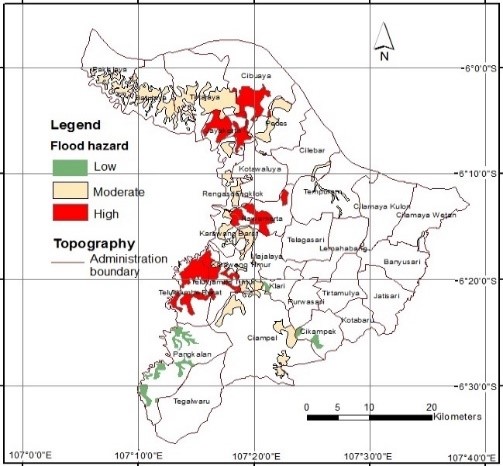 Figure 7. Flood Hazard Map.
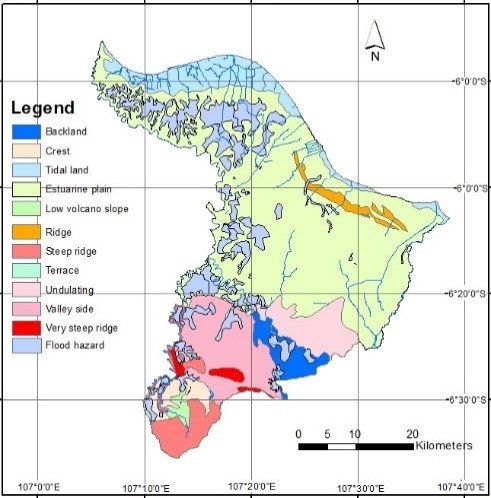 Figure 8. Landforms Map.
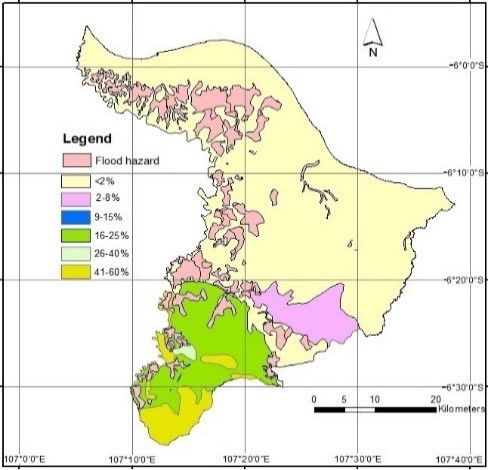 Figure 9. Slope Map.
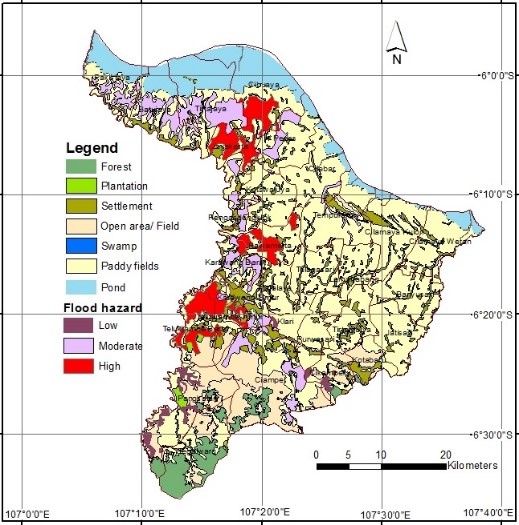 Figure 10. Flood Area.
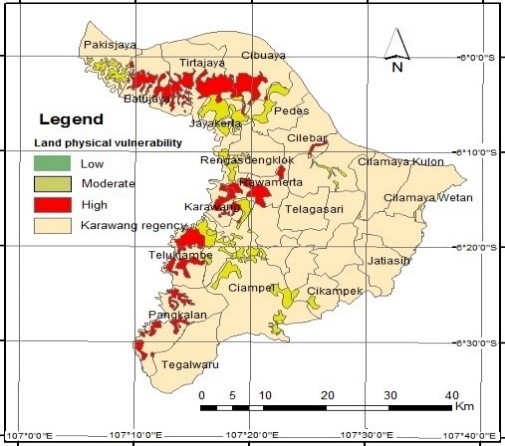 Figure 11. Land Physical Vulnerability.
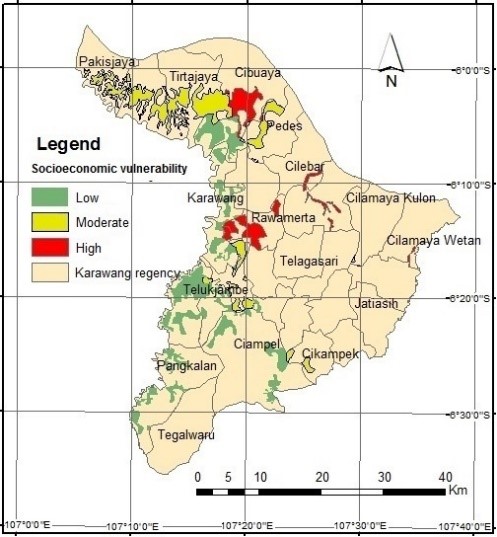 Figure12. Socio-economic Vulnerability.
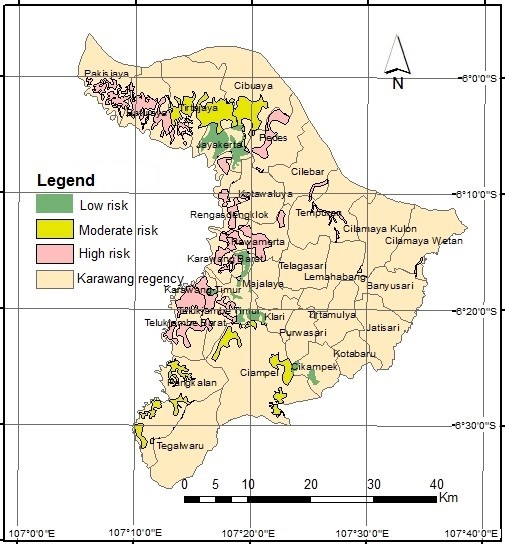 Figure 13. Risk Map.
Table 4.Flood risk level.
| No. | Districs | Flood hazard | Land physical | Socio economic | Risk | Classified |
| 1 | Batujaya | 2.1 | 3.0 | 3.0 | 8.1 | High |
| 2 | Ciampel | 2.2 | 2.1 | 2.1 | 6.4 | Moderate |
| 3 | Cibuaya | 1.2 | 2.7 | 2.7 | 6.6 | Moderate |
| 4 | Cikampek | 0.9 | 1.8 | 1.8 | 4.5 | Low |
| 5 | Cilamaya Kulon | 1.3 | 2.4 | 2.4 | 6.1 | Moderate |
| 6 | Cilamaya Wetan | 1.3 | 2.7 | 2.7 | 6.7 | Moderate |
| 7 | Cilebar | 1.8 | 2.7 | 2.4 | 6.9 | High |
| 8 | Jayakerta | 2.7 | 2.4 | 3.0 | 5.4 | Low |
| 9 | Karawang Barat | 1.8 | 3.0 | 2.1 | 6.9 | High |
| 10 | Karawang Timur | 1.8 | 2.1 | 2.1 | 4.2 | Low |
| 11 | Klari | 1.3 | 2.1 | 2.1 | 5.5 | Low |
| 12 | Pakisjaya | 2.7 | 2.1 | 3.0 | 7.8 | High |
| 13 | Pangkalan | 1.3 | 3.0 | 2.4 | 6.7 | Moderate |
| 14 | Pedes | 2.1 | 2.4 | 2.7 | 7.2 | High |
| 15 | Rawamerta | 2.7 | 2.7 | 2.7 | 8.1 | High |
| 16 | Rengasdengklok | 1.8 | 2.7 | 2.4 | 6.9 | High |
| 17 | Telukjambe Barat | 2.5 | 2.4 | 2.4 | 7.3 | High |
| 18 | Telukjambe Timur | 2.5 | 2.4 | 2.4 | 7.3 | High |
| 19 | Tempuran | 2.2 | 2.4 | 2.4 | 7.0 | High |
| 20 | Tirtajaya | 1.3 | 2.7 | 2.7 | 6.7 | Moderate |
vulnerability of the land was related to land use, height to sea level and distance to surrounding rivers. Physical susceptibility of high-class paddy fields included Batujaya, Cibuaya, Cilebar, West Karawang, Pangkalan, Rawamerta, West Telukjambe and Tirtajaya districts had high physical vulnerability to land (Figure 11).
The socio-economic vulnerability of the community in the event of a flood was caused by a socio-economic system in which population lived [20]. Socio-economic vulnerability analysis took into account the number of affected farmer families, productivity, production losses, and economic losses incurred. The highest socio-economic vulnerability was in the flood areas of Cibuaya, Cilamaya Wetan, Cilebar, Rawamerta, Tempuran sub-districts (Figure 12). Areas that had high vulnerability could lead to a greater element at risk to be exposed to hazards and could increase the risk of flooding.
3.3. Risk
Floods that often occurred in research areas generally inundated paddy fields, because paddy fields were relatively lower than roads and settlements. For this reason, the flood research used GIS technology (Geographic Information System). Spatial integration with socio-economic data was carried out to create maps of land physical vulnerability and socio-economic vulnerability of farmers. Furthermore, analyzing the area of paddy fields that had a high risk of flood events. This relationship can simply be understood that the risk of flooding (Table 3) would increase if the level of hazard and the level of vulnerability were high.
Based on the results of the analysis 12,898 ha of rice fields in the Batujaya, Cilebar district, Karawang Barat district, Pakisjaya district, Pedes district, Rawamerta district, Rengasdengklok district, Telukjambe Barat district, Telukjambe Timur district and Tempuran district was in high risk of flood, 9,357 ha was in medium risk and4,015 ha was in low risk (Figure 13).
4. Conclusion
Mapping of flood-hazard areas using high resolution DEM data with the TWI method was successfully implemented and gave good results. This research was intended to encourage the use of TerraSAR-X DEM for various flood research applications. At present, flood research is still using topographic map data of 1: 25,000 scale. Conclusion of flood hazard mapping as follows:
1. The results of the identification of flood hazards indicate that not all lowland estuaries were flooded.2. Areas with a slope of less than 2% are areas that have the potential to flood, in this study flood hazard areas were also identified in areas with slopes of more than 16%, with this method the basin area can be identified in more detail.3. Potential flood hazards include 26,270 ha, areas with high flood hazard 8,838 ha, medium flood hazard 9,780 ha and low flood hazard 7,652 ha.
Flood events threaten the lives and livelihoods of the people, one of the livelihood sectors that is threatened by flooding is the agricultural sector. Farmer livelihood vulnerability will present the risk of flooding. Based on the results of flood risk research, it can be concluded that:
1. High risk areas are Batujaya district, Cilebar district, Karawang Barat district, Pakisjaya district, Pedes district, Rawamerta district, Rengasdengklok district, Telukjambe Barat district, Telukjambe Timur district and Tempuran district covering an area of 12,898 ha. Medium risk 9357 ha and risk low of 4,015 ha.2. The understandable relationship is that the risk of flooding will increase if the level of hazard and vulnerability is high.3. Analysis of flood risk at the previous district level cannot be avoided, the equation for the accuracy of the basic data geometry used is very possible.
Conflict of Interest
The authors declare no conflict of interest.
Acknowledgment
The authors would like to thank Mr. Baba Barus, Mr. Widiatmaka, Mr. M Yanuar JP, Mr. Bambang Parmudya from the Bogor Agricultural University and Karawang Government, Statistic of Karawang Regency, Geospatial Information Agency. They provide valuable data, documents and time for discussion.
- Marfai MA. 2004. Spatial Modelling of Tidal Hazard on East Semarang Coastal Area. (Studi Kasus: Pesisir Timur Semarang). Jurnal Fakultas Geografi UMS: Forum Geografi 18(1): 60-69.
- Pourali SH, Arrowsmith C, Chrisman N, Matkan AA, Mitchell D. 2014. Topography Wetness Index Application in Flood-Risk-Based Land Use Planning. Appl. Spatial Analysis 9(1): 39-54.
- SNI. 2015. Standar Nasional Indonesia SNI 8197: 2015 tentang Metode Pemetaan Rawan Banjir Skala 1:50.000 dan 1:25.000. Badan Standardisasi Nasional.
- Baghdadi N, Cerdan O, Zribi M, Auzet V, Darboux F, El Hajj M. 2008. Operational Performance of Current Synthetic Aperture Radar Sensors in Mapping Soil Surface Characteristics: Application to Hydrological and Erosion Modelling. Hydrological Processes. 22(1): 9-20.
- Deviana A, Kridasantausa I, Suryadi Y. 2012. Kajian Pemodelan Spasial Banjir Untuk Mendukung Kebijakan Sempadan Sungai dan Tata Ruang Wilayah (Studi Kasus Wilayah Pengembangan Baleendah). Tersedia di: https://ftsl.itb.ac.id/wp-content/uploads/sites/8/2012/07/95010011-Aninda-Deviana.pdf. pp. 1-21
- Nugraha Al, Haniah. 2013. Kajian Pemanfaatan DEM SRTM dan Google Earth Untuk Parameter Penilaian Potensi Kerugian Ekonomi Akibat Banjir Rob. Jurnal Ilmiah Bidang Ilmu Kerekayasaan 34(3): 202-210.
- Bates PD and De Roo APJ. 2000. A Simple Raster-Based Model for Flood Inundation Simulation. Journal of Hydrology. 236 (2000): 54-77. Elsevier.
- Haile AT and Rientjes THM. 2005. Effects of Lidar DEM Resolution in Flood Modelling: A Model Sensitivity Study for The City of Tegucigalpa, Honduras. ISPRS WG III/3, III/4, V/3 Workshop “Laser scanning 2005”, pp. 168-173. Enschede, the Netherlands.
- Riadi B, Yustisi ALG, Bimo W, Pranadita S. 2018. Vertical Accuracy Assessment of DSM from TerraSAR-X and DTM from Aerial Photogrammetry on Paddy Fields – Karawang, Indonesia. Advances in Science, Technology and Engineering Systems Journal 3(4): 187-192.
- Somantri L. 2008. Pemanfaatan Teknik Penginderaan Jauh Untuk Mengidentifikasi Kerentanan dan Risiko Banjir. Jurnal Gea 8(2): 1-6.
- Hojati M. 2016. Determination of A Topographic Wetness Index Using High Resolution Digital Elevation Models. European Journal of Geography. 7(4): 41-52. December 2016. Association of European Geographers.
- Agus F and Mulyani A. 2006. Judicious Use of Land Resources for Sustaining Indonesian Rice Self Sufficiency. Proceedings International Rice Conference, 12-14 Sept. Denpasar, Bali. Indonesian Institute of Rice Research, Sukamandi. pp.121- 133.
- Buchanan BP, Fleming M, Schneider RL, Richards BK, Archibald J, Qiu Z, Walter MT. 2014. Evaluating Topographic Wetness Indices Across Central New York Agricultural Landscapes. Hydrology and Earth System Science 18:3279–3299.
- DPKPP. 2016. Dinas Pertanian Kehutanan Perkebunan dan Peternakan. Laporan Potensi Pertanian di Kabupaten Karawang.
- Hartini S, Hadi MP, Sudibyakto S, Poniman A. 2015. Risiko Banjir pada Lahan Sawah di Semarang dan Sekitarnya. Majalah Ilmiah Globe. 17(1): 51-58. Badan Informasi Geospasial.
- [PSBA] Pusat Studi Bencana Alam UGM dan Bakosurtanal. 2005. Laporan Pengkajian Model Pemetaan Risiko Bencana Alam-Yogyakarta.
- Raharjo PD. 2009. Pemodelan Hidrologi Untuk Identifikasi Daerah Rawan Banjir di Wilayah Surakarta dengan SIG. Jurnal LIPI: Limnotek. 16(1) :1-9. 2009.
- Fajar Y, Marfai MA, Parwati, Suwarsono. 2009. Model Simulasi Luapan Banjir Sungai Ciliwung di Wilayah Kampung Melayu–Bukitduri Jakarta. Jurnal Penginderaan Jauh. 6: 43-53.
- [BNPB] Peraturan Kepala Badan Nasional Penanggulangan Bencana 2012, tentang Pedoman Umum Pengkajian Risiko Bencana. BNPB, Jakarta.
- Rosyidie A. 2013. Banjir Fakta dan Dampaknya, Serta Pengaruh dari Perubahan Guna Lahan. Jurnal Perencanaan Wilayah dan Kota. 24(3): 246-257.