NemoMap: Improved Motif-centric Network Motif Discovery Algorithm

Adv. Sci. Technol. Eng. Syst. J. 3(5), 186–199 (2018);
 DOI: 10.25046/aj030523
Network motif analysis has several applications in many different fields such as biological study and social network modeling, yet motif detection tools are still limited by the intensive computation. Currently, there are two categories for network motif detection method: network-centric and motif-centric approach. While most network-centric algorithms excel in enumerating all potential motifs of a given size, the runtime is infeasible for larger size of motifs. Researchers who are interested in larger motifs and have established a set of potential motif patterns could utilize motif-centric tools to check whether such patterns are truly network motifs by mapping them to the target network and counting their frequency. In the paper, we present NemoMap (Network Motif Mapping algorithm) which is an improvement of the motif-centric algorithm, GK (by Grochow and Kellis) and MODA (Motif Detection Algorithm). Experimental results on three different protein-protein interaction networks show that NemoMap is more efficient in mapping complex motif patterns, while GK and MODA is much faster in analyzing simpler patterns with fewer edges. We also compare the performance of NemoMap and ParaMODA (introduced previously to improve MODA), and the result shows that NemoMap yields better runtime due to the implementation of Grochow-Kellis’ symmetry-breaking technique and the better node selection process.
1. Introduction
Advancements in modern computer processing power and storage capability have enabled the collection of large-scale networks such as social networks, computer networks, and biological networks. These networks hold thousands or even millions of nodes (vertices), and they could be modelled using the graph structure which allows researchers from different fields to study under a common framework. One of the biggest challenges in network analysis is to determine network motifs, defined as the subgraph patterns that occur more frequently in the original network than in similar randomized networks. As an extension of work originally presented in IEEE International Conference on Bioinformatics and Biomedicine (BIBM), 2017 [1], The motivation for network motif study comes from the desire to gain more insight on the structural foundation of complex networks because those substructures might be the key component of a specific functionality. Such knowledge could be used to classify networks into “superfamilies” [2], or to select appropriate network model to study a real network [3]. In biological networks, network motif analysis has been used for discovering basic functional foundation in Transcriptional Regulation Networks (TRN) [4, 5], predicting interaction in Protein-Protein Interaction (PPI) networks [6], and studying breast-cancer related genes [7].
Although network motif analysis has significant applications in the real world, in practice it is infeasible to find motif of larger size because the process involves a nondeterministic polynomial time (NP) isomorphic testing and statistical testing. Two graphs which have the same number of nodes connecting in the same way are considered isomorphic, and most network motif analysis includes a huge number of isomorphic testing to classify motif and to avoid double counting. Additionally, statistical testing is used to determine the uniqueness of motifs in a number of similar randomly generated networks and the same process of isomorphic testing runs for each newly created network (or ensemble of networks), so time complexity increases dramatically. Typically, more than 1,000 networks are generated, and the frequency of each motif is statistically compared using P-value or Z-score. A subgraph pattern with P-value of less than 0.01 or a Z-score of higher than 2 is identified as a network motif [8]. Such operations are very time consuming and usually are the main bottleneck of network motif analysis.
There have been several motif detection algorithms developed over the years, and they generally fall into two categories: network-centric and motif-centric [9]. The network-centric approach would search all possible enumerations of subgraphs of a given size in the target network, while the motif-centric method would predetermine one or more query graph patterns then count the occurrence of each query graph in the original network. Both approaches utilize statistical testing to check the significance of each potential motif.
Here, we propose NemoMap (Network Motif Mapping algorithm) which is an extension of ParaMODA in [1]. NemoMap improves the performance of ParaMODA which is an improvement of the motifcentric algorithms developed by Grochow-Kellis (GK) [10]. NemoMap is implemented in C++ so that it can be included in NemoLib [11], which is currently developed with Java, C++ and Python and includes networkcentric method only. With the addition of NemoMap in NemoLib, we expect to have both choices available in a single library. In this paper, we also compare the performance of NemoMap against GK, as well as ParaMODA.
The rest of the paper is organized as the following:
Section 2 describes background information of network motif; Section 3 discusses NemoMap algorithm and its implementation; Section 4 reports experimental results and performance comparison, followed by conclusion and future works in Section 5.
2. Network Motif
2.1. Network Motif Detection
Network motifs were introduced in 2002 by Milo et al. as “patterns of interconnections occurring in complex networks at numbers that are significantly higher than those in randomized networks” [4]. Suppose we have a network G with |G| vertices, and a number k such that 3 ≤ k << |G|. A connected subgraph M of size k which appears more frequently in G than a predetermined threshold value is a network motif. Typically, we use the statistical P-value or Z-score of the frequency of M in thousands of randomly generated similar networks as the threshold value.
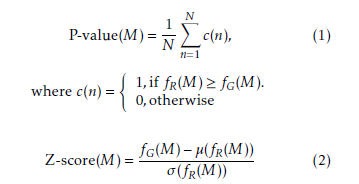 Here, N is the number of random graphs, and fG(M) is the frequency of M in the target network while fR(M)is the frequency of M in the random network. µ(fR(M)) is the mean of frequencies of M in the random networks and σ(fR(M)) is the standard deviation of frequencies of M in the random networks.
Generally, a subgraph with P-value < 0.01 or Zscore > 2.0 is considered a network motif after analyzing in more than 1,000 random networks [8].
2.2. Isomorphic Testing
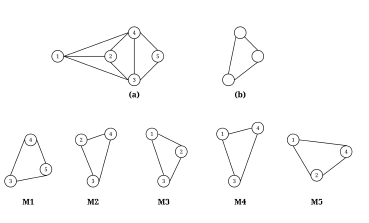 Figure 1: (a) A sample undirected graph; (b) A subgraph pattern; (c) M1-M5 are all isomorphic to (b)
Two graphs are isomorphic if they have the same number of nodes and there is “a one-to-one mapping between their nodes such that each edge in one graph can be mapped to an edge in the other graph” [12]. Figure 1 shows isomorphic subgraph patterns as an example. Since isomorphic testing is known to be an NP-complete problem, a common practice for categorizing graphs is to use a program called Nauty [13] to canonically label subgraph patterns; if two graphs have the same canonical label, they are isomorphic. One drawback of using Nauty is its dependency on the Linux operating system.
Another technique for analyzing isomorphism is comparing certain invariants of the graphs such as the degree of each node or the degrees of each node’s neighbors [10]. Those properties are inherent to the structure of the graph, so two graphs are isomorphic if they have the same properties. Here, we will utilize the later approach because we want the implementation without Nauty, to be operating system (OS) independent.
2.3. Network-Centric Approach
Many researchers have developed algorithms and software implementations of network motif detection focusing on the network-centric approach which searches all possible enumerations of subgraphs of a given size in the original target network. Some of the most distinguished applications include MAVisto [14], MFinder [15], FANMOD [16, 17], Kavosh [18], NemoFinder [19], and NetMODE [20], most of which involve the typical process of enumerating different k-size subgraphs in the original network. Unfortunately, even with modern computer architecture such solutions are still limited in the size of detectable motifs. Network-centric algorithms using exhaustive exact enumeration of k-size subgraphs in the network can often find only motifs with up to 6 nodes [10] due to the time-consuming process of scanning for every nodes and edges of the network.
One method to substantially reduce such processing time is sampling, employed by applications like MFinder and FANMOD. MFinder uses an edgesampling strategy introduced by Kashtan et al. [15] which randomly selects an edge in the target network then picks a k-size subgraph around that edge to compare. However, edge-sampling technique seems to be biased toward subgraphs that have more edges resulting in higher count for such subgraphs [12]. Additionally, there is also the node-sampling strategy used by FANMOD which assigns a probability to the node to determine the chance that such node would be explore further [17]. The later sampling technique proves to be more efficient in reducing runtime, yet it could only increase FANMOD maximum discoverable motif size to 8 nodes.
2.4. Motif-Centric Approach
Due to the limitation of network-centric algorithms, Grochow and Kellis (GK) introduced a different approach for larger motif detection by first determining a query list of subgraph patterns of size k, then finding the frequency of each pattern in the target network by mapping the query graphs to all possible location in the network [10].
This strategy is described as “motif-centric”, and the application can find motifs of up to 15 nodes. Moreover, the algorithm employs an efficient enumeration process called symmetry-breaking technique to significantly reduce isomorphic testing which is one of the most intensive tasks in network motif detection. The symmetry-breaking condition ensures that each mapping of the query graph to the target network is unique so that unnecessary isomorphic testing is avoided. However, one disadvantage is that it requires a set of query subgraphs to start with. Therefore, if the researcher has no method to determine an appropriately concise k-size query list, run-time can suffer heavily with increasing subgraph size since full enumeration of all possible variations of k-size subgraphs is needed. Table 1 shows the exponential growth of pattern variations of k-size subgraphs up to 10 nodes, and in the worst-case scenario the application would have to iterate over 341,247,400,399,400,000,000 of 10-node patterns many of which might not even exist in the target graph [9].
Heavily inspired by Grochow-Kellis’ (GK) algorithm, MODA (Motif Discovery Algorithm) [21] improves upon the former by the introduction of a query graph hierarchy expansion treeas illustrated in Figure 2. MODA chooses a subgroup of the query graphs which might appear more frequently in the target network to start mapping with as the top level of the tree; then it adds one edge to each graph of the previous level while ensuring that no duplicate is present to build the subsequent level of the tree. Because each level is only extended by one edge, the mapping information of the previous level can be saved and reused to extend mapping by one node, so computation time would be reduced substantially. It also uses a nodesampling method during the edge-expansion based on the linearly proportional distribution of nodes and edges [9].
3. NemoMap
We propose NemoMap (Network Motif Mapping algorithm) as an extension of ParaMODA [1] which is an improvement of the motif-centric algorithm introduced by Grochow-Kellis (GK). We call it NemoMap since it is an improvement of the mapping function introduced by GK and we will include it in the NemoLib library [11]. Since this is a direct improvement of GK, we will firstly explain in detail the main components of GK, then discuss our alteration in NemoMap, and lastly compare the difference in implementation of NemoMap and ParaMODA.
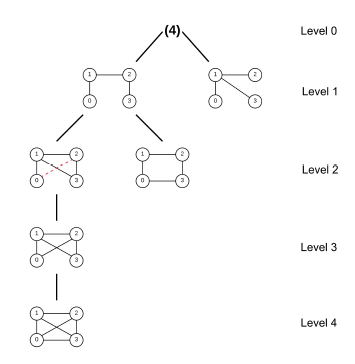 Figure 2: Expansion tree of size-4 subgraph, courtesy of [21]
3.1. Grochow-Kellis (GK)
We will discuss the mapping function of GK which focuses on the mapping of a query graph to the target network to find the frequency of such query graph’s appearance in the network because NemoMap and ParaMODA improve upon such functionality.
Suppose we have an input network G and a query graph H, and the goal is to find and count all the possible mapping f from H to G which G can support. GK mapping algorithm involves three functions as shown in Algorithm 1, 2, and 3.
As discussed in Section 2.4, GK utilizes comparison of two invariants between graphs to test for isomorphism: the degree of each node and the degrees of each node’s neighbors. It starts with an arbitrarily partial map of one node h of H to one node g of G, then extends that map by a single node for every recursive call of Isomorphic Extensions (Algorithm 2) until all nodes of H are mapped to appropriate nodes of G.
Additionally, Isomorphic Extensions guarantees that any newly mapped node is connected to the already mapped nodes, so the returned mapping must be an isomorphism [10].
Although the symmetry-breaking condition is optional, it significantly improves runtime and memory usage. Figure 3 shows symmetry-breaking example.
Without symmetry-breaking, Find Subgraph Instances (Algorithm 1) would have to maintain a list of all mappings in memory to screen out duplicate mappings resulting in low efficiency as the program has to constantly write and read data from memory or disk. On the other hand, symmetry-breaking ensures that each mapping is unique, so there is no need to maintain the mapping list. Such feature substantially reduces memory usage and runtime for larger network analysis or bigger size query graphs [10] as illustrated in Table 2.
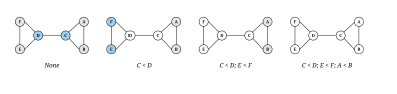 Figure 3: Symmetry-breaking example: Finding conditions that will break all the symmetries of a 6-node graph. White nodes are fixed by any automorphism preserving the indicated conditions, and other nodes are shaded according to their equivalence class under the automorphisms which preserve the indicated conditions. (Courtesy of [10])
3.2. Pramod
Compared to GK algorithm, ParaMODA follows closely with a couple of alterations. In FindSubgraphInstances in Algorithm 1, instead of going through all nodes h of H, we only arbitrarily choose one node h to traverse from. The chosen h node serves as the fixed starting point for all traversals of the query graph, and since the nodes of G are only traversed once with the chosen node h, the visited nodes g of G are not removed from the network [1]. There are no changes to
IsomorphicExtensions in Algorithm 2.
ParaMODA improves time complexity by eliminating the inner iteration (loop) in FindSubgraphInstances at the expense of not shrinking the network by keeping visited nodes. The performance comparison will be discussed in Section 4. The logic behind the removal of the inner iteration comes from the fact that if the query graph is connected and the network is unchanged, any node of the network could be used as the starting point for mapping because the set of edges remain unchanged [1].
Another advantage of ParaMODA is the possibility of parallelization. Since each mapping from H to G is unique and each starting mapping node of the network is independent, we can partition the vertices easily across processors and have the result aggregated. Because the nodes are ordered based on their degrees in descending order, we can achieve better load distribution across processes by using strategies that factor in the uneven nature of that distribution [1].
3.3. NemoMap
As an extension to ParaMODA [1], NemoMap maintains the core structure with two differences: the clarification of node h choosing process, and the implementation of symmetry-breaking technique. We implement NemoMap in C++ so that it can be included in the NemoLib library [11].
Instead of arbitrarily picking a node h of H to start the mapping process as discussed in Section 3.2, NemoMap chooses the most constrained node h to traverse from. This selection process starts with picking the node with the highest degree, and if there are more than one nodes with the same highest degree we will
Algorithm 1: FindSubgraphInstances (G,H), by courtesy of [10]
Find all instances of query graph H in network G
Input : Graph G and a query graph H
Output: A set of all instances of H in G
Start with an empty set of instances
Find Aut(H). Let HE be the equivalence representatives of H
Find symmetry-breaking conditions C of H given HE and Aut(H)
Order the nodes of G by increasing degree and then by increasing neighbor degree sequence for each node g of G do for each node h of H such that g can support h do
Let f be the partial map associating f (h) = g
Find all isomorphic extensions of f [up to symmetry] (i.e. call IsomorphicExtensions (f ,H,G, C[h]))
Add the images of these maps to the set of all instances
Remove g from G
Return the set of all instances.
Table 2: The number of subgraphs encountered by NemoMap with and without symmetry-breaking (including multiple encounters for the version without symmetry-breaking). The improvement factor is exactly the average number of automorphisms of subgraphs of the associated size. (Courtesy of [10])
select among them the node with the highest sum of neighbors degrees. If there is still a tie after the second selection round, we will arbitrarily choose one node among the last filtered group to be node h. Such selection process helps reduce the number of recursive isomorphic testing as the constrained node h has a lower chance of being mapped to nodes in G, resulting in a faster runtime. Algorithm 4 shows the altered process.
Without symmetry-breaking, ParaMODA suffers from memory overhead issue when analyzing query with a large number of mappings because the program has to maintain a list of mappings to avoid duplication. As a result, the program frequently runs out of memory and crashes if the target network is large. Furthermore, it also has slower runtime as redundant recursive calls for isomorphic testing are completed. NemoMap solves this problem by including the GK symmetrybreaking condition with a little tweak. Because only one node h of H is chosen, SymmetryConditions in Algorithm 3 does not need to find the symmetry-breaking conditions for all nodes of H; only the conditions of the selected node h are needed as illustrated in Algorithm
NemoMap implementation also uses the standard vector data structure instead of the user-defined class Mappings as in ParaMODA program. The change is due to performance optimization, and from the fact that all query graph mappings always start from one fixed node h with the same extension path. Therefore, from the standpoint of a key-value pair of the Mappings class with the keys representing mapped nodes h of query graph H, the key’s sequence order will always be the same, so there is no need to maintain such data; we can save it at the beginning for later use if necessary. Instead, we use a vector to store the values, i.e. the corresponding mapping nodes g of network G, in the correct order that the keys are in.
The input file format for the query graph and the target network of NemoMap remains the same with each line contain two integers separated by a white space or a tab. Each line of the input file represents an edge of the graph, and the two integers are the ID number of the nodes which form such edge. Lines start with “#” are comments and will be ignored [1]. Additionally, the program disallows self-edge, i.e. edge from a node pointing to itself, as well as duplicating edge.
| Algorithm 2: IsomorphicExtensions(f ,H,G, C[h]), by courtesy of [10]
Find all isomorphic extensions of partial map f : HG [satisfying C(h)] Input :Partial map f : H → G, a graph G, query graph H, and a symmetry-breaking condition C(h) Output:All isomorphic extensions of f Start with an empty list of isomorphisms Let D be the domain of f if D = H then Return a list consisting solely of f. (Or write to disk) Let m be the most constrained neighbor of any d ∈ D (constrained by degree, neighbors mapped, etc.) for each neighbor n of f (D) do if there is a neighbor d ∈ D of m such that n is not neighbors with f (d), or if there is a non-neighbor d ∈ D of m such that n is neighbors with f (d), or if assigning f (m) = n would violate a symmetry-breaking condition in C(h)] then Continue with the next n else Let f 0 = f on D, and f 0(m) = n Find all isomorphic extensions of f 0 Append these maps to the list of isomorphisms Return the list of isomorphisms. Algorithm 3: SymmetryConditions(HE,Aut(H)), by courtesy of [10] Find symmetry-breaking conditions for H given HE, Aut(H) Input :Nodes of H grouped into equivalence classes HE, automorphisms of H Aut(H) Output:A map from equivalence representatives to sets of symmetry-breaking conditions Let M be an empty map from equivalence representatives to sets of conditions for each n ∈ HE do Let C be an empty set of conditions n0 = n A = Aut(H) do Add “Label(n0) <Min{Label(m)|m ∼ An0 and m , n0}” to C A = {f ∈ A|f (n0) = n0} Find the largest A-equivalence class E Pick n0 ∈ E arbitrarily while |A| , 1 Let M(n) = C Return M |
As discussed earlier, the program generates a list of mappings of the query graph H in all possible locations of the network G. The mappings can be saved to disk if necessary, however the current NemoMAp implementation simply discards them and only count the number of mappings found.
3.4. Summary of Changes
The changes in NemoMap vs. GK algorithm are picking one fixed node h in terms of mapping and finding symmetry-breaking condition of only that node. NemoMap is implemented in C++ and includes the symmetry-breaking technique, while ParaMODA is written in C# and does not have symmetry-breaking; NemoMap also have an improved node h selection process. Table 3 summarizes the changes.
4. Experiments
4.1. Setup
Motif-centric approach is not primarily designed for exhaustive search of network motif, so we will focus on comparing runtime performance between NemoMap and GK on predetermined query graph mapping. The experiment will include two parts: performance comparison between NemoMap and ParaMODA, and between NemoMap and GK. All testing will be conducted on three protein-protein interaction (PPI) networks obtained from the Database of Interacting Proteins (DIP)
[22]:
- Homo sapiens (Hsapi): 1,715 nodes with 1,873 edges (low edge density)
- Escherichia coli (E. coli): 1,223 nodes with 1,654 edges (average edge density)
- Saccharomyces cerevisiae (S. cerevisiae): 2,164 nodes with 4,303 edges (high edge density)
| Algorithm 4: FindSubgraphInstances NemoMap(G,H)
Find all instances of query graph H in network G Input :Network G and a set of query graph H Output:A set of all instances of H in G Start with an empty set of instances Pick the most constrained node h from H (constrained by degree, sum of neighbors’ degrees) Find Aut(H) Find symmetry-breaking conditions C of h given Aut(H) Order the nodes of G by increasing degree and then by increasing neighbor degree sequence for each node g of G such that g can support h do Let f be the partial map associating f (h) = g Find all isomorphic extensions of f [up to symmetry] (i.e. call IsomorphicExtensions (f ,H,G, C[h])) Add the images of these maps to the set of all instances Return the set of all instances. Algorithm 5: SymmetryConditions NemoMap(HE,Aut(H)) Find symmetry-breaking conditions for H given HE, Aut(H) Input :Automorphisms of H,Aut(H) Output:A set of symmetry-breaking conditions for node h Let C be an empty set of conditions n0 = n A = Aut(H) do Add “Label(n0) <Min{Label(m)|m ∼ An0 and m , n0}” to C A = {f ∈ A|f (n0) = n0} Find the largest A-equivalence class E Pick n0 ∈ E arbitrarily while |A| , 1 Let M(n) = C Return M |
As mentioned in [1], the performance difference between ParaMODA and GK algorithm varies widely depending on the query graph used. In this paper, we attempt to elaborate which query graph categories are more advantageous to each algorithm. Therefore,
we break down the query graphs into three pattern groups:
- Group Simple: Low edge-to-node count
- Group Average: Average edge-to-node count
- Group Complex: High edge-to-node count
We choose to use the ratio of edge count to node count as a measure for a graph complexity with higher ratio equating to higher complexity. Although there are other factors in a graphs complexity such as outdegree distribution, we think using the edge-to-node ratio would making the experiment more manageable. Each query graph group consists of four query graphs with four to seven nodes. All tests were conducted on a desktop computer with the following specifications:
- CPU: Intel Core i5-8400 (6-core) 2.80Ghz, Turbo
- RAM: 16GB DDR4 2133Mhz
- Hard Drive: 240GB SSD
- GPU: Intel UHD Graphics 630
- OS: Windows 10 Home Edition
Table 3: Summary of changes of NemoMap compared to ParaMODA and GK
| NemoMap | ParaMODA | GK | |
| Language | C++ | C# | Java |
| Mapping | Pick the most constrained node h of query graph H (constrained by degree, sum of neighbors’ degrees), then start all mapping from the h, and do not remove mapped node g | Pick an arbitrary node h of query graph H, then start all mapping from the h, and do not remove mapped node g | Iterate over all nodes of H (or all representative node of H if symmetrybreaking is used), and remove mapped node g after
every iteration |
| Symmetrybreaking | Find symmetry-breaking condition for only one fixed node h | Symmetry-breaking condition is not included | Find symmetry-breaking condition for all representative nodes of H |
- IDE: Visual Studio 2017 Community
The source code of Grochow-Kellis’ algorithm in
Java was provided by the author [10], and all runtimes reported for GK are measured using this implementation. The source code was compiled with the IntelliJ IDEA 2018.5 Community IDE.
4.2. Performance Metrics
The primary performance metric is runtime measured in milliseconds (ms). The comparison metric Reduction is computed to represent the relative performance between NemoMap and GK algorithm, and is defined in Equation (3):
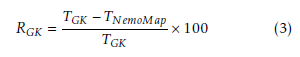 Here, TGK is the runtime of Grochow-Kellis’ algorithm in millisecond (ms), and TNemoMap is the runtime of NemoMap in ms. RGK represents the relative reduction in runtime from using NemoMap instead of GK expressed in percentage.
Another similar metric RP araMODA is computed to represent the relative performance between NemoMap and ParaMODA, and is defined in the following equation:
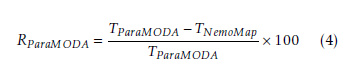 TP araMODA, TNemoMap are the runtime of ParaMODA in ms and NemoMap in ms respectively, and RP araMODA is the relative reduction in runtime from using NemoMap instead of ParaMODA expressed in percentage.
4.3. Results and Discussion
We show the results comparing the performance of NemoMap against Grochow-Kellis as well as of NemoMap against ParaMODA in Table 4, Table 5, and Table 6.
4.3.1. NemoMap vs. ParaMODA
In all cases, the implementation of NemoMap ran significantly faster than ParaMODA, and the performance gap widens when the complexity of the network increases. Starting with the simpler network of Hsapi
(1,715 nodes and 1,873 edges: edge-to-node ratio of 1.09) in Table 4, we have runtime reduction ranging from 61.29% to 99.57% when using NemoMap; the second network of E. coli has more complexity with a higher edge-to-node ratio (1,223 nodes and 1,654 edges: ratio of 1.35) which results in a higher reduction rate of between 93.58% to 99.97% in runtime as recorded in Table 5; lastly, in Table 6, the most complex network S. cerevisiae with a very high edge-to-node ratio of 1.99 (2,164 nodes and 4,303 edges) yields an even higher reduction range from 94.16% to 99.96% in runtime for NemoMap.
ParaMODA ran out of memory and stopped in several runs, most of which are case with large numbers of mappings (more than 9 million mappings). As discussed in earlier sections, this problem could be addressed by introducing symmetry-breaking technique into the program so that maintaining a list of mappings in memory is not needed. Furthermore, symmetrybreaking also reduced runtime by eliminating redundant isomorphic testing which is the most intensive task of subgraph mapping. Other elements that might help improve runtime include language performance difference between NemoMap and ParaMODA and the level of code optimization.
4.3.2. NemoMap vs. Grochow-Kellis
As mentioned in our previous work [1], performance difference between ParaMODA and GK varied depending on the query graph. Therefore, we attempt to figure out the factors affecting performance difference between NemoMap and GK in this paper by dividing query graphs into groups. For illustration purposes, we sketch the performance in runtime (ms) of NemoMap and GK with line charts on the networks of Hsapi, E. coli, and S. cerevisiae in Figure 4, 5, and 6 respectively. Each Figure contains three charts for the three different groups of query graphs as described in Section 4.1: (a), (b), and (c) denotes the Simple, Average, and Complex pattern accordingly.
In most scenarios, GK’s algorithm was substantially slower than NemoMap. However, in the case of simple query graphs which had a small count of edges (edge count was smaller than node count), NemoMap runtime was slower as illustrated by chart (a) of Figure 4, 5, and 6 with increasing performance gap when the query graph size gets bigger. Interestingly, NemoMap was faster for simple query graphs of size 4, but it dragged behind for size-5 and larger query graphs. The runtime also got slower when the network becomes more complex: on the Hsapi, NemoMap was behind by 40.79% to 72.06%; for the E. coli, the gap increased to up to 89.30% slowdown; lastly, the S. cerevisiae networks show slower performance of between 49.63% to 90.76%.
On the other hand, when the query graphs became complex with more edges, NemoMap ran much faster than GK. Chart (b) and (c) of Figure 4, 5, and 6 all show exponential improvement in runtime when using NemoMap. Although we did not see an upward trend in performance improvement when the query graph size increases or when the network gets more complex, runtime reduction rate was consistently in the 75% to 90% range as recorded in Table 4, 5, and 6. The only exception was in Table 5 for the Average pattern size-6 query graph with improvement of only 48.84%.
Such observation was consistent in all three tested PPI networks. One possible explanation could be from the isomorphic testing phase, which is the most inten-
Table 4: Performance comparison on the PPI network of Hsapi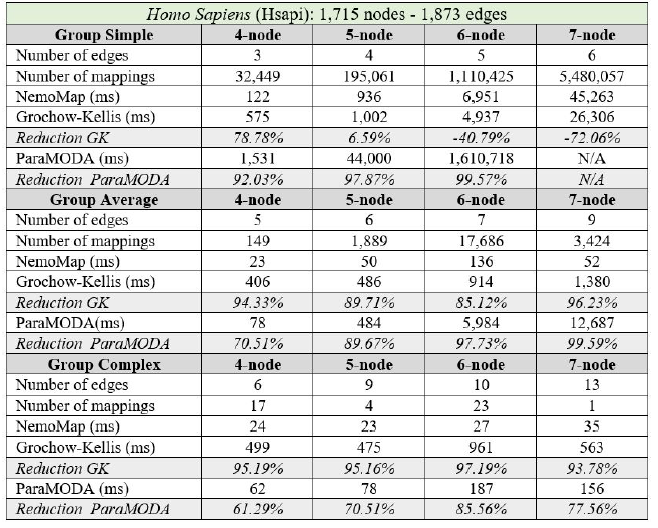
Table 5: Performance comparison on the PPI network of E. coli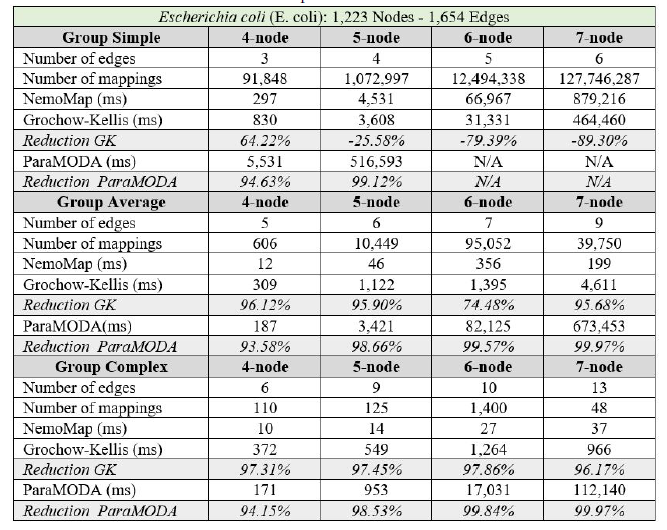
Table 6: Performance comparison on the PPI network of S. cerevisiae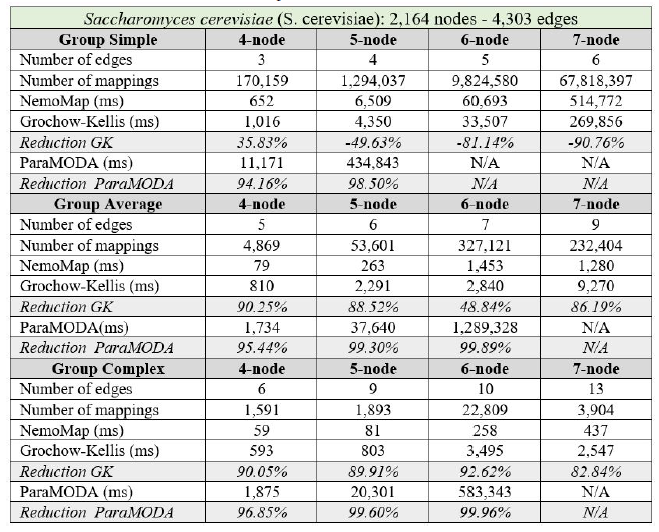
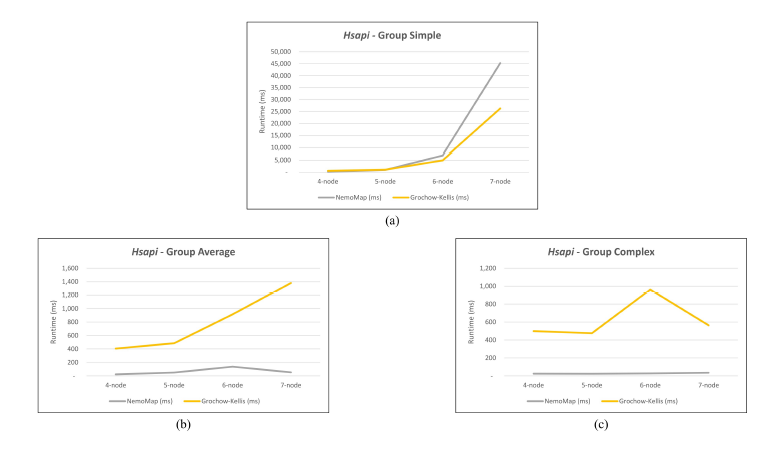 Figure 4: Graph of runtime against query graph size for (a) Simple graph, (b) Average graph, and (c) Complex graph between NemoMap and Grochow-Kellis for Hsapi. NemoMap outperforms in all cases except for (a).
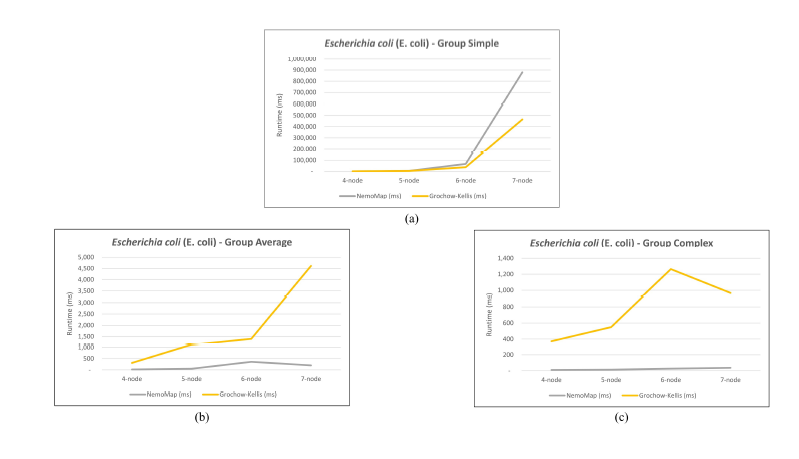 Figure 5: Graph of runtime against query graph size for (a) Simple graph, (b) Average graph, and (c) Complex graph between NemoMap and Grochow-Kellis for E. coli. NemoMap outperforms in all cases except for (a).
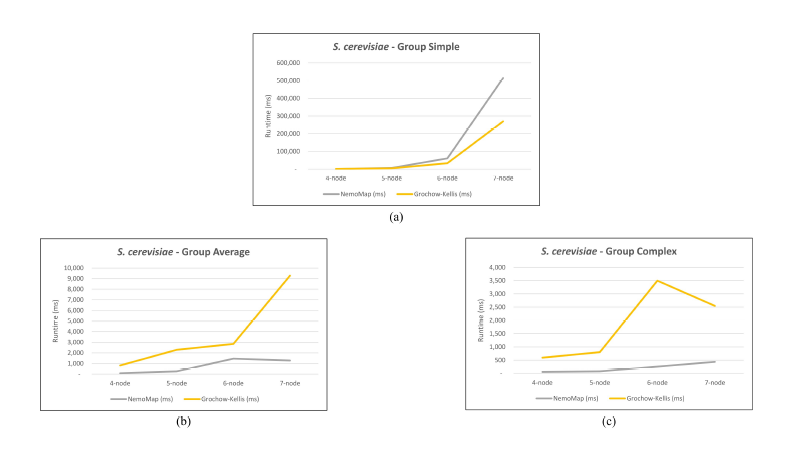 Figure 6: Graph of runtime against query graph size for (a) Simple graph, (b) Average graph, and (c) Complex graph between NemoMap and Grochow-Kellis for S. cerevisiae.
NemoMap outperforms in all cases except for sieve task of the subgraph mapping. As discussed in Section 3.1, GK uses two invariants between graphs to test for isomorphism: the degree of each node and the degrees of each nodes neighbors. To clarify the first invariant, when trying to map a node h of query graph H to a node g of network G, if node g’s degree is smaller than node h’s degree then h cannot be mapped to g and the function must move on to another node g as illustrated in Figure 7.
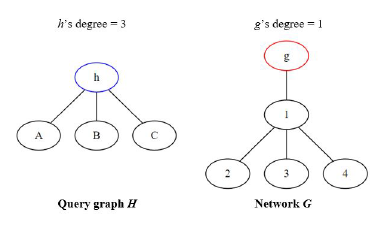 Figure 7: Node h cannot be mapped to node g because g’s degree is smaller than h’s degree
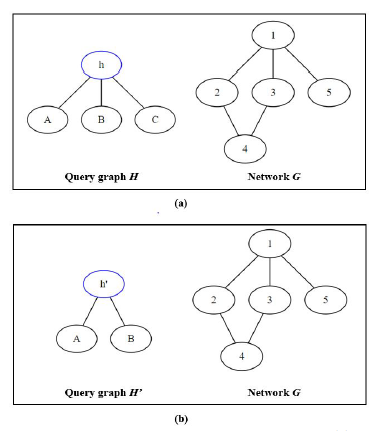 Figure 8: Mapping two different query graphs (a) H, and (b) H’ to the same network G
Looking at two different scenarios as illustrated in Figure 8, we have one network G and we want to map two query graphs H and H0 to. Assuming that we choose the first mapping node h and h0 as highlighted for each query graph, and we examine the possibility of mapping node h to each node of network G.
In scenario (a), node h has a degree of three so only node 1 of G can support it. As a result, the recursive call for isomorphic testing will only be called and branched out when trying to map node h to 1; node 2, 3, 4, and 5 will be aborted early so no isomorphic test is ran. On the other hand, in scenario (b), node h0 has a degree of two so node 1, 2, 3, and 4 can all support it, resulting in a lot more of isomorphism recursive tests since only mapping to node 5 can be aborted early.
The larger number of isomorphic tests and the lower chance to abort early in (b) are advantageous for GK because it uses the same isomorphic testing algorithm as NemoMap, but the network is getting smaller and smaller after every iteration because GK removes mapped nodes from the network unlike the fixed network of NemoMap. However, GK needs to iterate over all nodes of H0, so the removal effect might get canceled out. If the query graph is highly symmetrical and symmetry-breaking is used, then it will unlikely to be fully even out. Recall that with symmetry-breaking, GK only iterates over representative nodes of equivalence class. In (b), node A, B, and C belong to the same equivalence class as they are symmetrical (for more detail on equivalence class please reference [10]), so instead of iterating over four nodes (h0, A, B, and C), Grochow-Kellis would only iterate over two nodes (h0 and one arbitrary node from the equivalence class). Such effect might help GK retain better performance on simpler query graphs with lower nodes’ degrees and large equivalence classes.
As mentioned in the previous section, other elements that might affect runtime include language performance difference between C++ and Java and the level of code optimization.
5. Conclusion and Future Works
In this paper, we present NemoMap, a motif-centric algorithm inspired by the work of Grochow and Kellis [10], as a tool to determine the frequency of a subgraph’s appearance in a target network. Extending from our previous work in ParaMODA [1], the new experimental results show that there is improvement in performance using NemoMap, yet it does not apply in all cases. Specifically, we observe that NemoMap runs much faster when analyzing complex query graphs with more edges, while Grochow-Kellis’ solution is more efficient for simpler query graphs with fewer edges (i.e. lower degrees) and high symmetry. As an extension, NemoMap also sees large improvement in runtime and memory usage compared to the predecessor ParaMODA due to the utilization of symmetrybreaking technique and the better node selection process.
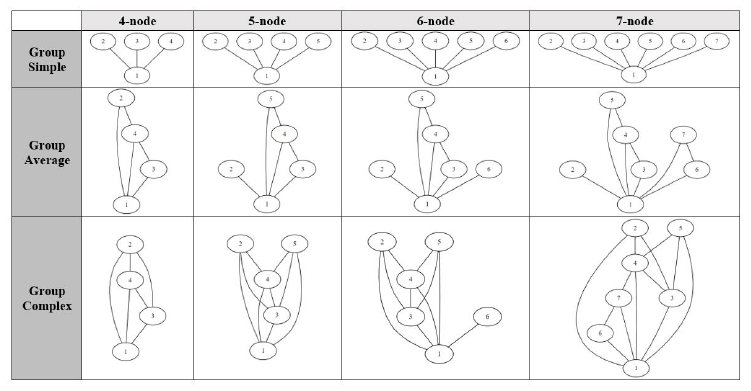 Figure 9: Visualization of groups of query graphs used for testing
Additionally, NemoMap structure allows for an easier parallelization scheme, as multiple query graphs or different nodes of the same query graph can be assigned to different processors running concurrently. Such operation is necessary for future research as the need for finding larger network motif becomes more prominent. Another essential future item is the implementation of a random network generator and a statistical analysis system into the mapping function so that the NemoMap program could become a complete network motif detection suite.
- S. Mbadiwe and W. Kim. Paramoda: Improving motif-centric subgraph pattern search in ppi networks. In 2017 IEEE International Conference on Bioinformatics and Biomedicine (BIBM), pages 1723–1730, Nov 2017.
- Ron Milo, Shalev Itzkovitz, Nadav Kashtan, Reuven Levitt, Shai Shen-Orr, Inbal Ayzenshtat, Michal Sheffer, and Uri Alon. Superfamilies of evolved and designed networks. Science, 303(5663):1538–1542, March 05 2004.
- Manuel Middendorf, Etay Ziv, and Chris H. Wiggins. Inferring network mechanisms: The drosophila melanogaster protein interaction network. Proceedings of the National Academy of Sciences of the United States of America, 102(9):3192–3197, 2005.
- R. Milo, S. Shen-Orr, S. Itzkovitz, N. Kashtan, D. Chklovskii, and U. Alon. Network motifs: Simple building blocks of complex networks. Science, 298(5594):824–827, 2002.
- R. Milo, N. Kashtan, S. Itzkovitz, M. E. J. Newman, and U. Alon. On the uniform generation of random graphs with prescribed degree sequences. eprint arXiv:cond-mat/0312028, December 2003.
- I. Albert and R. Albert. Conserved network motifs allow protein-protein interaction prediction. Bioinformatics, 20(18):3346–3352, December 2004.
- Yuji Zhang, Jianhua Xuan, Benilo G de los Reyes, Robert Clarke, and Habtom W. Ressom. Network motif-based identification of breast cancer susceptibility genes. In 2008 30th Annual International Conference of the IEEE Engineering in Medicine and Biology Society, pages 5696–5699. IEEE, aug 2008.
- Bjvrn H. Junker and Falk Schreiber. Analysis of Biological Networks. Wiley, 2008.
- W. Kim, M. Diko, and K. Rawson. Network motif detection: Algorithms, parallel and cloud computing, and related tools. Tsinghua Science and Technology, 18(5):469–489, Oct 2013.
- Joshua A. Grochow and Manolis Kellis. Network motif discovery using subgraph enumeration and symmetry-breaking. In Proceedings of the 11th annual international conference on Research in computational molecular biology, RECOMB’07, pages 92–106, Berlin, Heidelberg, 2007. Springer-Verlag.
- Andrew Andersen andWooyoung Kim. NemoLib: A Java Library for Efficient Network Motif Detection, pages 403–407. Bioinformatics Research and Applications: 13th International Symposium, ISBRA 2017, Honolulu, HI, USA, May 29 June 2, 2017, Proceedings. Springer International Publishing, Cham, 2017.
- Elisabeth Wong, Brittany Baur, Saad Quader, and Chun-His Huang. Biological network motif detection: principles and practice. Briefings in Bioinformatics, 2011.
- B. McKay. Practical graph isomorphism. Congr Numer, 30:45–87, 1981.
- F. Schreiber and H. Schwobbermeyer. Mavisto: a tool for the exploration of network motifs. Bioinformatics, 21:3572–3574, 2005.
- N. Kashtan, S. Itzkovitz, R. Milo, and U. Alon. Efficient sampling algorithm for estimating sub-graph concentrations and detecting network motifs. Bioinformatics, 20:1746–1758, 2004.
- S. Wernicke. Efficient detection of network motifs. IEEE/ACM transactions on computational biology and bioinformatics, 3(4):347–359, December 01 2006.
- S. Wernicke and F. Rasche. Fanmod: a tool for fast network motif detection. Bioinformatics, 22:1152–1153, 2006.
- Zahra Kashani, Hayedeh Ahrabian, Elahe Elahi, Abbas Nowzari-Dalini, Elnaz Ansari, Sahar Asadi, Shahin Mohammadi, Falk Schreiber, and Ali Masoudi-Nejad. Kavosh: a new algorithm for finding network motifs. BMC Bioinformatics, 10(1):318, 2009.
- Jin Chen, Wynne Hsu, Mong Li Lee, and See-Kiong Ng. Nemofinder: Dissecting genome-wide protein-protein interactions with meso-scale network motifs. In Proceedings of the 12th ACM SIGKDD International Conference on Knowledge Discovery and Data Mining, KDD ’06, pages 106–115, New York, NY, USA, 2006. ACM.
- Xin Li, Douglas S. Stones, Haidong Wang, Hualiang Deng, Xiaoguang Liu, and Gang Wang. NetMODE: Network motif detection without nauty. PLoS ONE, 7(12):e50093, 2012.
- Saeed Omidi, Falk Schreiber, and Ali Masoudi-Nejad. Moda: An efficient algorithm for network motif discovery in biological networks. Genes and Genetic Systems, 84(5):385–395, 2009.
- I. Xenarios, L. Salwinski, X. J. Duan, P. Higney, S. M. Kim, and D. Eisenberg. DIP, the database of interacting proteins: a research tool for studying cellular networks of protein interactions. Nucleic acids research, 30(1):303–305, Jan 1 2002.