Designing Experiments: 3 Level Full Factorial Design and Variation of Processing Parameters Methods for Polymer Colors

Adv. Sci. Technol. Eng. Syst. J. 3(5), 109–115 (2018);
 DOI: 10.25046/aj030515
In this work, we investigate the effects of variation of processing parameters on the quality of dispersion of polycarbonate compound. In order to achieve appropriate pigments dispersion, we performed compounding process parameters optimizations, by investigating three processing parameters, temperature, screw speed, and feed rate. We utilized experimental design for the optimization of process parameters based upon three levels full factorial response surface methodology was utilized. The experimental designs, statistical and numerical optimization were performed using design expert software. Statistical equation was developed to understand individual parameters interactions on the values of color. The model was established as statistically significant based on diagnostic tests performed. Our analysis of variance (ANOVA) illustrates that the parameters of color (dL*, da* and db*) are affected by the three investigated parameters. The process parameters required to attain color values in a minimum desirable deviation dE* of 0.8 were found through optimization to be equal to 245.26 oC, 741.27 rpm, and 24.72 kg/hr. Furthermore, we also demonstrate variations of the processing variables while other parameters remained constant (General Trends). Both strategies generated process parameters that were statistically significant.
1. Introduction
Because color has a vital function for the production of polycarbonate pigments, materials need to be extruded with good dispersion properties and uniform particle sizes. In order to yield plastic with a commercial sable color, adding pigments to it is usually required. However, a great challenge is likely to be faced to attain the required color from the first attempt. Several variables affect the color properties of polymers compounding during their extrusion steps, including temperature, screw speed, feed rate, residence time, and screw configuration. Several researchers investigated the effects of such process variables on yielded color during polymers compounding [1- 2]. Being constituted of chemical species, it is likely that the pigments will take part in chemical reactions depending on process conditions. Thus, the correct selection of the right variables is vital to attain the color requirements. Furthermore, the time-temperature relationship can also affect the polymer characteristics. The required pigments dispersion and good uniformity can be attained by decreasing the viscosity of the resin and increasing the mixing time [3].
Spectrophotometers can serve as important measures to control the quality, quantify color, and numerically compare variations in colors [3].
Allowable tolerance limits in particular terms of dL*, da*, db* or dE* are usually chosed by the client; however, for the polycarbonate grade-3 under this study, limits were equal or less ≤ 1.0 for dE or ≤ 0.6 for dL*, da*, db* [4]. The deviation in L*, a*, b* is represented as “dE*, where
![]() Instead of using absolute values of color, color differences concerning target values regarding dL*, da* and db* are used. The total change in color, dE* is used to represent the color difference in the CIELAB color space [5].
Instead of using absolute values of color, color differences concerning target values regarding dL*, da* and db* are used. The total change in color, dE* is used to represent the color difference in the CIELAB color space [5].
Design of Experiments (DOE) is a planned approach that allows an experimenter to plan the experiments and determine cause-and-effect relationships. DOE is extensively used in numerous areas of science because it reduces the number of experiment that need to be performed.
For optimal dispersion of these pigments, the optimization of extrusion process parameters is required. Researchers designed experiments to evaluate the effect of process parameters on colour properties of a compounded polycarbonate grade. A regression model was generated. Several factors were contributed to color mismatch. Such factors need to be studied to understand their effect on output colour [6 ,7, 8].
Many experimental designs have been recognized as useful techniques to optimize process variables. A modified general factorial DOE has been employed for investigating the effect of changes in compounding process variables on gloss and surface appearance of a PVC sheet. [9] .Different types of RSM designs are available, including a factorial design, central composite design (CCD), Box-Behnken design, and D-optimal design. [10] The execution of a DOE involving the Box-Behnken design (BBD) has been reported to determine a relationship between processing parameters and viscosity variation for a wood-plastic compound [11].
The BBD, being a combined array design, requires fewer runs than Taguchi’s crossed array designs and allows estimation for significant interactions. [12] It is the most efficient design in terms of runs and requires only three levels of each factor in order to generate a quadratic model. [12,13] To estimate curvature, other designs require either five levels of each factor such as in a central composite design (CCD) or even more experimental runs such as in a three level factorial design.
Analysis-of-variance (ANOVA) is essential to validate the significance and fitness of the model; it explains, whether the developed quadratic model is meaningful. It investigated the bearing of process parameters and interaction of these parameters. The robustness of RSM designs is ensured by considering the propagation of error (POE). POEs, a measure of the standard deviation of the transmitted variability in the output response, are caused by fluctuations in significant controllable process variables during experimentation assuming uncontrollable factors (noise) to be zero. [14].
In this study, an experimental investigation of the processing parameters was conducted using DOE. DOE was utilized to determine the optimum number of experiments to be run so that sufficient data was available for analysis. The designs were prepared for three processing parameters: temperature, speed, and feed rate. The effect of the processing parameters on output response parameters was studied. Experimentation for various grades was carried out to observe the effect of controlled variation of different processing parameters on the colour attributes of compounded plastics. The results were analyzed to determine an optimum set of processing parameters in order to ensure minimum wastages and timely delivery of orders.
Statistical Design of Experiments can be used to study the color responses to variation in these processing parameters with the help of methods such as the Response Surface Methodology (RSM). In this approach the first step is to properly design experiments in order to evaluate model parameters efficiently after performing experiments. Second step is to develop a second order polynomial for the responses [14].
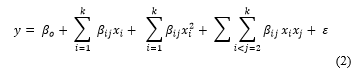 Where y is the predicted response, b0 is a constant, bi is the ith linear coefficient, bii is the ith quadratic coefficient, bij is the ith interaction coefficient, xi is the independent variable, k is number of factors and ε is error. Coefficients of the model predicted through regression of the obtained experimental data. Details of parameter estimations for the model done by these authors are reported elsewhere [13]. RSM is a collection of statistical and mathematical techniques useful for developing, improving and optimizing process. The Three-level full factorial design is one of the most powerful and efficient experimental design among other response surface designs (central composite, Doehlert matrix, and Box Behnken designs). The ultimate aim of the present study is to employ the 3 level full factorial design to optimize the processing parameters to have a minimum deviation in color properties (dE* < 0.8)
Focus was extended to study the variations of independent of processing parameters. Parameters were usedare such as temp, speed, and feed rate were used to affect the dependent responses for consistent output color (L*,a*,b*,dE*). The procedure of controlling the variations of two Processing parameters and keeping the third parameter constant (general trends), focused on the variation of the optimal federates parameters to achieve a minimum desirable deviation dE* of 0.3.
Design optimization of the two procedures to precisely determine cause and effect relationships. Both designs yielded models that were statistically significant and optimal color were found.
2. Experimental Set up
Experimentation was carried out for the investigated material at Industrial Plant. A blend of two polycarbonate resins was used along with four different pigments, the color formulation of these grades in parts per hundred (PPH) is presented in Table 1. The melt flow index (MFI) for Resin 1 was 25 gm/10min, and that of Resin 2 was 6.5 gm/10min.
Table 1: Color formulation used for investigated grade
| S.No | Type | PPH |
| 1 | Resin 1 | 33 |
| 2 | Resin 2 | 67 |
| 3 | Pigment A | 0.20 |
| 4 | Pigment B | 0.05 |
| 5 | Pigment C | 0.0004 |
| 6 | Pigment D | 0.0016 |
| 7 | Pigemnt E | 0.0710 |
3. Design of Experiments
The Design of Experiments (DOE) containing the 27 experimental runs was used to implement a Three-Level Full Factorial Design and a DOE containing 9 experimental runs was used to implement variations of the processing parameters while other parameters are constant (General Trends) are shown in Table 2 and Table 3 respectively .
Table 2: Design level in actual and coded unit
|
Parameters |
Units |
3 Levels | ||
| -1 | 0 | +1 | ||
| Temperature | oC | 230 | 255 | 280 |
| Speed | rpm | 700 | 750 | 800 |
| Feed rate | kg/h | 20 | 25 | 30 |
3.1. 3 Level Full Factorial Design
The processing was carried out on a twin- screw extruder of 25.5 mm diameter, with ratios of L/D=37 and Do/Di=1.55. The materials were extruded in an intermeshing , ZSK26- Coperion -Germany ,27 kW twin co rotating screw extruder (TSE). The three process parameters, the temperature of the heating zones, feed rate to the extruder, and the screw speed were considered in the experimental design, and the levels used are shown in Table 2. Parameters were varied on 27 different treatments with additional five center points, the total of runs are (32 treatments) for 3 level full factorial response method to study their effects on color. The additional five centre points were added to estimate the experimental error and for the detection of nonlinearity in the responses [13].
Extruded melt was quenched in cold water, air dried and then pelletized. Using injection molding, the pellets from each run were molded into three rectangular chips (3x2x0.1”) after which their values (CIE L*, a*, b*) were investigated by utilizing a spectrophotometer (CE 7000A, X rite- Inc. USA). Target color output for these values were L*= 70.04, a*= 3.41, and b*= 18.09. Statistical analysis of data was performed using The Design Expert Software (Version 8, Stat-Ease Inc. USA) to quantify and relate the effects of variables at a confidence interval of 95%. In order to attain zero deviation from target color, numerical optimization of the data was performed.
3.2. Variations of the Processing Parameters (General Trends)
Because color is directly related to the process parameters involved, herein, we performed a control study to investigate the effects of operating variables (temperature, speed, and feed rate) on color. Three processing parameters were controlled individually at three different stages, while fixing all other parameters (GT). Based on our observed strong correlations between the processing variables and the color generated, we conclude the following recommenations: Flow rate was 20 kg/hr, 25 kg/hr, and 30 kg/hr, at a speed of 750 rpm and a temperature of 255 °C [15-17] .
The selected processing temperatures were 230°C, 255°C and 280°C with a speed and flow rate fixed at the middle values (750 rpm and 25 kg/hr, respectively). A similar procedure was followed for both speed and flow rate. The selected speeds were 700, 750 and 800 rpm and the selected flow rates were 20, 25, and 30 kg/hr. The following tables show the experimental processing conditions. The general trends (GT) experimental design is shown in Table 3.
Assuming that the aforementioned variables were utilized, in this work we suggest optimized process parmeters to attain plastic grade color consistency.
Table 3: Processing Parameters Variables
| Speed
RPM |
BZ1
(°C) |
BZ2
(°C) |
BZ3
(°C) |
BZ4
(°C) |
BZ5
(°C) |
BZ6
(°C) |
BZ7
(°C) |
BZ8
(°C) |
BZ9
(°C) |
DZ1
(°C) |
F. R
Kg /hr |
| 750 | 70 | 195 | 230 | 230 | 230 | 230 | 230 | 230 | 230 | 230 | 25 |
| 750 | 70 | 195 | 255 | 255 | 255 | 255 | 255 | 255 | 255 | 255 | 25 |
| 750 | 70 | 195 | 280 | 280 | 280 | 280 | 280 | 280 | 280 | 280 | 25 |
| 700 | 70 | 195 | 255 | 255 | 255 | 255 | 255 | 255 | 255 | 255 | 25 |
| 750 | 70 | 195 | 255 | 255 | 255 | 255 | 255 | 255 | 255 | 255 | 25 |
| 800 | 70 | 195 | 255 | 255 | 255 | 255 | 255 | 255 | 255 | 255 | 25 |
| 750 | 70 | 195 | 255 | 255 | 255 | 255 | 255 | 255 | 255 | 255 | 20 |
| 750 | 70 | 195 | 255 | 255 | 255 | 255 | 255 | 255 | 255 | 255 | 25 |
| 750 | 70 | 195 | 255 | 255 | 255 | 255 | 255 | 255 | 255 | 255 | 30 |
4. Results
Using analysis of variance (ANOVA), correlations between variables were investigated and processing parameters were optimized to generate resulting color properties. The Design Expert software was used to the effects of the operating process parmeters on dL*, da*, db*. We performed sequential F-tests, by utilizing an initial linear model, modified by subsequently adding suitable linear or quadratic terms [20]. The F-statistic was considered for each type of model, and the highest order model with significant terms was chosen. Analysis of all tristimulus values was based on the same process. Based on the F statistics £ 0.05 and probability values £ 0.1, only significant terms were added. Our ANOVA sequential model sum of squares results for dL*, da*, db* are given in Table 4.
The highest order model with significant terms (Prob > F is less than 0.05) are the 2F models, and are applicable to describe the dL*, da* and db* responses. R2 values (Table 4) provide confirmation and suggest that a variability of 78% in dL*, da* and db* is decreased to 74 %. The remainng variability is unexplained and can be ascribed to noise. The “Predicted R-Squared” and the “Adjacent R-Squared” are in rational agreement. A signal to noise ratio larger than 4 is usually desirable since it suggests that the model can be utilized for navigation into the design space, and can be quantified by “Adequate Precision”. The “Lack of the fit” test was utilized to compare between the residual and the pure error, and resembled a p-value > 0.05, which is insignificant.
Table 4: ANOVA results for dL*, da* and db* response
| Response | Significant Terms |
R2 |
Predicted R2 | Adjacent R2 | Adequate
Precision |
|
dL* |
A, B, C , AB, AC, BC |
0.78 |
0.38 |
0.55 |
9.70 |
| da* | B, C, BC | 0.75 | 0.24 | 0.39 | 8.53 |
| db* | B,C | 0.75 | 0.28 | 0.30 | 8.61 |
To generate predicted responses for the dL*, da* db*, several models based on linear regression were produced as given in Table 5. The effects of temperature, speed, and feed rate operating variables and their interactions are represented by the polynomial equations. The effect of these variables on the responses correlate with the coefficient values. The differnce between predicted and actual values is in the 0.2 limit suggesting a strong agreement between these 2 values.
RSM curves were used to investigate interactions and optimize process parameters variables. The contour graph (Figure 1a) illustrates the first order relation between temperature and speed, at the feed rate of 24.71kg/hr for dL*, and resembles that various temperature and speed combinations can satisfy the required objective. Moreover, the contour graph (Figure 1b) illustrates the relation between temperature and the feed rate of 741.2 rpm. Finally, the contour graph (Figure 1c) illustrates the relation between speed and feed rate at temperature of 245.2 oC. The global optimal value (dL* = 0.0) is realized at 245.2 oC, 741.2 rpm and 24.71 kg/hr as demonstrated in the graphs. The maximum and minmum dL* values at 95% confidence interval are both equal to 0.11.
Table 5: Regression Model for dL*, da* and db*
| Response | Regression model |
| dL* | +63.86390 – 0.19647 * Temperature -0.065085 * Speed – 0.99472 * Feed Rate +1.84353E-004 * Temperature * Speed +1.96624E-003 * Temperature * Feed Rate + 6.39611E-004 * Speed * Feed Rate |
| da* | +14.59778 – 0.018496 * Speed – 0.47296 * Feed Rate + 5.98224E-004 * Speed * Feed Rate |
| db* | +4.08697 – 4.78866E -003 * Speed – 0.029746 * Feed Rate |
| A= Temperature, B= Speed, C = Feed rate |
Table 6: dL*, db* and da* Actual and Predicted Values
| Color | dL* | da* | db* | ||||
| Run | Actual | Pred. | Actual Value | Pred. | Actual | Pred. | |
| NOs | Value | Value | Value | Value | value | ||
| 1 | -0.52 | -0.5 | 0.61 | 0.57 | 0.31 | 0.14 | |
| 2 | 0.16 | 0.093 | 0.23 | 0.12 | -0.17 | -0.25 | |
| 3 | -0.59 | -0.57 | -0.3 | -0.087 | -0.76 | -0.34 | |
| 4 | 0.11 | -0.2 | 0.29 | 0.003 | -0.22 | -0.4 | |
| 5 | 0.01 | -0.24 | -0.16 | -0.059 | -0.16 | -0.49 | |
| 7 | -0.65 | -0.36 | -0.29 | 0.12 | -0.77 | -0.25 | |
| 8 | 0.14 | -0.029 | 0.34 | 0.3 | -0.11 | 0.008 | |
| 9 | -0.53 | -0.47 | 0.027 | 0.024 | -0.38 | -0.16 | |
| 10 | 0.087 | -0.18 | 0.14 | 0.03 | -0.18 | -0.4 | |
| 11 | -0.21 | -0.087 | 0.077 | -0.087 | -0.56 | -0.34 | |
| 12 | -0.44 | -0.54 | 0.65 | 0.24 | 0.37 | -0.099 | |
| 13 | 0.25 | 0.41 | 0.27 | 0.24 | -0.14 | -0.099 | |
| 14 | -0.55 | -0.23 | -0.15 | -0.059 | -0.55 | -0.49 | |
| 15 | -0.71 | -0.2 | -0.05 | 0.031 | -0.93 | -0.4 | |
| 16 | -0.53 | -0.4 | -0.12 | -0.031 | -0.84 | -0.64 | |
| 18 | -0.34 | -0.26 | -0.22 | 0.024 | -0.35 | -0.16 | |
| 19 | 0.037 | -0.065 | 0.29 | 0.24 | -0.22 | -0.099 | |
| 20 | -0.48 | -0.49 | 0.65 | 0.3 | 0.37 | 0.008 | |
| 21 | -0.2 | -0.33 | -0.017 | -0.087 | -0.33 | -0.34 | |
| 22 | 0.43 | 0.43 | 0.32 | 0.3 | 0.013 | 0.008 | |
| 23 | 0.027 | -0.13 | 0.24 | 0.12 | -0.24 | -0.25 | |
| 24 | 0.087 | 0.2 | 0.24 | 0.57 | -0.16 | 0.14 | |
| 27 | -0.04 | -0.13 | 0.05 | 0.12 | -0.31 | -0.25 | |
| 28 | -0.15 | -0.13 | 0.12 | 0.12 | -0.013 | -0.25 | |
| 29 | -0.19 | -0.13 | 0.093 | 0.12 | -0.083 | -0.25 | |
| 30 | -0.02 | -0.13 | -0.087 | 0.12 | -0.02 | -0.25 | |
| 31 | -0.1 | -0.13 | -0.09 | 0.12 | -0.06 | -0.25 | |
| 32 | -0.033 | -0.15 | 0.13 | -0.031 | -0.32 | -0.64 | |
Figure 2 shows the interaction between speed and feed rate for da* at 245.2 oC, resembling the first order relationship and suggest that several feed rate and speed combinations can satisfy the objective. The optimum value of da* = 0.15 is realized at 741.2 rpm and 24.7 kg/hr. The maximum and minimum allowable values at 95% confidence interval for da* are 0.23 and 0.07 respectively.
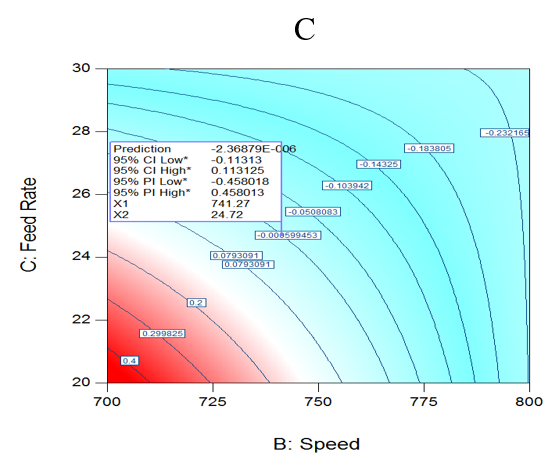
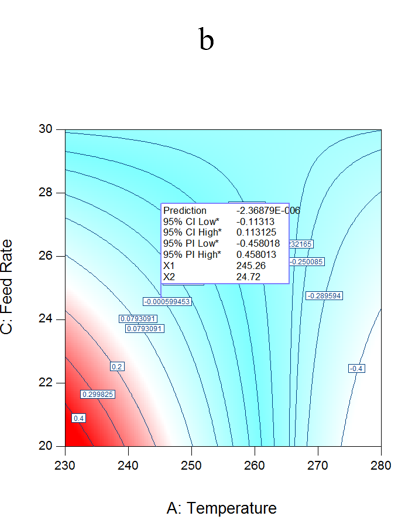
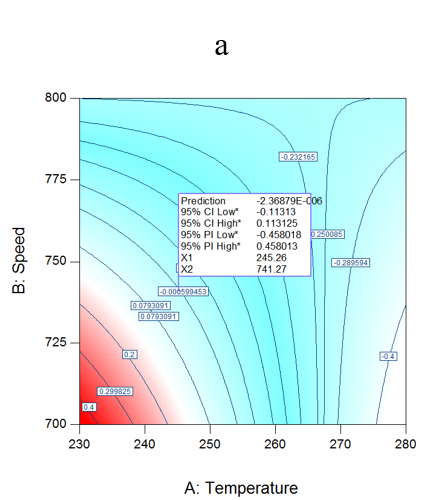 Figure 1: (a) Interaction between temp and speed at 24.7 kg/hr for dL* (b) Temp and feed rate at 741.2 rpm for dL* (c) Speed and feed rate at 245.2 oC for dL*.
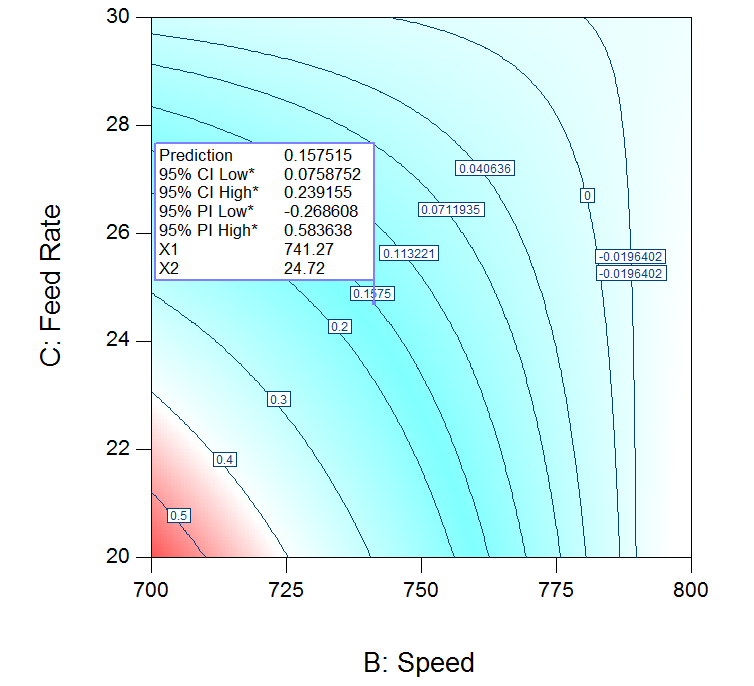 Figure. 2: Speed and feed rate interaction at temperature of 245.2. oC for da *
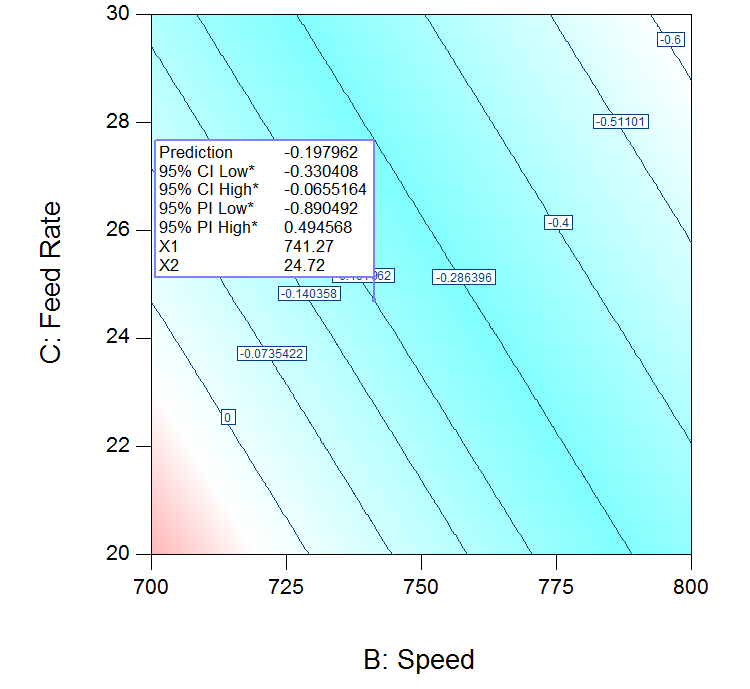 Figure 3: Speed and feed rate contour plot for d b* at 245.2 oC
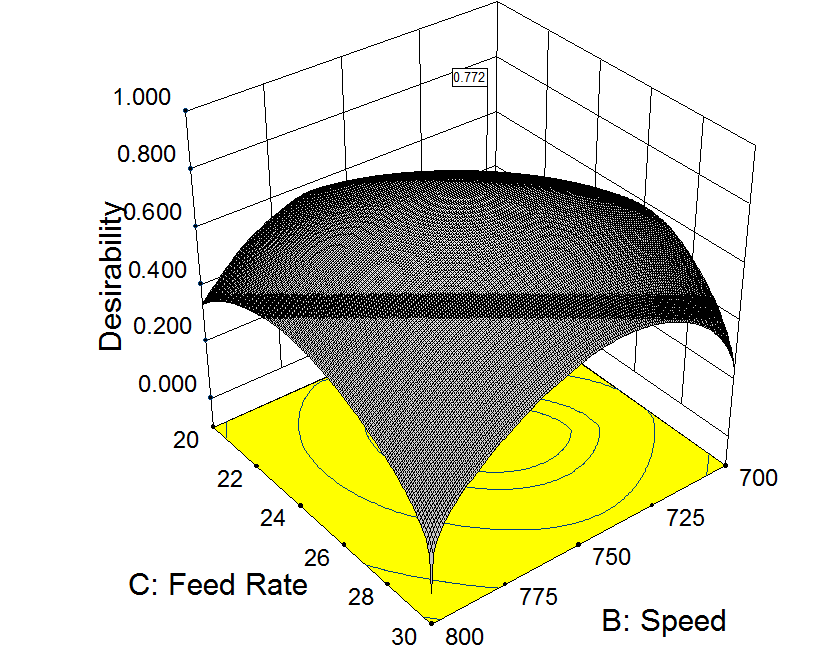 Figure 4: Desirability Graph at temperature of 245.2 oC
(A= Temp; B= Speed, C= Feed rate)
The interaction between speed and feed rate for db* at 245.2 oC is shown in Figure 3. The linear behavior includes only speed and feed rate as significant model terms as compared to dL* and da*. Interestingly, at lower values of speed and feed rate around 20 kg/hr and as well as at higher values of speed and feed rate around 24 kg/hr, db* approaches zero, while temperature stays at 245.2 oC. At the global optimum, the predicted value of db* is equal to -0.19 and the allowable maximum and minimum values at 95% confidence interval are -0.05 and -0.33 respectively.
An important effect on the color responses was exerted by temperature (A), speed (B) and feed rate (C). The optimal settings of the three parameters regarding all responses were realised by utilizing a decision making method based on multiple criteria, and a total desirability function “d” [19]. A desirability function is quantifies the quality and presents a convenient responses comparison method to select the optimal settings; Figure 4 shows a 3D plot of the global desirability D, maintaining a feed rate of 24.7 kg/hr, and indicates that the maximum combined desirability of 77% is attained at 245.2oC, 741.2 rpm, and 24.7 kg/hr.
5. Effect of variation feed rate on color values
A plot of feed rate variation from 20 kg/hr to 30 kg/hr with a fixed speed at 750 kg/hr and a fixed temperature at 255 °C is shown in Figure 5; The difference in color decreases initially as the feed rate increases up to 30 kg/hr.[20-22]
A response contours plot of speed versus feed rate at a temperature of 245.2 oC is shown in Figure 6, and resembles the presence of region that is feasible to achieve target values. The plot shows a region between the da*=0.30 and db*=0.20 contours which illustrates the temperature and speed operation conditions at which the mean responses (dL*, da*, db* and SME) target are met at a fixed feed rate of 24.44 kg/hr.
The results suggest that the optimal tristimulus values of dL* = 0.0, da * = 0.15, db* = – 0.19 are attained at 245.2 oC, 741.2 rpm, and 22.7 kg/hr. The total minimum deviation in tristimulus values (using equation 1) is equal to 0.25, which is reasonably acceptable as compared with the maximum allowable deviation (dE* = 0.8).
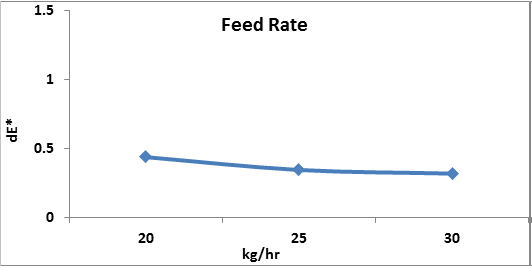 Figure 5: Effect of the variation of feed rate at fixed a fixed temperature of 255 °C, and a fixed speed of 750 rpm.
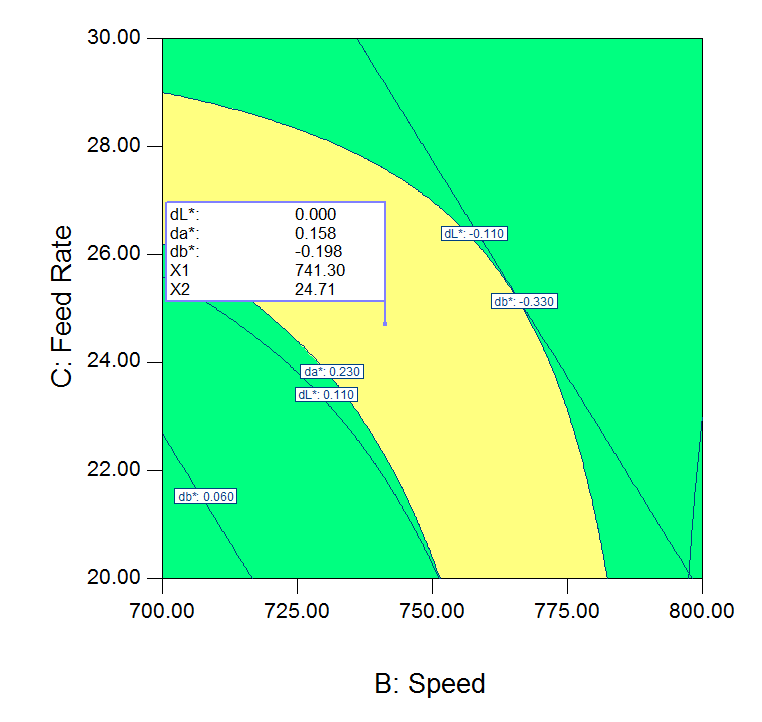 Figure. 6: Speed and feed rate overlay plot at a temperature of 245.2 oC.
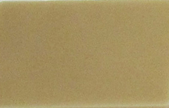 Figure 7 : Rectangular color chip (3x2x0.1”)
Using the lab injection molding, the extruded pellets were molded into a rectangular chip (3x2x0.1”) after which the color values (CIE L*, a*, b*) were examined by using a spectrophotometer (CE 7000A, X rite- Inc. USA). The image of the specimen is shown in Figure 7.
Figure 8: Scanning Electron Microscopy images at feed rates of (a) 20 kg/hr, (b) 25 kg/hr, and (c) 30 kg/hr, at a fixed temperature of 255 °C, and a fixed speed of 750 rpm.
Scanning Electron Microscopy (SEM) images were probed using a Joel 5500 LV at a 20 kV voltage, at different feed rates, and are shown in Figure 8. The images illustrate that primary particles and agglomerates were present in the compounded grades. The images show that larger agglomerated pigments could be observed at a lower feed rate as compared with higher feed rates [20-22].
Conclusions
An experimental design approach which relied on three levels full-factorial surface method was utilized to study the effects of operational process variables, and suggested appropriate predictive models for dL*, da*, and db*. We used a regression model to calculate tristimulus values and validated our work by confiming that a good agreement exists with experimental results. At target values of 245.2 oC, 741.2 rpm, and 24.7 kg/hr, tristimulus values were close, with a minimum total deviation (dE*) of 0.25 at a 95% confidence interval. An experimental design approach, which relied on the interaction between tristimulus color values and processing parameters showed that the minimum color difference throughout the experiment was equal to 0.34 for dE*. As the feed rates increased from 20 kg/hr to 30 kg/hr, the color difference values (dE*) substantially decreased. Finally, an optimum set of processing parameters for the grades of the polycarbonate can be yielded through the utilization of the optimized parameters, and hence reduce colors mismatch so that wastages can be reduced.
- S. P. Rwei, Distributive Mixing in a Single-Screw Extruder – Evaluation in the Flow Direction, Polymer Engineering and Science, (2001).
- A.Y. Wong, Screw Configuration Effects on The Color Mixing Characteristics Of Polymer In Single-Screw Extrusion, The University of Hong Kong, China Tinhua Liu, Sichuan Union University, China (1998).
- D. I. Meade, “Introduction to colorant selection and Application Technology,” in Coloring of Plastics, Fundamentals, 2nd ed., edited by Robert Charvat (2004).
- ASTM D 2244-93. Standard Test Method for Calculation of Color Differences from Instirnentally Measured Color Coordinates. 222-215
- Richard Abrams, Plastic additives, and compounding (2001)
- Rauwendaal, C., Polymer Mixing, A Self-Study Guide. Hanser Publishers, Munich., 1998.
- Rwei, S.P., Distributive Mixing in a Single-Screw Extruder – Evaluation in the Flow Direction. Polymer Engineering and Science, 2001
- Mulholland, B.M., Effect of Additives on the Color & Appearance of Plastics. SPE ANTEC. Ticona, Ticona Engineering Polymers ,2007.
- Effertz, K., Understanding the Effects of a Compounding Process on the Production of Co-Extruded Vinyl Sheet through the Utilization of Design of Experiments (part II). ANTEC-Conference Proceedings: p. 3574-3578 ,2004
- http://itl.nist.gov/div898/handbook. [Online] available accessed in 2013.
- Bender, T.M., Characterization of Apparent Viscosity with respect to a PVC-Wood Fiber Extrusion Process. ANTEC-Conference Proceedings, 2002.
- Borror, C.N., Montgomery, D. C. and Myers, R. H., Evaluation of Statistical Designs for Experiments Involving Noise Variables. Journal of Quality Technology. Vol 34(1): p. 54-70 , 2002.
- Anderson, M.J., and Whitcomb, P. J., RSM Simplified: Optimizing Processes using Response Surface Methods for Design of Experiments. New York, NY: CRC Press. , 2005.
- Montgomery, Douglas C., Design and Analysis of Experiments, 6th Ed., John Wiley and Sons, New York,2005.
- J. AlSadi1, S. Ahmad1, U. Saeed1, G. Rizvi1, D. Ross2, R. Clarke2, J. Price2. (2012) Execution of 3 level full factorial design to evaluate the process parameters: polymer color properties, Annual Technical conference of the Society of Plastics Engineers (ANTEC), Orlando, Florida, USA, pp. 1-5, 2012.
- Saeed.U. AlSadi, .J, Ahmed. S, Rizvi. G., Ross. D, 2013, “Neural Network: a potential approach for error reduction in color values of polycarbonate” Journal Advance polymer technology. 33 (2), Summer 2013, DOI 10.1002/Adv. 21402
- J. AlSadi, M. Rabbani, S. Ahmed, G. Rizvi, R. Clarke and D. Ross, (2011 ) Effect of Processing Parameters on Colour During Compounding, Annual Technical Conference of the Society of Plastics Engineers (ANTEC), Boston, USA, pp. 1-4, 2011
- Y. K. Chang, M. K. Bustos, H.Lara, Braz. J. Chem. Eng. vol. 15 n. 4 São Paulo Dec. 1998
- M. A. Islam, V. Sakkas, T. A. Albani, J. Hazardous Materials, (170) 2009.
- J. Alsadi, U. Saeed, S. Ahmad, G. Rizvi and D. Ross , Processing issues of color mismatch: Rheological characterization of polycarbonate blends, Polymer Engineering & Science, Volume 55, Issue 9, September 2015, Pages: 1994–2001, Version of Record online : 8 DEC 2014, DOI: 10.1002/pen.24041
- AlSadi, J., Ahmad, S. , Saeed, U. , Rizvi, G. , Ross, D. , Clarke, R. and Price, J., Effects of Processing Parameters on Color Mismatch During Compounding. Annual Technical conference of the Society of Plastics Engineers (ANTEC), Orlando, Florida, USA ,pp 1-5 , 2012.
- J, Alsadi . Colour Mismatch In Compounding Of Plastics: Processing Issues and Rheological Effects (Doctor of Philosophy in Mechanical Engineering), The Faculty of Engineering and Applied Science University of Ontario Institute of Technology-UOIT). Ontario, Canada(2015).