The Visualization of Cattle Movement Data in The State of Pará in 2016 Through Networks of Animal Transit Graphs and Guides
 , Agnaldo Reis Pontes 1, Luis Manuel Borges Gouveia 2, Samuel Franco Lopes 3, Pier Kenji Rauschkolb Katsuda 4, Anirene Galvão Tavares Pereira 4, Márcio Teixeira Oliveira 5, Jefferson Pinto de Oliveira 6, Rita do Socorro Brito Coroa 6, Gilson Ferreira Araújo 6, Marcio Merêncio Panza de Siqueira 6
Adv. Sci. Technol. Eng. Syst. J. 3(5), 92–96 (2018);
 DOI: 10.25046/aj030512
Animal movement is inherent in the marketing between the rural productive units, establishing space-time connections between them. The relational nature of such information is kept in the Animal Transit Guides (GTA), a mandatory issuance in Brazil. When evaluating such set of information, this work aimed at characterizing the bovine movement network in the state of Pará through the application of concepts from Social Network and Network Theory analysis. Where the nodes and edges that structure the network are respectively the rural properties and the number of cattle moved between them. The results obtained characterize the bovine movement in the state, which show distinct patterns such as the movement of a great number of animals rambling and a clear seasonality due to commercialization purposes. The evaluation of the network components’ modularity also shows the subdivision of the state in four commercial clusters, where the central measures of its components define municipalities of economic and epidemiological interest. The results described herein help in the support of health surveillance and control measures, as well as the adoption of economic strategies and policies.
1. Introduction
Social Network Analysis (SNA) and the Theory of Networks are methodological concepts that describe the interactions between individuals in a group, as well as the collective behavior of a group [1]. Although widely adopted in the social sciences, psychology, and anthropology, SNA and the Theory of Networks have only recently been added to the analytical arsenal used to evaluate the nature and extent of relationships in the rural productive chain [2]. These methodologies allow researchers to evaluate the structure of the flow of animals between different productive units, and the impact that this has on the spread of a wide range of infectious agents [3–6]. SNA and the Theory of Networks also allow the extraction of characteristics of particular economic interest to the livestock industry, such as commercial patterns and commercial agglomerations [7–9].
The study of networks initially describes how the entities that teh networks are composed of are connected to each other, where the unit of interest is called the node and the connections between these are called edges [10]. Unlike in the human sciences, where the unit is the individual, in veterinary medicine the focus is on the collective unit. Municipalities and rural properties are represented by nodes and the number of animals moved between these are represented by the edges [11-12]. From an economic point of view, animal movement between productive units represents an important aspect of livestock commercialization, as it establishes extensive spatial connections between different units [9]. This movement also favors the occurrence and spread of diseases, as movement of animals is of central importance to the dynamics of diseases and occurrence of outbreaks [13,14]. In most industrialized countries, measures are adopted to identify, record, and trace animal movements as a prerequisite for the effective adoption of disease surveillance and control measures [15].
In Brazil, the Animal Transit Guide (GTA), instituted by Ordinance 22 on January 13th, 1995 [16] and updated in 2012 by Normative Instruction No. 18, dated July 18th, 2006 [17], is the official document mandatory for the intra and interstate movement of animals, regardless of the purpose of the movement. It is an important tool for sanitary control, and provides support for the prevention of diseases that affect domestic species of production [18]. Given the relational nature of the information contained in the transit guides, these are readily converted into the attributes that make up a network, where nodes represent the properties of origin and destination, and their edges represent the animal movement that occurs between them [19].
In the state of Pará, the issuance, control, and analysis of the GTAs, as well as adoption of the necessary measures to maintain the health of the livestock are the responsibility of the Agency of Agricultural Defense of the State of Pará (ADEPARÁ). ADEPARÁ is the government body responsible for animal health in the state of Pará. The agency monitors the fifth largest national cattle herd in Brazil, which comprises more than 19 million heads [20]. This monitoring is done according to norms established by the Ministry of Agriculture, Livestock and Supply (MAPA) [21].
The State of Pará, which contains approximately 9% of cattle in Brazil, and experienced a 43% increase in the number of cattle between 2004 and 2013, performed better than the states that include the largest national herds, such as Mato Grosso, Minas Gerais, Goiás and Mato Grosso do Sul [22]. Given the importance of cattle breeding not only at the state level, but at the national level, it is of prime importance to characterize animal movements among the structural components of the production chain. Such information will enable the implementation of effective measures for sanitary, market, and managerial control [23]. Based on the information described above, this work describes the main characteristics of cattle movement in the state of Pará. We applied network analysis techniques to the relational, temporal, and spatial components of the dataset formed by the GTAs issued during the year 2016 in the state of Pará.
2. Materials and Methods
2.1. Study area
The state of Pará is located in the Northern Region of Brazil, and covers an area of more than 1,247,000 km2. The state of Pará has estimated population of over 8 million inhabitants, and in 2016 included more than 110,000 rural properties [24].
2.2. Animal Transit Guides
The information used to compose the cattle handling network was made available by ADEPARÁ, and includes the compilation of all GTAs issued during the year 2016 in the state of Pará. Each GTA issued has a unique identifier associated with the date, party, and issuing regional unit. Information relevant to the characterization of the movement carried out includes the type of transport, the species transported, the purpose of the transport, the number of animals transported according to sex and age group (only for cattle and buffalo), municipalities and federal units of origin and destination, as well as information identifying the properties or establishments from where and to which the animals were moved. The information comprised by the CPF/CNPJ (Physical Person Registration/National Registration 0f Legal Entities), name of the owner, and name of the property or establishment of origin or destination, is assigned a unique identifier established by ADEPARÁ. Spatial information, i.e. the latitude and longitude of the municipalities of origin and destination were added to the dataset.
2.3. Cattle Handling Network
The network structure is derived from the relational information contained in each GTA issued, where the nodes represent the productive units, and the edges represent the cattle movement between them. The identification of each node corresponds to that adopted by ADEPARÁ and its attributes include the name, federative unit, and geographical position of the municipality to which it belongs. The same strategy was adopted to identify the edges, keeping the unique identifier designated by ADEPARÁ to each GTA issued. The attributes include the date of issue, the temporal component of the network, the purpose and type of transport, the number of cattle transported according to age and sex, and the identification of the origin and destination nodes. The movement described by each edge carries implicit direction information, starting at the origin and ending at the destination. Therefore, node A connected to node B, represented by A-B, is different from the connection B-A, where the distance between them is defined as the lowest number of directed edges necessary to connect them.
The network properties and characteristics were evaluated, including their diameter, modularity, heavy grades of input and output, centrality of intermediation, proximity centrality, PageRank, and clustering coefficient. The network diameter is defined as the path with the greatest number of edges between two nodes A and B of the network [25]. Modularity is a measure of the quality of the clustering of a given set of nodes [26]. The number of edges arriving at a given node and the number of edges that start from this are respectively the degrees of entry and exit [25]. The weight or multiplier of these degrees was defined as the number of animals moved between two nodes [27].
The number of shortest paths among all nodes of the network passing through node A is defined as intermediation centrality of node A [28]. The inverse of the sum of all distances from node A to all other nodes of the network defines the centrality of its proximity [29]. The PageRank of node A corresponds to the probability of arriving at this node starting from a random network node B [30]. The clustering coefficient indicates the degree to which the network nodes tend to cluster [31].
The descriptive analysis, as well as conversion of the information made available by ADEPARÁ, in the set of nodes and edges that make up the network were performed using development codes in R statitistical software [32], with RStudio 2.11.1+ [33]. The analysis and extraction of the network characteristics described above were performed using the R package ‘iGraph’ [34] and the open access software Gephi 0.9.1 [35].
| Table 1: Number and percentage of cattle and GTAs issued, according to the purpose of cattle movement | ||||
| PURPOSES
|
Cattle (n)
|
Cattle (%) | GTA (n)
|
GTA (%) |
| SLAUGHTER | 3515074 | 31.63 | 210438 | 48.54 |
| FATTEN | 6803942 | 61.23 | 193063 | 44.53 |
| SPORTS | 3267 | 0.03 | 139 | 0.03 |
| EXPORT | 174604 | 1.57 | 7733 | 1.78 |
| EXHIBITION | 2103 | 0.02 | 190 | 0.04 |
| AUCTION | 131214 | 1.18 | 5115 | 1.18 |
| RESEARCH | 1 | ~0 | 1 | ~0 |
| Quarantine | 243677 | 2.19 | 8105 | 1.87 |
| Reproduction | 182671 | 1.64 | 5819 | 1.34 |
| Return of Agglomeration | 55234 | 0.5 | 2939 | 0.68 |
3. Results and Discussion
With 135 regional management units and 1,841 users registered in the system, the State Agency of Agricultural and Livestock Defense of the State of Pará issued 433,545 GTAs for cattle between January 1st and December 31st, 2016. The animals transported had origins or destinations in one of the 82.010 registered properties, which were distributed in 929 municipalities of 24 federative units. In Pará, there are 78.362 properties distributed in 142 municipalities, with more than 32% of the state’s properties concentrated in only 10 municipalities.
Over 90% of GTAs involved road transport as a means for the movement of cattle (Table 1). This number corresponds to the distribution of the number of animals transported by GTAs, with a median of 25 cattle, which corresponds to the maximum vehicle load capacity. Road transport is an important factor in determining strategies for epidemiological control, given the possibility of rapid spread of diseases by movements over large territories [9]. In spite of the number of animals transported by road, a significant number of cattle (over 3 million) were moved on foot (Table 2), with an approximate average of 126 animals per GTA issued. In this type of movement, the animals are moved in large numbers over short distances, remaining in a region close to the origin, a factor that contributes to the local spread of diseases [36].
Table 2: Number and percentage of cattle and GTAs according to the type of transport
| Type of Transportation | Cattle (n) | Cattle (%) | GTA (n) | GTA (%) |
| ON FOOT | 3299532 | 29.69 | 26138 | 6.03 |
| RAILWAY | 1059 | 0.01 | 32 | 0.01 |
| MARITIME / FLUVIAL | 329155 | 2.96 | 13648 | 3.15 |
| ROAD | 7482269 | 67.33 | 393727 | 90.82 |
In Pará, beef cattle farming is very important, as shown in Table 1, and 31% of cattle moved in the state are destined for slaughter, and 61% of cattle are moved for fattening. The low index of animals moved for breeding (1.64%) is related to two marketing moments, after rearing and after fattening. The number of cattle moved for quarantine purposes (2.19%) is related to the export of live cattle, with 1.57% of the cattle moved for export purposes (Table 1). This information is also supported by the temporal evaluation of the GTAs issued (Figure 1 and Figure 2), which indicates an increase in the number of cattle destined for quarantine during the months of May and June, which precedes the increase of GTAs issued for export during the months of June and July, which is end of the rainy season, and the period that cattle gain the most weight.
Figure 1 shows a clear seasonality of cattle breeding in Pará, with an increase in the number of cattle destined for fattening during the months of April and October, and a progressive increase in the number of cattle slaughtered between May and August. Cattle moved for fattening in October are slaughtered in early May, and those moved for fattening in April are slaughtered at the end of the rainy season in mid-August. Cattle moved for exhibitions and sports are concentrated in the months of July and August (Fig. 1 and Fig. 2), which are critical time points for the monitoring of these cattle in order to prevent the spread of diseases [2].
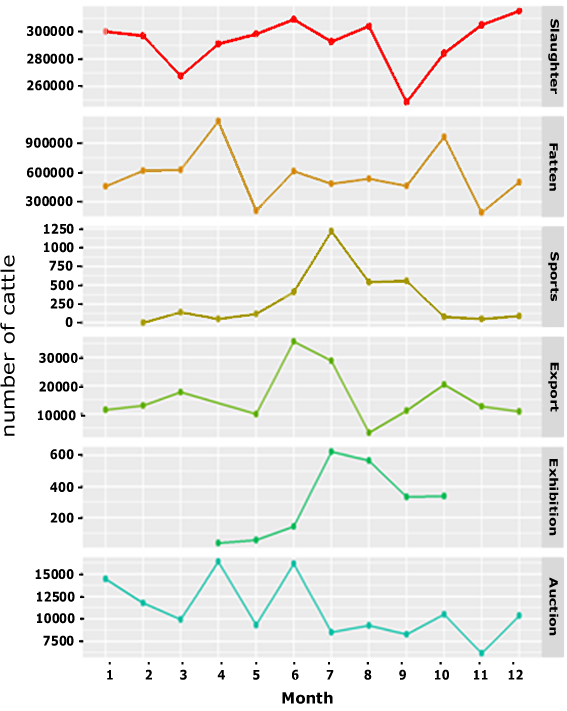 Figure 1 – Number of cattle moved during the year 2016 according to the purpose of the GTA.
Table 3:Number and percentage of cattle moved according to age and sex.
| Age (months) and Sex | Bov (n) | Bov (%) |
| 0 – 12 (males) | 1496779 | 13.47 |
| 0 – 12 (females) | 378254 | 3.40 |
| 13 – 24 (males) | 1510723 | 13.60 |
| 13 – 24 (females) | 705692 | 6.35 |
| 25 – 36 (males) | 1428094 | 12.85 |
| 25 – 36 (females) | 801877 | 7.22 |
| > 36 (males) | 1812238 | 16.31 |
| > 36 (females) | 2978358 | 26.80 |
| Total (males) | 6247834 | 56.23 |
| Total (females) | 4864181 | 43.77 |
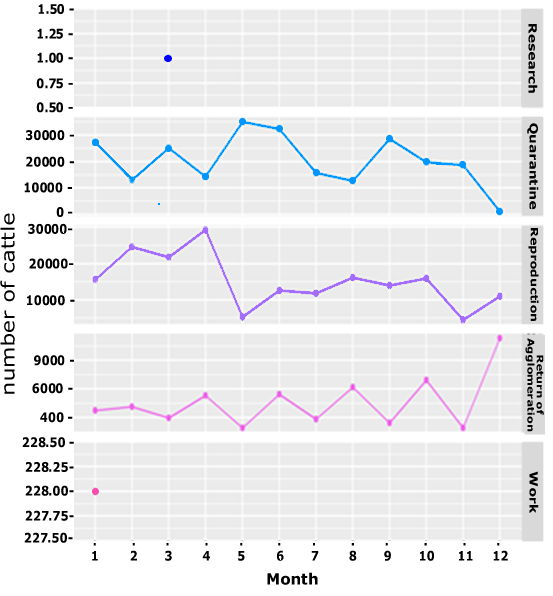 Figure 2 – Number of cattle moved during the year 2016 according to the purpose of the GTA.
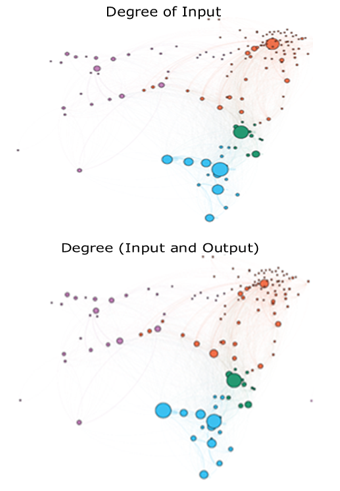 Figure 3 – Properties of the cattle movement network in the state of Pará according to the modularity class to which the municipality belongs.
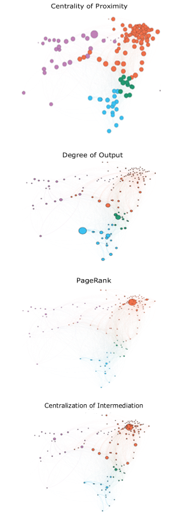 Figure 4 – Properties of the cattle movement network in the state of Pará according to the modularity class to which the municipality belongs
The commercialization of male cattle in Pará is independent of age. The high number of females of reproductive age transported for slaughter (Table 3) and export purposes (Table 1), has a direct impact on the number of cattle in the state, reducing the population growth rate, and keeping the number of cattle stable. In disease surveillance programs, categories of epidemiological importance are those composed of animals susceptible to disease [37]. Therefore, determining the sample group of interest reduces the number of samples necessary for statistical confirmation of the establishment of disease in the population, as well as its spread, reducing the time required for detection and response by the responsible health agency [23].
The diameter of the net of cattle movement obtained is equal to 5, which, in other words, indirectly represents the number of municipalities through which an animal must pass to cover the largest geodesic distance of the net. Using the latitude and longitude information of each municipality, the average distance between the municipalities is approximately 220 km, with a magnitude of approximately 8.736 km, which is the sum of all distances. These results highlight the vast territory of the state.
4. Conclusion
Although the analyses and metrics evaluated were used in the state of Pará, they can be applied and expanded to other states, as well as to other production species. The quantitative description of the cattle movement network proposed in this study allowed us to reveal factors that shape the commercialization and displacement patterns of cattle in Pará. This data can contribute to the development of effective strategies to control and monitor the diseases that occur in cattle.
- B. Martínez-López, A. M. Perez, and J. M. Sánchez-Vizcaíno, “Social Network Analysis. Review of General Concepts and Use in Preventive Veterinary Medicine,” Transbound. Emerg. Dis., vol. 56, no. 4, pp. 109–120, May 2009.
- J. L. Hardstaff, B. Häsler, and J. R. Rushton, “Livestock trade networks for guiding animal health surveillance,” BMC Vet. Res., vol. 11, no. 1, p. 82, 2015.
- F. Natale, L. Savini, A. Giovannini, P. Calistri, L. Candeloro, and G. Fiore, “Evaluation of risk and vulnerability using a Disease Flow Centrality measure in dynamic cattle trade networks,” Prev. Vet. Med., vol. 98, no. 2, pp. 111–118, 2011.
- I. Z. Kiss, D. M. Green, and R. R. Kao, “The network of sheep movements within Great Britain: network properties and their implications for infectious disease spread,” J. R. Soc. Interface, vol. 3, no. 10, pp. 669–677, 2006.
- H. H. K. Lentz et al., “Disease Spread through Animal Movements: A Static and Temporal Network Analysis of Pig Trade in Germany,” PLoS One, vol. 11, no. 5, pp. 1–32, 2016.
- B. Shirouchi et al., “Fatty acid profiles and adipogenic gene expression of various fat depots in Japanese Black and Holstein steers,” Meat Sci., vol. 96, no. 1, pp. 157–164, 2014.
- E. E. Gorsich et al., “Mapping U.S. cattle shipment networks: Spatial and temporal patterns of trade communities from 2009 to 2011,” Prev. Vet. Med., vol. 134, no. Supplement C, pp. 82–91, 2016.
- M. C. Vernon and M. J. Keeling, “Representing the UK{\textquoteright}s cattle herd as static and dynamic networks,” Proc. R. Soc. London B Biol. Sci., vol. 276, no. 1656, pp. 469–476, 2009.
- P. Bajardi, A. Barrat, F. Natale, L. Savini, and V. Colizza, “Dynamical Patterns of Cattle Trade Movements,” PLoS One, vol. 6, no. 5, pp. 1–19, 2011.
- C. Dubé, C. Ribble, D. Kelton, and B. McNab, “A Review of Network Analysis Terminology and its Application to Foot-and-Mouth Disease Modelling and Policy Development,” Transbound. Emerg. Dis., vol. 56, no. 3, pp. 73–85, Apr. 2009.
- S. Schärrer et al., “Evaluation of farm-level parameters derived from animal movements for use in risk-based surveillance programmes of cattle in Switzerland,” BMC Vet. Res., vol. 11, no. 1, p. 149, Jul. 2015.
- F. Kschischang, “An Introduction to Network Coding,” 2012.
- S. E. Robinson, M. G. Everett, and R. M. Christley, “Recent network evolution increases the potential for large epidemics in the British cattle population,” Journal of the Royal Society Interface, vol. 4, no. 15. London, pp. 669–674, Aug-2007.
- A. Ortiz-Pelaez, D. U. Pfeiffer, R. J. Soares-Magalhães, and F. J. Guitian, “Use of social network analysis to characterize the pattern of animal movements in the initial phases of the 2001 foot and mouth disease (FMD) epidemic in the UK,” Prev. Vet. Med., vol. 76, no. 1, pp. 40–55, 2006.
- P. Motta et al., “Implications of the cattle trade network in Cameroon for regional disease prevention and control,” Sci. Rep., vol. 7, p. 43932, Mar. 2017.
- Brasil, “Portaria no 22, de 13 de janeiro de 1995,” 1995.
- Brasil, “Decreto n° 5.741, de 03 de março de 2006,” 2006.
- OIE OM de SA, “Código sanitário para os animais terrestres,” 2015.
- M. Amaku et al., “Infectious disease surveillance in animal movement networks: An approach based on the friendship paradox,” Prev. Vet. Med., vol. 121, no. 3, pp. 306–313, 2015.
- ADEPARA, “Agência Estadual de Defesa Agropecuária do Estado do Pará,” 2015.
- IBGE, “Instituto Brasileiro de Geografia e Estatística.”
- FAPESPA, “BOLETIM AGROPECUÁRIO DO ESTADO DO PARÁ,” 2015.
- K. L. VanderWaal et al., “Network analysis of cattle movements in Uruguay: Quantifying heterogeneity for risk-based disease surveillance and control,” Prev. Vet. Med., vol. 123, no. Supplement C, pp. 12–22, 2016.
- IBGE, “Sistema IBGE de Recuperacao automatica–SIDRA.” 2015.
- T. Opsahl, F. Agneessens, and J. Skvoretz, “Node centrality in weighted networks: Generalizing degree and shortest paths,” Soc. Networks, vol. 32, no. 3, pp. 245–251, 2010.
- M. E. J. Newman, “Modularity and community structure in networks,” Proc. Natl. Acad. Sci., vol. 103, no. 23, pp. 8577–8582, 2006.
- R. R. Kao, L. Danon, D. M. Green, and I. Z. Kiss, “Demographic structure and pathogen dynamics on the network of livestock movements in Great Britain,” Proc. R. Soc. London B Biol. Sci., vol. 273, no. 1597, pp. 1999–2007, 2006.
- L. C. Freeman, “A Set of Measures of Centrality Based on Betweenness,” Sociometry, vol. 40, no. 1, pp. 35–41, 1977.
- G. Sabidussi, “The centrality index of a graph,” Psychometrika, vol. 31, no. 4, pp. 581–603, 1966.
- M. Rosvall and C. T. Bergstrom, “Maps of random walks on complex networks reveal community structure,” Proc. Natl. Acad. Sci., vol. 105, no. 4, pp. 1118–1123, 2008.
- D. J. Watts and S. H. Strogatz, “Collective dynamics of ‘small-world’ networks,” Nature, vol. 393, p. 440, Jun. 1998.
- R. Ihaka and R. Gentleman, “R: A Language for Data Analysis and Graphics,” J. Comput. Graph. Stat., vol. 5, no. 3, pp. 299–314, 1996.
- J. S. Racine, “RStudio: A Platform-Independent IDE for R and Sweave,” J. Appl. Econom., vol. 27, no. 1, pp. 167–172, 2012.
- G. Csardi and T. Nepusz, “The igraph software package for complex network research,” 2006.
- M. Bastian, S. Heymann, and M. Jacomy, “Gephic: An Open Source Software for Exploring and Manipulating Networks Visualization and Exploration of Large Graphs,” 2017.
- C. Ensoy, C. Faes, S. Welby, Y. Van der Stede, and M. Aerts, “Exploring cattle movements in Belgium,” Prev. Vet. Med., vol. 116, no. 1, pp. 89–101, 2014.
- L. J. Hoinville et al., “Proposed terms and concepts for describing and evaluating animal-health surveillance systems,” Prev. Vet. Med., vol. 112, no. 1, pp. 1–12, 2013.
No related articles were found.