
Harmonic Sensitivity Analysis of Power System with Wind Power
Volume 3, Issue 5, Page No 06-15, 2018
Author’s Name: Jignesh Patela), Satish Joshi
View Affiliations
Department of Electrical Engineering, The Maharaja Sayajirao University of Baroda, Vadodara – 390002, India
a)Author to whom correspondence should be addressed. E-mail: jignesh.pravinbhai@gmail.com
Adv. Sci. Technol. Eng. Syst. J. 3(5), 06-15 (2018); ![]() DOI: 10.25046/aj030502
DOI: 10.25046/aj030502
Keywords: Harmonic Resonance, Modal Analysis, Eigenvalue, Modal Sensitivity, Eigenvector

Export Citations
As the contribution from renewable energy sources increase, the power quality degradation has become a challenge for the power system operator. There are major two factors causing power quality deterioration. First is the current harmonic generation by the power electronic converters used in renewable energy sources, and second is the magnification of harmonic voltage due to harmonic resonance condition educed by power factor correction capacitors. The motivation behind this work is power quality related problems, observed recently in the field. To analyze the problem a comprehensive approach is adopted. A practical wind farm configuration is considered for study. Using an eigenvalue analysis method, critical resonance modes are determined for different value of capacitor connected to different buses. To check the effect of change in network parameter on eigenvalue, the sensitivity analysis is carried out and how resonant point is varied with the capacitor value and connection point is discussed by simulating different cases. The results are useful in determining the filter value and location for maximizing its effectiveness in curbing the harmonic problems.
Received: 29 June 2018, Accepted: 25 August 2018, Published Online: 08 September 2018
1. Introduction
In the recent years, several problems of Wind Generator tripping due to over-voltage is observed. When the problems were investigated, it is found that the harmonic current, generated by the wind generator converter, produces high voltage due to harmonic resonance. Also, several incidences have been reported of converter tripping due to over-voltage caused by the harmonics. This is the prime reason of carrying out this work to know the exact problem and finally find the applicable solution. In the event of harmonic resonance, the harmonic impedance becomes very high four harmonics of frequencies near to resonance point and theoretically become infinite at the resonance frequency. Under the resonance condition, even a small amount of harmonic current is enough to produce high harmonic voltage drop, which is ultimately resulting in overall voltage distortion.
There are various methods to analyze the harmonic problem. Generally, the frequency scan method used to locate the harmonic resonance point. Though, it is simple and easy to use, but it does not give information about the participation of different network components and also how the resonant point is affected by changes in the value of the components.
To analyze the problem, several techniques were investigated. Finally, based on the ease of use and potential of in-depth analysis, the modal analysis is adopted for analyzing the problem in this work.
In conventional power generation, harmonics is virtually not generated by the generators. Also, the resonance condition does not prevail on the generator bus because of absence of shunt capacitors. But, both of these are present in the Wind Farm. It may impact significantly, if the resonance point coincides with the one of the frequencies of generating harmonic currents.
Harmonic Resonance can become complicated, because of complex network configuration and presence of multiple harmonic sources in the network. A power system network contains many inductive, capacitive and resistive elements. An interaction among inductive and capacitive elements leads to oscillations. The period of oscillation depends on the resistive component. Phenomena. Though, the resistive elements cause the loss of power, but they also act as a damping element, which reduces the harmonic magnitude exponentially and supports the harmonic stability. The exchange of energy between capacitive and inductive elements appears as an oscillations, the frequency of oscillation depends on the value of participating capacitor and inductor value. Such The The network is characterized by the critical frequency known as resonance frequency. If such a network is excited by the source having resonance frequency, will lead to a sustained oscillation.
Traditionally, the frequency scan analysis is a primary tool to find out the resonance in the system, but this technique lacks of follow information.
- Which combination of L & C are involved in the resonance?
- How many modes are participating in a given resonance?
- What is the sensitivity of a resonance w.r.t different network element/component?
- The effect of resonance on different buses of the network?
- Which is the most effective way to avoid the harmonic resonance?
To answer these questions, a survey has been made and suitable analysis is selected, which is presented in this work.
All wind parks are unique in characteristics. They all have resonance frequencies that are dependent on various factors like grid topology, connected generators, and reactive power equipment used. Furthermore, the impedance and the resonance points of Wind Park changes with the change in number of turbine and capacitor or filter banks in operation.
The connecting cable has also a predominant effect on the resonance frequency. The internal cable connections in a Wind Park connect the turbine of the wind park, whereas the transmission cable connects the wind park to the nearby substation [1]. The total length of the cable varies from a few kilometers to few tens of kilometers. The length of cable, and hence the cable capacitance plays an important role in harmonic resonance.
Capacitor banks and reactors presence also increases the possibility of resonance in the wind power plant. Several capacitors are connected in the form of bank to improve the power factor and reduce the reactive power absorption from grid [2]. The capacitor bank at the PCC level is also used to support the voltage in abnormal conditions. There may be shunted reactors connected to the transmission cable terminations to compensate the high capacitance of a cable. All these components create conducive conditions for harmonic resonance.
In this work, a systematic approach is presented. Starting with the admittance matrix formation, followed by the finding of eigenvalues of discrete frequency points. For resonance or critical frequency, eigenvalue becomes very low or zero. These eigenvalues are then analyzed further to find out the effect of change in a network element on this eigenvalue. Because, the network configuration keeps on changing, depends on the operational requirement and so is the eigenvalue and critical frequency. So, it becomes imperative to find out, how firm or steady is the any resonance frequency.
The structure of this work is explained here. First, the contemporary literature is surveyed in section – 2. The modelling of component is given in section – 3, succeeded by the section – 4, explains the stepwise method for determining resonance frequency. The sensitivity analysis is briefly presented in section – 5. The problem is defined in section – 6 and different cases are elaborated from section – 7 to 10. The filter design to reduce the effect of harmonic resonance is depicted in Section -11. Finally, the work is concluded in section – 12.
2. Review of Related Literature
Various literatures are investigated to find out the work done in the field wind power effect on power quality. There are quite a few numbers of literatures are available, which has focused primarily on the power quality aspect of the wind power. In reference [3], harmonic emission from four different wind park is measured and compared to the harmonic spectrum. Further, the harmonic emission from the wind power converter is small as compared to any harmonic emission load. And mostly inter-harmonics are generated by wind converters. The most important thing found in this work is the frequency – duration plot, depicts how the spectrum is over a period of time. The significant change in the spectrum is observed during the measurement period, not only in magnitude, but also the ratio between different components. It is interesting to know from this work that, some components of harmonics are co-related with the active power variation, but others are not. This is very confusing. Finally, the work is concluded with the comment that, a measurement of one location during a short period of time cannot be represented as the harmonic emission due to wind power installation.
In reference [4], measurement of voltage and current distortion, at two locations inside the wind farm, is compared. The variation of the spectrum with respect to time is presented to show the emission in a Wind Park.
Harmonic variation with the wind farm operating point and the random characteristics of their magnitude and phase angle is measured extensively and the deterministic and stochastic characterization is analyzed in reference [5]. Similar work is found in reference [6]. In this work, the author has done extensive field measurements on commercial available wind turbines and revealed several important observations. In the opinion of this work, the spectrum of harmonic from a wind turbine is extended to few kHz, but with the increase in size of WT, the spectrum limited to low frequency, around less than 1 kHz. Among the several other observations, the important observation is about the presence of lower frequency harmonics (5th, 7th etc…). The lower order harmonics are generally not expected from PWM converter. The lower order harmonics follows the Normal distribution, whereas Rayleigh distribution is found in higher order harmonics. Further, the low order harmonics synchronized with fundamental frequency, but high order harmonics varies randomly between 0 to 2π.
A structured framework is presented in reference [7] to analyse the harmonics emission and the resonance condition in the wind power interconnection with the grid. According to this work, the wideband harmonics from wind turbines are stochastic in nature and they are associated with the active power production. They may adversely interact with the grid impedance and cause unexpected harmonic resonance. This issue needs to be addressed comprehensively at the planning stage, should become more critical as wind power contribution increases in the grid. Unlike conventional power generation, wind power is distributed in nature. So, it is very complex when it comes to analysing the harmonic generation from wind converters. To address this issue, an approach of aggregation of harmonics from individual turbine using a method, similar methodology of IEC 61400 – 21, is presented in reference [8]. In this work, the wind farm with different layout is simulated. Then this result is compared with the aggregated harmonics calculated using proposed methodology. The result presented in this work suggests the use of the proposed methodology for summation of harmonics from the wind farm. According to this work, for better result, both, the accurate modelling of wind farm topology and supply system is very much essential. Similar to this work is found in reference [9], where power quality assessment is done as per IEC 61400-21 procedure.
Another approach of aggregation of wind farm for harmonic propagation is reported in [10]. In this work, detailed model of DFIG is used and using this an aggregated DFIG model is developed to study the harmonic propagation. Frequency domain approach is taken to study the problem. The author emphasizes that all the elements of a system are important, because they are frequency dependent and the whole system can affect the resonance frequencies. The analysis part of this work showed that increase in number of aggregated DFIG cause a shift in the harmonic resonance order.
Reference [11] presented the network reduction method for reducing detailed low – voltage wind farm network to assess the effects of its connection onto a main interconnected transmission system. Application of this method reduces the number of network to be modelled and number of injection nodes which reduces the study time. To demonstrate and prove its validity and effectiveness, the results are compared with the IEC current aggregation method.
Harmonic problems become a concern with the growing number of Wind Power Plant [12], because along with a non-linear load, generation side also contributes to the harmonic emission. In Wind Farm, several conditions may give rise to the resonance phenomenon that will amplify the effect of the harmonic frequency. Add on to this, overview of international standards, grid codes, and basic modelling of Wind Power Plant is also given in this literature.
Reference [13] discusses how a wind power installation can affect the harmonic level in a number of ways. According to the author, Wind Turbines are an additional source of harmonics, particularly non-characteristics harmonics. The resonance point is also depends on strength of the grid. Stronger grid will have a higher order of harmonics, whereas weaker grid gives rise to a lower order of harmonics. Further, the author has extensively explained the sources of primary distortion and secondary distortion. Also, how increase in no of wind power installation weakens the grid is elaborated.
3. Modelling of Components
Electrical components are represented by mathematical equations for analysis purpose. The validity of mathematical equation depends on many factors and it is applicable for certain operating range only. Also, the method of modelling affects the outcome of the analysis. Here, by taking the case of cable modelling, an effort is made to explain the associated difficulties.
HV Cables and Transmission lines are represented either by equivalent PI or T circuit. How the resonant frequency of two different models of the same component is differing, is explained here by example.
A cable with following parameters is modelled.
RSYS=0.04 Ohm
RCABLE = 0.835 Ohm (0.13 Ohm/km)
LCABLE =12.73 mH (0.112 Ohm/km)
CCABLE=4.2 uF (12.73 Ohm/km)
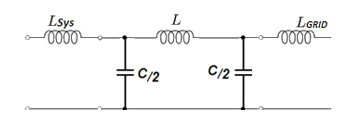 Figure 1: ‘PI’ model of Cable
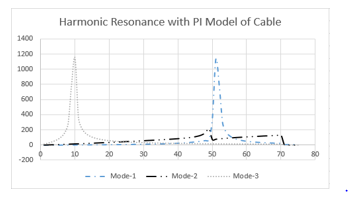 Figure 2: Harmonic Resonance with ‘PI’ model of Cable
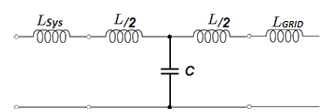 Figure 3: ‘T’ model of Cable
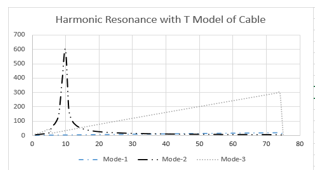 Figure 4: Harmonic Resonance with ‘T’ model of Cable
Comparison of figure 2 and 4 reveals the effect of modelling on the resonance mode. Mode 1 and Mode 3 are predominant with ‘PI’ model, whereas Mode 2 is significant and visible in ‘T’ model of cable. It is important to note that the Mode – 2 with PI model having resonance frequency near to the Mode – 1 of ‘T’ network. Thus, it is inferred from the result that, the mode number depends on the number of capacitive elements in the system.
In ‘PI’ model, the cable capacitance is split into two halves and represented in the form π configuration, so there are two modes one at around 10th order and second is around 50th order. Whereas, in the case of ‘T’ model, only one mode around 10th order is significant, because of lumping of cable capacitance and represented as one element in the form of ‘T’.
The nodal impedance or self-impedance of a network is given by
The effective impedance at any bus is depends on participation factor and modal impedance. Mode with smaller values or poor participation factor, may be omitted for calculation of bus impedance. So, when the impedance at any bus is calculated using any method, the result will not differ much. This is because of change of bus participation factor for a given mode. This can be shown here by calculation, but it is avoided to maintain the privity.
4. Determination of Resonant Frequency Based on Critical Mode
Generally, frequency scan is used for finding harmonic resonance. Though, it is an effective method, but lacking in some aspects. For e.g. frequency scan doesn’t find the involvement of passive elements for a particular resonance frequency. To overcome, this difficulties, modal analysis is adopted in this work. The modal analysis overcomes the points, in which, frequency scan lacks. Here the modal analysis is explained in detailed.
The first step of analysis is the formation of ‘Y’ matrix.
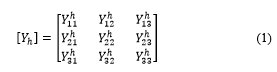 The voltage at different buses is given by
![]() is the network admittance matrix at harmonic order h. is the voltage at different nodes, and is the harmonic current injected at a different nodes. The admittance matrix is a function of network configuration and the frequency. Harmonic sources having frequencies near to the resonance frequency, the admittance matrix offers very high impedance and at resonance frequency the admittance matrix becomes singular. Some nodal voltages rises sharply, when matric approaches singularity. The transition of admittance matrix to singularity offers an effective way to analyze the harmonic problem. The eigenvalue analysis has been used for more than a decade to analyze such problems. The eigenvalue analysis technique is applied to system of linear differential equations. In fact they are applicable to any system involving matrices. In power system, it has been widely used to analyze the dynamic stability.
is the network admittance matrix at harmonic order h. is the voltage at different nodes, and is the harmonic current injected at a different nodes. The admittance matrix is a function of network configuration and the frequency. Harmonic sources having frequencies near to the resonance frequency, the admittance matrix offers very high impedance and at resonance frequency the admittance matrix becomes singular. Some nodal voltages rises sharply, when matric approaches singularity. The transition of admittance matrix to singularity offers an effective way to analyze the harmonic problem. The eigenvalue analysis has been used for more than a decade to analyze such problems. The eigenvalue analysis technique is applied to system of linear differential equations. In fact they are applicable to any system involving matrices. In power system, it has been widely used to analyze the dynamic stability.
According to [3], the matrices can be decomposed in to following form
![]() Where, is the diagonal matrix contains eigenvalues, and and are the left and right eigenvectors respectively. The product of left and right eigenvector is identity matrix, applying this to admittance matrix,
Where, is the diagonal matrix contains eigenvalues, and and are the left and right eigenvectors respectively. The product of left and right eigenvector is identity matrix, applying this to admittance matrix,
So,
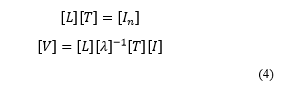 Multiplying both side by ,
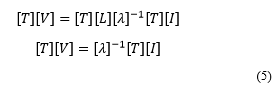 Defining, as the modal voltage vector and as the modal current vector respectively, the above equation can be written as
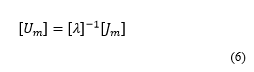 The inverse of the eigenvalue, has the unit of impedance and is known as the modal impedance . From (4), it can be seen that, if =0 or is very small, even a small injection of modal current will lead to a large modal voltage .
 Nodal voltage,
 And nodal current,
 Determination of system resonant frequencies using finding of critical mode is possible by finding out the eigenvalue of ‘Y’ matrix at various discrete frequency. System resonant frequencies can be located from Admittance-frequency curves of the modal Admittance, where admittance approaches vary low value, near to zero. The procedure of resonance determination by using modal analysis is illustrated in flow chart given in figure 1. The maximum magnitude of modal impedances at a resonance can be interpreted as the degree of resonance severity.
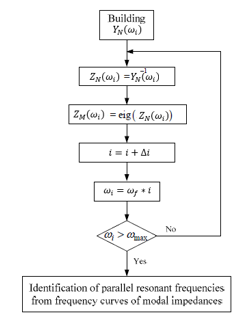 Figure 5: Flow Chart for Critical Eigenvalue Finding
Plot impedance-frequency curve and identify the peaks from curve. Now reduce the , and run the scan again between two frequency value, where the peaks are observed. Stop the scan when .
5. Modal Sensitivity Analysis
The modes or eigenvalues varies with the passive elements of the circuit. So, as the element value changes, mode value also change. The sensitivity of any mode with respect to the any element of matrix is a function of left and right eigenvector [3-5].
According the reference [6], the modal sensitivity is given by equation 10. First order eigenvalue sensitivity of w.r.t parameter is given by
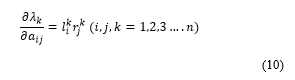 Where,
= Left eigenvector
= right eigenvector
6. Description of Problem
Integration of Wind Farms to the power system has some challenges, one of them is the harmonic resonance, which result in to magnification of harmonics. Several tripping has been observed in the recent days in Wind Farms. The problem analysis pointed out the harmonic resonance as a root cause. Before inverters are connected to the grid, a detailed assessment is required to find out network impedance and also the behavior of network impedance with the change in frequency and also with the change in passive elements. Direct connection of inverters to the grid may give rise to power quality problems. One such problem is analyzed here.
The harmonic emission of WT converters are normally low, and hence voltage distortion usually remain below standard limits. However, the presence of parallel resonance in the Wind Park grid may increase the voltage distortion above the limits and also affect WP harmonic emission to the main grid. Several work analyze the resonance problem at WT terminal by frequency scan method. But as mentioned in section – 4, it is lacking in some crucial aspects and does not provide information related to origin of harmonic magnification. It is used widely because it requires less computation efforts and give quick overview of harmonic resonance. So, the frequency scan method can be used as a compliment of modal analysis.
The wind farm under study consists of 60 WT of 2 MW each. The aggregate capacity of the wind farm is 120 MW. Each WT is connected to the 0.440 /1.1 KV Transformer. The collector level, which is known as pooling substation, is at 33 KV. At the Pooling substation, the voltage is raised through 1.1/33 KV, 12 MVA transformers. The polling station is connected to the 132 KV transmission substation through 36 KV, 485 Sq.mm, and Armoured XLPE cable of 10 km in length. The power is then evacuated from 132 KV substation through transmission line with Moose Conductor.
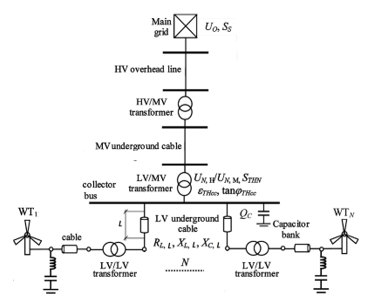 Figure 6: Network Diagram
While running in parallel to the grid, each inverter is able to produce up to 1.95 MW of power. During moderate wind speed condition, each WT generates around 1.2 – 1.3 MW of Power. There was intermittent inverter tripping observed from the site. The inverter tripping history recorded the “Line Overvoltage Fast”. This implies that the line voltage has exceeded 120% for more than 8 cycles (i.e. 120 ms). Also, there was an unusual hissing sound before the tripping.
7. Case – I: Single Wind Turbine with 200 kVAr Capacitor at the Terminal of Wind Turbine
In this case, only one turbine is considered in the Wind Park and 200 kVAr capacitor is connected to its terminal for PF Correction.
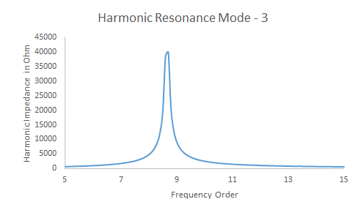 Figure 7: Harmonic Mode – 3, 9th Order
The network is further analyzed to find out the effect on the concerned bus. Using analytical method, the resonant frequency is found out. The first dominant frequency found is 435 Hz, which is near to 9th order. The PF correction capacitor along with combined reactance of LV transformer (0.440 / 1.1 kV), reactance of LV cable and reactance of LV/MV (1.1/33 kV) transformer, forming a parallel resonance at 11th order. PF Capacitor value is 0.595 uF and transformer reactance is 43.56 Ohm.
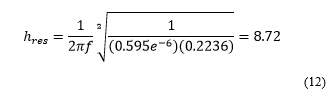
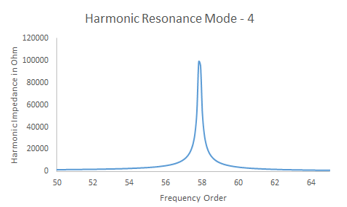 Figure 8: Harmonic Mode – 4, 59th Order
Harmonic Resonance Mode – 4 is contributed by 33 kV Cable capacitance of 0.36 uF. Cable capacitance is acting along with 33 kV Cable reactance, 132 kV transformer reactance, 132 kV line
reactance and Grid reactance, having combined value of 2.40 Ohm. According to analytical expression the harmonic frequency order is 60.7th order as given in equation 13. This is very near to the mode-4 as shown in figure -7.
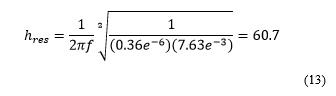
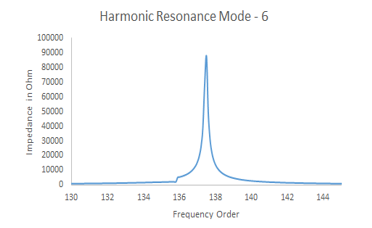 Figure 9: Harmonic Mode – 6, 138th Order
The Mode – 6 is also contributed by 33 kV Cable capacitance. As, the cable is represented by PI equivalent circuit, the total capacitance is divided in to two halves and each capacitor is lumped on two sides of the cable impedance. So, according to analytical expression, the cable capacitance of 0.36 uF is reacting with effective reactance of 33kV Cable, 132 kV transformer, 132 kV line and Grid, having aggregate value of 0.533 Ohm (1.6 || 0.8). Resonance frequency as per the analytical equation (14) is 128.8th order, which is near to the Mode – 6.
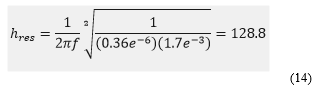 Table 2: Eigenvalue Sensitivity for Case-I
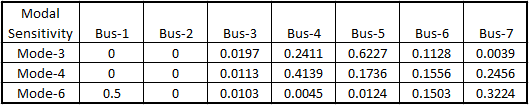
8. Case – II: Two Wind Turbine with 200 kVAr Capacitor at the Terminal of Wind Turbine
In this case, number of wind turbine is increased to two. It can be seen from result plot in figure 8. Two resonance points is seen, one is at 8.1th and second is at 9.5th order. The reason for two resonance peak is multiple capacitors, one is due to the PF capacitor and second is due to the LV cable capacitance.
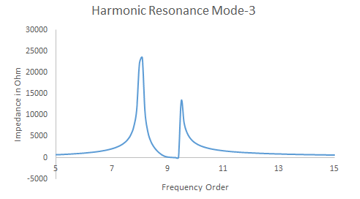 Figure 10: Harmonic Mode – 3, 8.1th and 9.5th Order
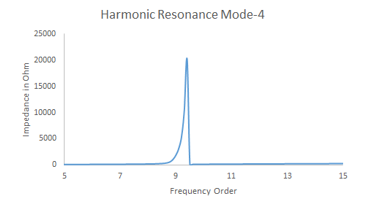 Figure 11: Harmonic Mode – 4, 9.4th Order
Mode – 4 is near to the second peak of Mode – 3. The frequency span between two resonances depends on the impedance between two capacitors. Here, the 1.1kV cable impedance parting cable in to two halves, in PI form. Due to this, two peaks are observed. As the cable impedance is very low, two peaks are observed nearby.
 Figure 12: Harmonic Mode – 4, 58.6th Order
Mode – 4 has second peak at 58.6th order, which is the same as Mode – 4 observed in Case – I. This remains unaffected, as the addition of second wind turbine is not affecting the network above 1.1 kV collector bus to Grid. The same is observed in Mode – 6, as shown in figure – 11. This is also not affected by addition of additional wind turbine.
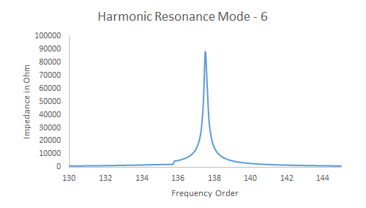 Figure 13: Harmonic Mode – 6, 137.5th Order
Table 3: Eigenvalue Sensitivity for Case-II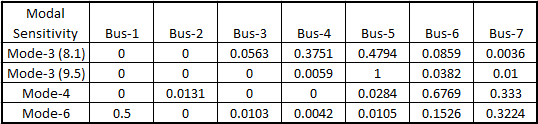
9. Case – III: Six Wind Turbine with 200 kVAr Capacitor at the Terminal of Wind Turbine
This case is extension of Case – II. In this case, the number of turbine is increased to six. The result of modal analysis is given in figure – 12. Comparing with Case-II, the change in first resonance peak is clearly observed. With increase in number of WT, the reduction in first resonance point is noticed. However, the second resonance peak remains unaffected. This can be linked to the fact that only wind turbine is included, but the rest of the network remains unchanged and so is the affected modes.
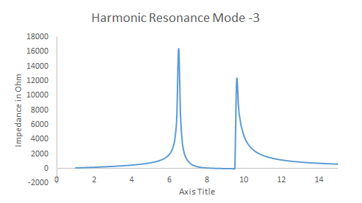 Figure 14: Harmonic Modes – 3, 6.5th and 9.5th Order
In this case, Mode – 4 and Mode – 6 remains unchanged, as this are network dependent modes and as the network configuration is not changed, the modes is also remaining unaffected. The resonance sensitivity analysis is given in Table – 4.
Table 4: Eigenvalue Sensitivity for Case-III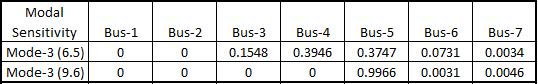
10. Case – IV: Single Wind Turbine with 200 kVAr Capacitor at the 1.1 kV Collector Bus (Bus – 3)
This case is same as Case – I, except one change i.e. PF Capacitor is connected at Bus – 3 instead of Bus – 1. This case is analyzed to study the effect of location of PF Capacitor. Figure – 13. It is observed that, the resonance frequency is relocated to 21.7th order.
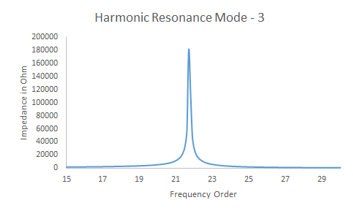 Figure 15: Harmonic Mode – 3, 21.7th Order
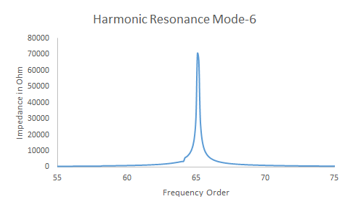 Figure 16: Harmonic Mode – 6, 65.2nd Order
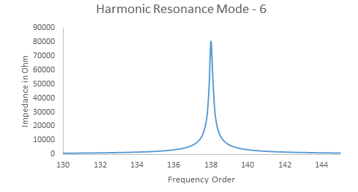 Figure 17: Harmonic Mode – 6, 138th Order
It is observed in figure – 14 and 15, Mode – 6 has now two resonance peak one is at 65.2nd order and second is at 138th order. The second peak is less affected by the relocation of PF capacitor but first resonance is not introduced, which was absent earlier. As the PF capacitor is now connected at 1.1 kV collector bus, it is affecting the network and it is the reason for reshaping of Mode – 6. Sensitivity of Modes is for Case – IV is given in Table – 5.
Table 5: Eigenvalue Sensitivity for Case-IV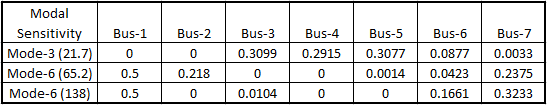
11. Filter Design
A tuned filter design has long been used to reduce the harmonic distortion. But it has several problems, which inhibits its practical implementation. To overcome the problems of tuned filter, a C-Filter topology is widely used, particularly in HVDC and Furnace applications. It is discussed in detail in reference [13]. A filter design is presented in this section to reduce the harmonic impedance at Bus-3 at 450 Hz (i.e. 9th Harmonic). As, the impedance is considerably high around 9th order, the C filter is designed for different value of cost optimization parameter.
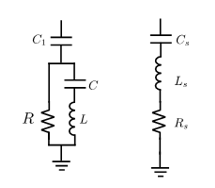 Figure 18: C-Filter and Equivalent Tuned Filter
Based on the analysis given in [14], parameter m, L and C of the filter can be derived from following equations (13) & (14).
 The detail analysis of derivation of equation of 15 and 16 is given in reference [14]. The inclusion of C-Filter reduces the harmonic impedance to low level. For several value of m, the resonance point is checked for the stability and it is observed quite stable.
Table 6: Filter Parameter for Different Value of Cost Optimization Parameter
| Sr. No | m | L (mH) | C(uF) |
| 1 | 2 | 232.2 | 43.63 |
| 2 | 3 | 223 | 45.4 |
| 3 | 4 | 220 | 46 |
| 4 | 5 | 218.8 | 46.3 |
| 5 | 10 | 217.2 | 46.65 |
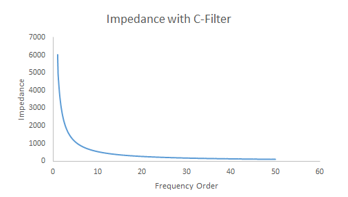 Figure 19: Impedance at 33 KV with R=450 Ohm
The impedance at 33 KV bus after inclusion of C-type filter is given in figure 15 for 450 Ohm of damping resistor. It reveals the important characteristics of C-type topology. The impedance is high around fundamental frequency and is reducing with frequency, so it offers lower impedance path for higher order harmonics and thus reduces the effect of resonance. The measurement data confirms the absence of such a high order harmonic in the inverter output, so the high impedance around 50th order will not affect the wind farm operation. The C-type topology mitigates the harmonic resonance effectively without any resurgence of new resonance point. The application of different topologies and their effectiveness is planned for the future work.
12. Conclusion
To recapitulate the core idea of this work, wind farms cause harmonic distortion in the power system. Also, the resonance point varies depends on the system parameters and system configuration. From the result of different cases, following points are concluded
- As the wind power varies, the resonance point also varies, due to the change of power factor capacitor switching to maintain the power factor and also to support the system voltage.
- The location of PF Capacitor will have significant effect on the resonance frequency
- The resonance frequency reduces with increase in the size of Wind Farm.
- The sensitivity of resonant point with respect to any component of power system is also demonstrated.
- Sensitivity analysis helps us to plan and also design the harmonics filter to avoid critical conditions.
The optimized filter design using sensitivity analysis itself is a dedicated topic and future work on it is already planned. It is the reason why, it is not included in this work.
13. System Data
- 1 kV Transformer: X=0.484 Ohm,
- PF Capacitor: Xc=0.968 Ohm,
- 1 kV Cable: R=0.01 Ohm, X=0.02 Ohm, C=0.36 uF,
- 33 kV Transformer: X=8.712 Ohm,
- 33 kV Cable: R=0.47 Ohm, X=1.6 Ohm, C=0.36 uF,
- 132 kV Transformer: X =5.808 Ohm,
- 132 kV Line: R=0.00080475 Ohm, X=0.01447 Ohm, R/X=18,
- Grid: Fault Level=2500 MVA, R=0.3868 Ohm, X=0.9556 Ohm, R/X=18.
Conflict of Interest
We hereby declare that this work is based on the authors own idea and there is no conflict of interest.
- Sergio L. Varricchlo, Nelson Martins, Leonardo T. G. Ulma, “A Newton-Raphson Method Based On Elgenvalue Sensitivities to Improve Harmonic Voltage Performance”, submitted for publication in the IEEE Transactions on Power Delivery.
- Sergio L. Varrichlo and Nelson Martins, “Filter Design Using a Newton-Raphson Method Based on Elgenvafue Sensitivity”, IEEE Proceedings of the Surer Power Meeting, July 16-20, 2000, Seattle, Washington, USA.
- Kai Yang,Math H.J. Bollen, Fellow, IEEE, and Mats Wahlberg, ”A comparison study of Harmonic Emission Measurements in Four Windparks”, Paper to 2011 IEEE Power & Energy Society General Meeting. 978-1-4577-1002-5/11/$26. 00 ©2011 IEEE
- Kai Yang, Student Member, IEEE, Math H.J. Bollen, Fellow, IEEE, and Mats Wahlberg, “Comparison of Harmonic Emission at Two Nodes in a Wind Park”, https://www.researchgate.net/publication/261055566, Conference Paper, DOI: 10.1109/ICHQP.2012.6381163
- Luis Sainz, Juan Jose Mesas, Remus Teodorescu, Senior Member, IEEE, and Pedro Rodriguez, Member, IEEE, “Deterministic and Stochastic Study of Wind Farm Harmonic Currents”, IEEE Transactions On Energy Conversion, Vol. 25, No. 4, Pg 1071-1080, December 2010
- Paulo F. Ribeiro, Fellow, IEEE,”An Overview of Probabilistic Aspects of Harmonics:State of the Art and New Developments”, IEEE Transaction on Power System, 2005.
- Fabio Medeiros, Dalton C. Brasil, Member, IEEE, Paulo F. Ribeiro, Fellow, IEEE, Cristiano A. G. Marques and Carlos A. Duque, Member, IEEE, “A New Approach for Harmonic Summation Using the Methodology of IEC 61400-21”, DOI: 978-1-4244-7245-1/10/$26.00 ©2010 IEEE
- Morales, X. Robe and J.C. Maun, “Assessment of Wind Power Quality: Implementation of IEC61400-21 Procedures”, RE&PQJ, Vol. 1, No.3, Pg 470 – 476, March 2005.
- Silas Y. Liu, Caio M. Pimenta, Heverton A. Pereira, Victor F. Mendes, Gabriel A. Mendonça And Selênio R. Silva, “Aggregated Dfig Wind Farm Harmonic Propagation Analysis”, Anais do XIX Congresso Brasileiro de Automática, CBA 2012. ISBN: 978-85-8001-069-5
- Foroozan Ghassemi and Kah-Leong Koo, “Equivalent Network for Wind Farm Harmonic Assessments”, IEEE Transactions On Power Delivery, Vol. 25, No. 3, Pg 1808-1815, July 2010.
- K.N Md Hasan, Kalle Rauma2, P. Rodriguez, J. Ignacio Candela, Raul S. Muñoz-Aguilar, Alvaro Luna, “An Overview of Harmonic Analysis and Resonances of Large Wind Power Plant”, Pg 2467-2474,, 978-1-61284-972-0/11/$26.00 ©2011 IEEE
- Math H. J. Bollen And Kai Yang, “Harmonic aspects of wind power integration”, J. Mod. Power Syst. Clean Energy (2013) 1(1):14–21, DOI 10.1007/s40565-013-0001-7
- Jignesh Patel and Satish K. Joshi, “Harmonic Stability of Grid Connected Renewable Energy Source- A Case Study”, UPEC-2017, Greece, October 2017.
- Yao XIAO, Jie ZHAO and Shijie MAO “Theory of the Design of C-Type Filter”, 11th Conference on Harmonic and Quality of Power (2014).
- S. L. Varricchio, N. Martins, L. T. G. Lima and S. Cameiro Jr.“Studying Harmonic Problems Using a Descriptor System Approach”, Proceedings of the IPST’99-International Conference on Power System Transients, Budapest, Hungary, June, 1999.
- P. M. Anderson, B. L. Agrawal and J. E. Van Ness, “Subsyncronous Resonance in Power System”, IEEE Press, New York, USA, 1990.
- IEEE Harmonics Model and Simulation Task Force, “Test systems for harmonics modeling and simulation,” IEEE Trans. Power Del., vol. 14, no. 2, pp. 579–587, Apr. 1999.
- P. Kundur, Power System Stability and Control. New York: McGraw- Hill, 1994.
- G. T. Heydt, Electric Power Quality. West Lafayette, IN: Star in a Circle Publications, 1991
- R. C. Dugan, M. F. McGranaghan, and H. W. Beaty, Electrical Power Systems Quality. New York: McGraw-Hill, 1996.
- T. H. Ortmeyer and K. Zehar, “Distribution system harmonic design,” IEEE Trans. Power Delivery, vol. 6, pp. 289–294, Jan. 1991.
- J. Martinon, P. Fauquembergue, and J. Lachaume, “A state variable approach to harmonic disturbances in distribution networks,” in 7th Int. Conf. on Harmonics and Quality of Power, Las Vegas, NV, Oct. 16th–18th, 1996, pp. 293–299.
- Jignesh Patel, and Satish Joshi, “Harmonic Stability of Grid Connected Renewable Energy Source – A Case Study”, UPEC 2017, Egypt.
- Verghese, G.C.; Perez-Arriaga, I.J.; Schweppe, F.C. “Selective modal analysis with applications to electric power systems—II. The dynamic stability problem,” IEEE Trans. Power App.Syst., vol. PAS-101, no. 9, pp. 3126–3134, Sep. 1982.