The Impacts of Distribution Generators’ Size and Location on Power Efficiency and Voltage Profile in Radial LV Networks

Adv. Sci. Technol. Eng. Syst. J. 3(4), 276–283 (2018);
 DOI: 10.25046/aj030428
This paper presents analytical methods for optimum allocation of distribution generators in a radial distribution network. The aim is to increase power efficiency and reduce loss of power. The ideal size of each distribution generator unit at the identified locations has been carefully selected by making adjustments to loss saving equations and the voltage on a radial feeder. The experimental system is located in the governorate of Bethlehem specifically within the district served by the Jerusalem Distribution Electricity Company (JDECO). The NEPLAN simulator has been utilized in the verification process of the aforementioned experimental system. It entails of several nodes and 400 V-buses that feed up to five household loads. The size and location of each has been carefully chosen. Consequently, significant loss saving, and voltage profile improvement have been reported. Hence, the use of Renewable Distribution Generators (DGs) systems is highly desirable for various reasons including increased system reliability, decreased loss of power, and enhanced voltage profile. Notably, cutting back on the use of conventional fuel will in turn reduce the negative environmental impacts.
1. Introduction
Electric supply companies incur losses of supply on its way to final consumers mainly manifested in the quantities of power infused into distribution grids and the transmission which users are not charged for. Mainly there are two main types of losses: technical and non-technical. This paper will address the technical losses which are losses that occur naturally mainly due to electricity dissipation in power system machineries such as transmissions and distribution channels, transformers, and measurement systems. The losses in electricity are quite higher at the distribution lines compared to that at the transmission systems. This is usually due to the R/X ratio which is higher at the distribution lines. Consequently, reducing the technical losses will increase technical and cost efficiency while relieving the community from the economic and environmental costs of power generation.
Several methods have been implemented in order to save power at distribution systems. Some of which were network reconfiguration and capacitor placement. Notably, the staggering growth of distribution generation may contribute to both the increase in power losses as well as the reduction in power quality at the distribution system. On the other hand, distribution generators, if managed efficiently, can enhance the system’s performance.[1]. This paper is an extension of work previously presented in 2017 [2]. This paper presents a thorough technical and economic analysis of standalone and grid connected photovoltaic (PV) systems. A considerable amount of literature has already been published [3] on studies that showcased the latest technologies in distribution reconfiguration. Optimization of technical losses in electricity has sure been deemed an engineering issue that includes designing the system in addition to planning and modeling.
Among several techniques implemented were selecting the distribution generators’ optimum locations and size. To that end, Adefarati and Bansal have proposed the Markove model to evaluate the reliability of the distribution system with a wind turbine generator (WTG), an electric storage system (ESS), and a photovoltaic (PV) [4]. Several case studies have been conducted to assess reliability,it was found that using distribution generators does in fact improve the reliability of the distribution system.
Moreover, researchers have found that embedded generation on distribution systems can increase the fault level in the system. Hence, Orozco-Henao et al. [5] have presented a fault location (FL) analytical methodology for active distribution networks. The suggested technique has been used to assess the ideal fault level and location. The ATP/EMTP software has been utilized in modeling the test feeder. The results have emphasized the accuracy of this methodology and its potential for success in real-life applications. Additionally, Kaveh et al. [6] have performed a new analytical method to assess the influence of distribution generators.. It was found that the proposed method can be used to specify the ideal location to set the distribution generator to thus reduce phase imbalance, increase power efficiency, and enhance the voltage profile. Another study by Soroudi et al. [7] has presented analytical methods to assess the effects of wind power on the distribution networks. The proposed methods were applied on a distribution network, namely a 69 bus. Interestingly, the numerical method can be used to specify the optimum location, the capacity of renewable energy sources, and to minimize the power losses.
Pukhrem et al. [8] have studied the effects of Rooftop Solar PV Installation in a low-voltage distribution network. To that end, reactive power control and active power curtailment control methods have been applied to reduce voltage fluctuation into the distribution system. The result of merging both approaches has indicated a positive impact on managing and regulating the voltage profile of the system. A numerical study developed by Matlab Simulink [9] to study the influence of the distribution network on the annual energy yield of residential PV systems with variables of increased PV penetration. The study has been conducted upon actual residential PV systems within the UK distribution network. The results have revealed that the level of PV generation would reduce should network voltage rise beyond grid limits. Additionally, the percentage of the annual energy yield, and the economic performance of the systems have been analyzed.
In [10], the author presented the Monte Carlo-based method to analyse the effects of Rooftop photovoltaic (PV) on voltage quality. While in [11] conducted a numerical study of hybrid photovoltaic (PV) and wind turbine (WT) rooftop generation systems (hybrid systems).it has been found that enhanced penetration level of the hybrid system in turn results in maintaining the voltage within range. In [12], the researcher presented an economic analysis of the installation of PV generation on-site (self-consumption) compared to generating solar energy and exporting it to the grid. The study has been conducted on 302 households which have taken part in a UK smart grid project. It was found that 45% of self-consumption can be supplied by the PV generation. This has resulted in decreasing the average annual electricity demand which amounts to 24 percent reduction. In [13], the author provided a review of high penetration of photovoltaic micro-generation on a low voltage distribution network. The study proposed an analytical method to study the effects of high penetration of PV on the radial distribution network. It has been indicated that ‘self-consumption with storage’ is the most efficient method; to reduce overvoltage, to prevent reverse power flow, and in turn reduce power losses.
A noteworthy analysis and discussion on the subject has been presented by Al-Maghalseh [14-16] on several real-life case studies of embedded distribution generations. Interestingly, the effects of different types of renewable energy distribution generation have been clearly evaluated. Horowitz et al. [17] provided an extensive review on the cost of integrating PV systems into distribution networks. Omar and Mahmoud [18] explored grid connected PV home systems in Palestine. A significant amount of published literature has discussed the effects of high PV penetration on low voltage distribution networks [19]. Furthermore, a detailed review of PV in the distribution systems has been carried out in [20-22].
This paper exhibits an ideal blueprint of standalone and grid connected photovoltaic systems which cover the networks’ demand. The blueprint specifies the ideal size and location of the distribution generator at which it will incur slightest technical losses while enhancing the voltage profile.
2. Proposed Methodology
Recently, many studies have been used to optimize the allocation and size of distribution generators. Different analytical approaches have been applied by [1, 23, 24]. Mixed integer non-linear programming method has been used by [25-28]. Atwa and Saadany have used the evolutionary algorithms (EA) technique [28]. Recently, an alternate method has been adopted for the optimization process [19]. This approach has utilized the equivalent current injection technique and neglected the Jacobian matrices. Furthermore, this approach is in line with the analytical method presented in [1]. hence, it is essential to examine the effects of the reactive loss and the real power loss in the system.
In this paper, a simplified analytical method is applied to examine the distribution generation active and reactive branch currents and the related loss savings of a distribution generation located in the radial distribution system. Figure 1 exhibits the N-bus radial distribution system.
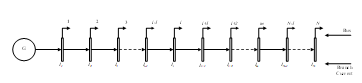 Figure 1. An N-bus radial distribution network.
The total power loss, PL, of N-bus radial DS having n number of branches, (Figure 1) can be presented as:
whereas Ii is the complex current, Iai and Iri are the real and imaginary parts of Ii=(Iai + jIri) respectively, while Ri is the resistance of the ith branch. The value of Ii can be obtained from the load flow solution of the given DG.
Figure 2 exhibits the N-bus radial distribution system with a DG. Upon DG placement in the system, the current (Iinew ) for the branch i, at mth bus can be presented by the following illustration:
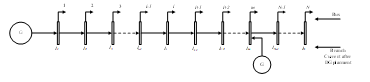 Figure 2. N-bus radial distribution network after distribution generation locating.
Infusing a current influences the currents along the network branches in the area between the substation and the mth bus, while the currents within the rest of the branches remain unaffected. However, and are the real and imaginary components of and Di can be illustrated as follows:
To that end, the formula for the total compensated losses after DG placement may be conveyed as:
The related power losses saving, SL, can be exhibited using (1-6) as:
By simplifying the above equation, we arrive at:
The highest loss saving is due to the DG currents and and can be arrived at using (8) given that the following prerequisites are fulfilled:
As such, based on equation (9) we can derive :
Upon simplifying equations (10) and (11), the active distribution generation current and reactive current representing the highest loss saving formula can be respectively depicted as follows:
The subsequent DG size is arrived at from equations (11-13):
where, is the capacity of mth DG in complex form, and Vm is the phasor voltage at the bus.
3. The Test System
Using NEPLAN software the presented analytical methods have been utilized on a real-life test radial distribution system, for the purpose of optimal DG allocation and sizing. The selected sample involves a system utilized by the Jerusalem District Electricity Co. (JDECO) in the vicinity of the city of Bethlehem. A balanced constant load radial distribution system particularly of a single source (see Figure3). Voltage limitation has been set to a range between -5% and +5%. The DG has been placed south facing the PV systems at a tilted angle of 15o degrees. The type of systems utilized include standalone and grid connected without the effect of shading. Various setups for positioning the DGs have been taken into account. To decrease loss, several possible solutions have been carefully analyzed. Furthermore, a detailed analysis along with a simulation have been conducted for the radial configuration while changing the variables as deemed necessary. The blueprint of the electric network for the aforementioned site is illustrated in Figure3.
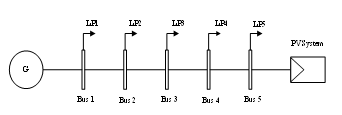 Figure 3. A schematic diagram for the test radial distribution network.
Figure 4. below depicts consumers power consumption in kWh/day. Furthermore, the yearly sun light hours for each month are shown in Figure5.
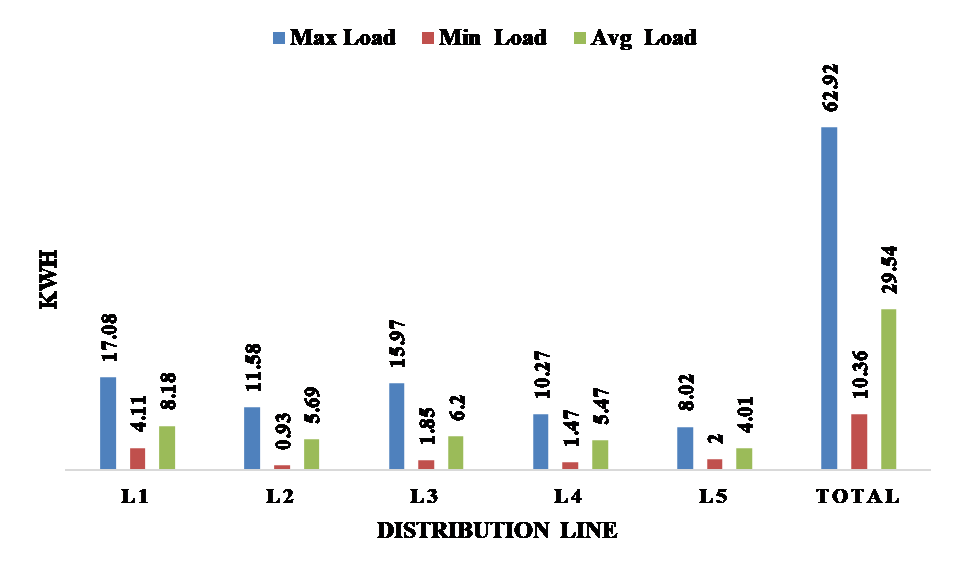 Figure 4. The loads at the distribution line.
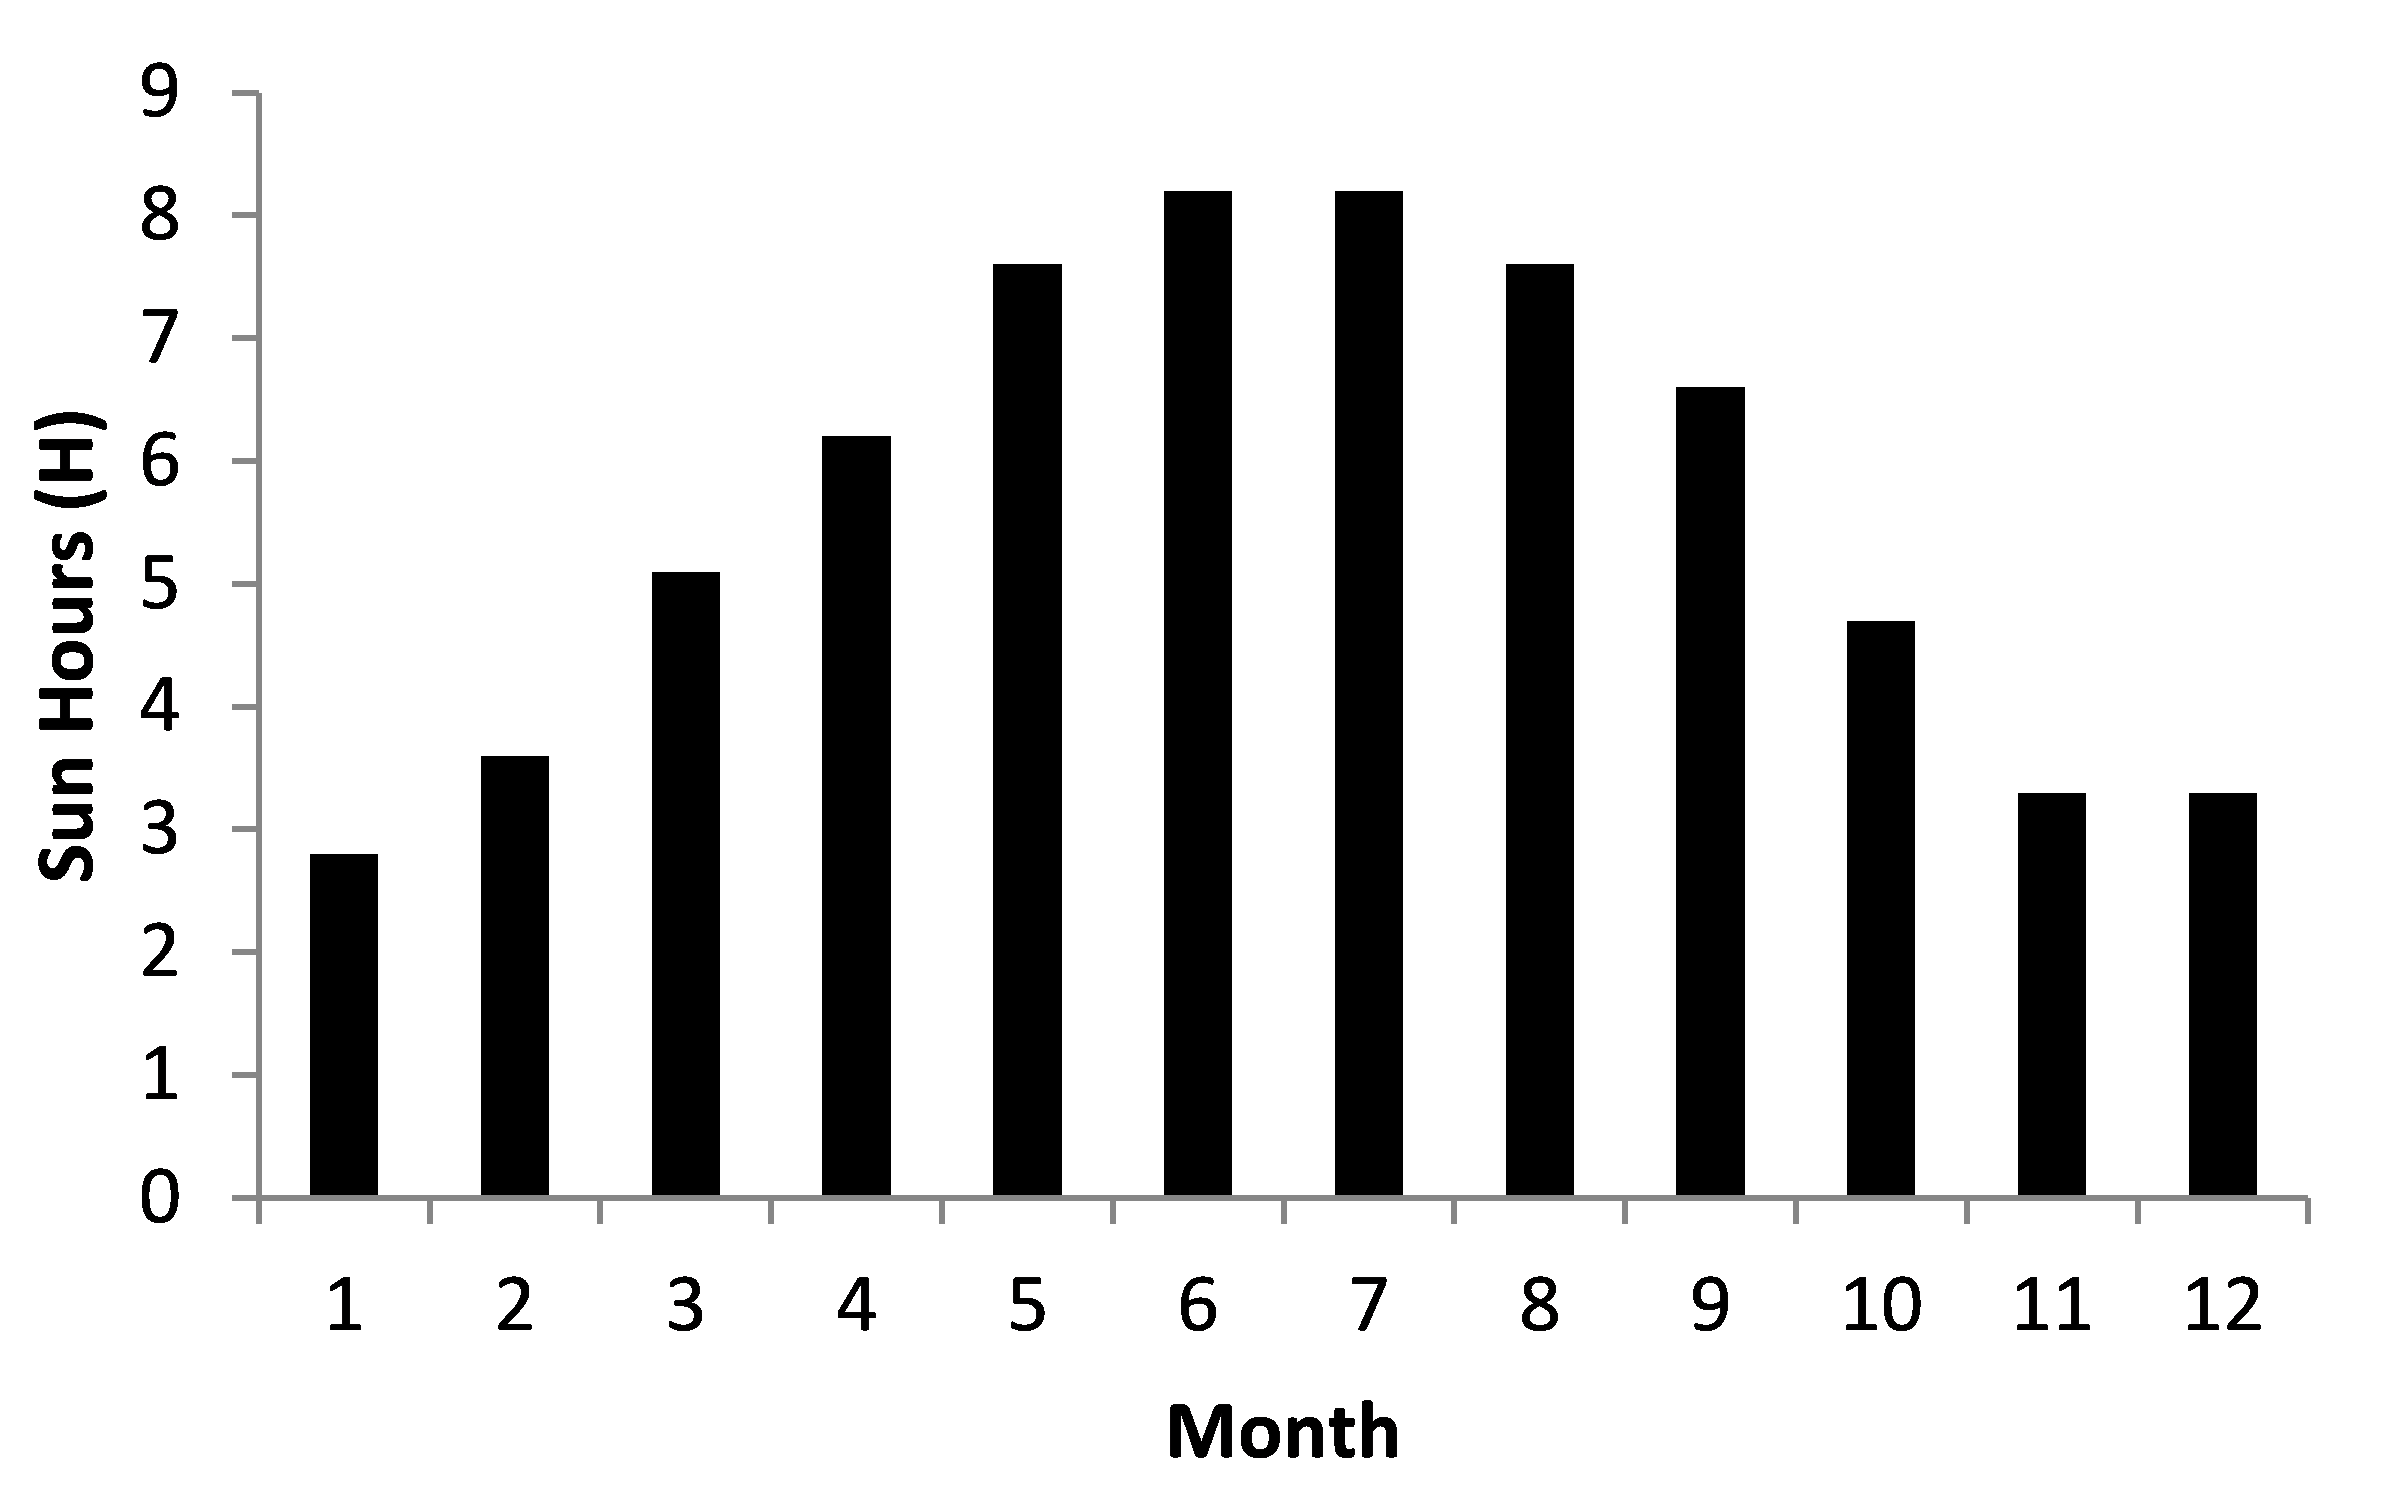 Figure 5. Yearly Sun light hours.
3.1. Photovoltaic system design
The methodology of this study has included researching inputs and the required calculations to determine the potential for either types of solar photovoltaic generation according to the amount of solar radiation.
Grid connected system design:
The electrical characteristics for the panels and the inverter used in the grid connected system are exhibited below in Table 1 and Table 2, respectively.
Table.1. Electrical characteristics for the PV panels under Standard Test Conditions (STC).
| Nominal Maximum Power (Pm) in Watts | 315 |
| Power tolerance | 0 / + 5 W |
| Open Circuit Voltage (Voc) in Volts | 45.25 |
| Short Circuit Current (Isc) in Amps | 9.29 |
| Voltage at Maximum Power (Vmp) in Volts | 36.75 |
| Current at Maximum Power (Imp) in Amps | 8.58 |
| Maximum System Voltage in Volts | 1000 |
| Module Efficiency (%) | 16.25 |
Table.2. Technical characteristics of 10 kW inverter
| Inverter Type | AS-IC01-xxx-2 (2 MPPT) |
| Recommended Max. DC voltage (V) | 1000 |
| Maximum efficiency | 98.30% |
| MPPT range (V) | 200-800 |
| Max. DC power (W) | 10000 |
| Max. input current (A) | 12.5 x 2 |
| Rated output power (W) | 9800 |
| Max. AC output current (A) | 14 |
The system has been designed based on actual figures collected from average power consumption per day. Accordingly, recorded inputs were as follows the consumed energy at an average of 29.54 kWh per day, while sun peak hour approximately 5.58H, whereas the system losses reached approximately 30%, and the future expansion estimated at 20%. Hence, the solar module capacity can be calculated using the equation below as follows:
where, SPH stands for sun peak hours
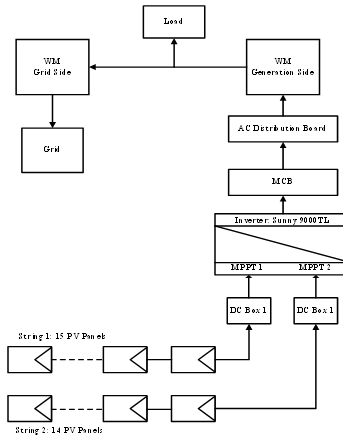 Figure 6. A schematic diagram for the grid connected system.
Adding +20% for future and load growth, the number of modules and energy per year can be calculated using the equation below as follows:
The schematic diagram for the grid connected system design is shown in Figure 6. It exhibits 15 panels connected at input A of the inverter, and 14 panels connected at input B.
Standalone System Design:
The design has been based on the average consumption per day. The energy was recorded at 29.54 kWh per day, the sun peak hour at approximately 2.79H, system losses have reached about 30%, whereas the battery bank can provide up to two autonomy days upon having three sunny days. Panels and an inverter similar to those applied in the grid connected system have been used for the standalone system. Using equation 14, the value of solar module capacity has been approximately 15.11 kW, while accounting for autonomy days.
Consequently, the capacity of the solar system is calculated using equations (15-18) which has been estimated at 25.08 kW. Since the required capacity is approximately 25.08 kW, the estimated number of PV modules needed is 80 Panels. Noting that the system capacity mounted to approximately 25.2 kW, while the general energy generated per year estimated at 17,986 kWh. Hence, to calculate the inverter inputs, we have assumed that: input A= 3 x 16 string panels, and input B = 2 x 16 string panels. In addition, two island inverters have been used. An island inverter to incorporate the storage systems into the standalone systems. Hence, DC voltage for the batteries has been estimated at 48 V. The storage energy for up to two days is calculated using the following formula:
To assess the needed number of DC batteries, we have assumed using 24V/ 100A batteries. For energy safety:
To estimate the capacity of the battery bank needed the following formula has been used:
The total number of batteries has been thus obtained using the following formula:
The number of batteries in each series has been determined by the following formula:
Finally, the number of parallel paths has been obtained by the following formula:
The number of batteries required is 28 batteries (14 parallel branches and 2 series of batteries). In Taking into account the estimated sun peak hours of 2.79, the energy required for 2 days can be verified as follows:
The system has indeed been able to charge batteries to feed the loads for 2 days. Figure7 exhibits the schematic diagram for the standalone system design.
4. Simulation results
In order to select the ideal location to place the DG, the NEPLAN simulator was utilized in testing four case scenarios. Moreover, DG buses have been designed as PQ bus with a power factor of less than one. Listed below are the abovementioned tested case scenarios respectively;
- The impact of highest load with lowest generation
- The impact of highest load with maximum generation
- The impact of lowest load with lowest generation
- The impact of lowest load with highest generation.
Figure 8 below exhibits a schematic of the designated locations of the DG systems in cases 2 and 4.
Figure9 below exhibits the voltage profiles for cases 1 to 4. According to the voltage profile results, it is evident that mounting the PV system at buses 7 and 5 enhances the voltage levels at all buses thus maintaining a range of ±5%. The voltage profiles for cases 3 and 4.
According to the figure, it is evident that the buses increase in voltage levels is recorded at 1.01 Pu and 1.02 Pu. it is highly unlikely for this case to occur, and even if it were to occur during daylight hours, the voltage range will fall within normal rates. Mounting the DG nearby the loads has resulted in quite enhanced voltage profile This indicates that mounting the DG close to the loads enhances the overall voltage profile curve. To conclude, mounting the DG at bus 4 ensures the lowest energy losses and improves the voltage profile thus keeping it within a normal span.
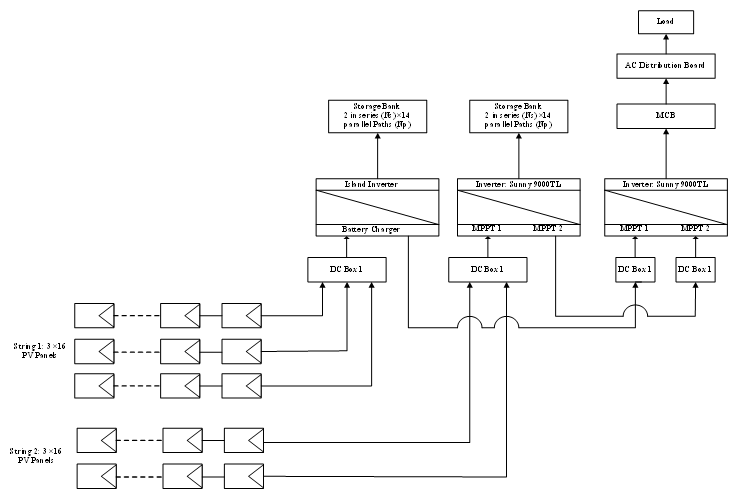 Figure 7. A schematic diagram for grid connected system.
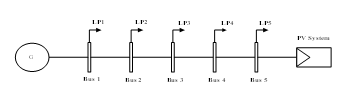 Figure 8. designated locations for the DGs.
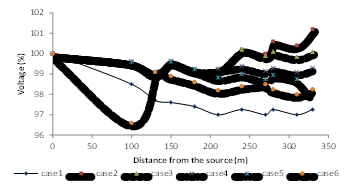 Figure 9. Voltage profiles of the system
5. Economic Analysis
In this section, an economic analysis for both standalone and grid connected systems will be featured along with a feasibility evaluation for each option. The evaluation methodology has been based on some financial principles such as: payback period, internal rate of return (IRR), the levelized cost of electricity (LCOE), and the net present value (NPV).
Payback is among widely used methods to estimate the value of a project. Its value is determined by comparing the cumulative cash investments against the cumulative benefits. The payback period formula is calculated by dividing the initial investment over the cash inflow per period:
The following formula to calculate the net present value NPV gathers the total net benefits of a project upon deducting the costs, thus turning the final value into dollar terms as presented below;
where; Ct = net cash inflow during the period t, Co= total initial investment costs, r = discount rate, and t = number of time periods
The internal rate of return (IRR) is favorably used for comparing projects. It is simply defined as the interest rate which the project is able to produce for the investors, and is calculated as the discount value that when applied in the NPV formula drives the NPV formula to zero. The formula for IRR is:
where, P0, P1, . . . Pn equals the cash flows in periods 1, 2, . . .n, respectively.
The levelized cost of electricity (LCOE) in electrical energy production is considered an essential tool to decide whether to move forward with a said project as it allows us to compare varied technologies of unequal life spans, project size, different capital cost, risk, return, and capacities. It is also described as the current value of the cost of the electrical energy generated over an assumed lifetime in cents/kW.hr. In other words, it is the cost of electricity needed when revenues equal costs. Thus, obtaining a RoC invested equivalent to rebate rate. The following formula exemplifies (LCOE) [29]:
where LCOE is Generation Cost (cents/kWh), It is Investment made per year ($), O&Mt is Operating and maintenance per year ($), PCTt is Production Tax Credit ($), Dt is Depreciation credit ($) , Tt is Tax levy ($), Rt is Land rent ($), Pt is Electrical generation capacity (Kwh) and i is the Discount rate fraction.
Table 3: Constant cost analysis, operation costs, and LEOC for both systems.
| Item | Off- Grid | On-Grid |
| System Size (kW-DC) | $25.20 | $9.13 |
| 1st-Year Production (kWh) | $17,986.36 | $13,017.00 |
| Annual Degradation | 0.50% | 0.50% |
| Cost ($/W) | $1.47 | $1.57 |
| Initial Rebate/Incentive | $2,343.05 | $2,343.05 |
| Total Investment cost | $36,930.00 | $9,137.00 |
| O&M Cost ($/kW) | $10.00 | $15.00 |
| O&M Escalator (%) | 3.00% | 3.00% |
| PPA Rate ($/kWh) | $0.13 | $0.13 |
| PPA Escalator | 3.00% | 3.00% |
| PPA/20 years | $0.1738 | $0.1738 |
| PPA/20 years | $0.1881 | $0.1881 |
| LCOE Outputs/20 years | $0.1205 | $0.0631 |
| LCOE Outputs/25 years | $0.1033 | $0.0554 |
| Discount rate | 0.06 | 0.06 |
| NPV | 15097.56 | 17737.57 |
| IRR | 10.66% | 25.36% |
Table 3 exhibits the analysis for constant cost analysis, operation and maintenance costs, payback period, NPV, IRR, and LEOC for each item. Figure 10 below illustrates the cumulative cash flow for both systems. In general, the feasibility of installing a grid connected system is higher than standalone. Grid connected systems are usually cheaper with better efficiency rates considering the costs associated with the batteries and other standalone equipment which add to cost as well as maintenance. However, standalone systems provide a good alternative to supply remote areas or remote loads in which the investment in installing new electric network is quite higher compared to installing a standalone system. Choosing between a grid-connected and a standalone system is subject to case specifications, and is therefore deemed for the discretion of decision makers.
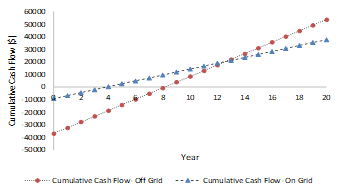 Figure 10. The cumulative cash flow for standalone and grid connected systems.
6. Conclusion
DG’s flexibility, small size, minimum investment expenditure, and ecofriendly interests have the potential to improve distribution system performance. Moreover, DG also supplies increased load over time which in turn has a significant impact decreasing the needed investment. DGs have an advantage over central power plants since they can be mounted at or close to the load. The impact of distributed generation has multi-faceted effects on the system and its machinery including stability, reliability, steady-state procedure, power quality, dynamic procedure, and safety for consumers and power suppliers. Effects could be classified as either positive or negative, contingent upon several factors including the distribution system, distributed generators locations and sizing, and the load characteristics. Positive effects are usually referred to as “system support benefits,” and entail: decrease in loss, enhanced reliability of the utility system, voltage support and enhanced power quality, transmission and distribution capacity release, deferrals of new or upgraded transmission and distribution infrastructure, quick and convenient installation on account of mass-produced components, reducing expenses by evading long distance high voltage transmission, and nature friendly where renewable sources are used.
Optimal allocation of distributed resources will in turn lead to realizing the potential positive impacts of distributed generation. Particularly, because it utilizes the actual function, limits and utilizes a suitable optimization algorithm. To that end, financial performance indicators (internal rate of return (IRR), net present value (NPV) and payback periods) have been assessed for both systems. To conclude, grid connected systems have the upper hand in terms of technical feasibility and economic viability compared to standalone system.
- R. Viral and D. K. Khatod, “An analytical approach for sizing and siting of DGs in balanced radial distribution networks for loss minimization,” International Journal of Electrical Power & Energy Systems, vol. 67, pp. 191-201, 2015/05/01/ 2015.
- M. Al-Maghalseh, S. Odeh, and A. Saleh, “Optimal sizing and allocation of DGs for real power loss reduction and voltage profile improvement in radial LV networks,” in Smart Cities: Improving Quality of Life Using ICT & IoT (HONET-ICT), 2017 14th International Conference on, 2017, pp. 21-25: IEEE.
- O. Badran, S. Mekhilef, H. Mokhlis, and W. Dahalan, “Optimal reconfiguration of distribution system connected with distributed generations: A review of different methodologies,” Renewable and Sustainable Energy Reviews, vol. 73, pp. 854-867, 2017/06/01/ 2017.
- T. Adefarati and R. C. Bansal, “Reliability assessment of distribution system with the integration of renewable distributed generation,” Applied Energy, vol. 185, pp. 158-171, 2017/01/01/ 2017.
- C. Orozco-Henao, A. S. Bretas, R. Chouhy-Leborgne, A. R. Herrera-Orozco, and J. Marín-Quintero, “Active distribution network fault location methodology: A minimum fault reactance and Fibonacci search approach,” International Journal of Electrical Power & Energy Systems, vol. 84, pp. 232-241, 2017/01/01/ 2017.
- M. R. Kaveh, R.-A. Hooshmand, and S. M. Madani, “Simultaneous optimization of re-phasing, reconfiguration and DG placement in distribution networks using BF-SD algorithm,” Applied Soft Computing, vol. 62, pp. 1044-1055, 2018/01/01/ 2018.
- A. Soroudi, A. Rabiee, and A. Keane, “Distribution networks’ energy losses versus hosting capacity of wind power in the presence of demand flexibility,” Renewable Energy, vol. 102, pp. 316-325, 2017/03/01/ 2017.
- S. Pukhrem, M. Basu, M. F. Conlon, and K. Sunderland, “Enhanced Network Voltage Management Techniques Under the Proliferation of Rooftop Solar PV Installation in Low-Voltage Distribution Network,” IEEE Journal of Emerging and Selected Topics in Power Electronics, vol. 5, no. 2, pp. 681-694, 2017.
- G. Pillai, G. Putrus, N. Pearsall, and T. Georgitsioti, “The effect of distribution network on the annual energy yield and economic performance of residential PV systems under high penetration,” Renewable Energy, vol. 108, pp. 144-155, 2017/08/01/ 2017.
- R. Torquato, D. Salles, C. O. Pereira, P. C. M. Meira, and W. Freitas, “A Comprehensive Assessment of PV Hosting Capacity on Low-Voltage Distribution Systems,” IEEE Transactions on Power Delivery, vol. 33, no. 2, pp. 1002-1012, 2018.
- V. Behravesh, R. Keypour, and A. A. Foroud, “Stochastic analysis of solar and wind hybrid rooftop generation systems and their impact on voltage behavior in low voltage distribution systems,” Solar Energy, vol. 166, pp. 317-333, 2018/05/15/ 2018.
- E. McKenna, J. Pless, and S. J. Darby, “Solar photovoltaic self-consumption in the UK residential sector: New estimates from a smart grid demonstration project,” Energy Policy, vol. 118, pp. 482-491, 2018/07/01/ 2018.
- F. M. Camilo, R. Castro, M. E. Almeida, and V. F. Pires, “Assessment of overvoltage mitigation techniques in low-voltage distribution networks with high penetration of photovoltaic microgeneration,” IET Renewable Power Generation, vol. 12, no. 6, pp. 649-656Available: http://digital-library.theiet.org/content/journals/10.1049/iet-rpg.2017.0482
- M. Al-Maghalseh and W. Saleh, “Design and cost analysis of biogas based power plant: Jenin perspective,” in Smart Cities: Improving Quality of Life Using ICT & IoT (HONET-ICT), 2017 14th International Conference on, 2017, pp. 31-35: IEEE.
- M. M. Al-Maghalseh, A. K. Abutemeha, and M. Iyadiyyeh, “Modeling a hybrid system for electrical generation and wastewater treatment using photovoltaic and fuel cells,” (in English), Desalination and Water Treatment, vol. 100, pp. 250-257, 2017.
- M. M. A. Al-Maghalseh, “Evaluating the Reliability worth Indices of Electrical Medium Voltage Network: Case Study,” Procedia Computer Science, vol. 130, pp. 744-752, 2018/01/01/ 2018.
- K. A. W. Horowitz, B. Palmintier, B. Mather, and P. Denholm, “Distribution system costs associated with the deployment of photovoltaic systems,” Renewable and Sustainable Energy Reviews, vol. 90, pp. 420-433, 2018/07/01/ 2018.
- M. A. Omar and M. M. Mahmoud, “Grid connected PV- home systems in Palestine: A review on technical performance, effects and economic feasibility,” Renewable and Sustainable Energy Reviews, vol. 82, pp. 2490-2497, 2018/02/01/ 2018.
- P. Chaudhary and M. Rizwan, “Voltage regulation mitigation techniques in distribution system with high PV penetration: A review,” Renewable and Sustainable Energy Reviews, vol. 82, pp. 3279-3287, 2018/02/01/ 2018.
- D. S. Pillai and N. Rajasekar, “A comprehensive review on protection challenges and fault diagnosis in PV systems,” Renewable and Sustainable Energy Reviews, vol. 91, pp. 18-40, 2018/08/01/ 2018.
- I. Ali, G. M. Shafiullah, and T. Urmee, “A preliminary feasibility of roof-mounted solar PV systems in the Maldives,” Renewable and Sustainable Energy Reviews, vol. 83, pp. 18-32, 2018/03/01/ 2018.
- A. Zurita et al., “State of the art and future prospects for solar PV development in Chile,” Renewable and Sustainable Energy Reviews, vol. 92, pp. 701-727, 2018/09/01/ 2018.
- D. K. Khatod, V. Pant, and J. Sharma, “Evolutionary programming based optimal placement of renewable distributed generators,” IEEE Transactions on Power Systems, vol. 28, no. 2, pp. 683-695, 2013.
- D. Q. Hung and N. Mithulananthan, “Multiple Distributed Generator Placement in Primary Distribution Networks for Loss Reduction,” IEEE TRANSACTIONS ON INDUSTRIAL ELECTRONICS, vol. 60, no. 4, 2013.
- D. Q. Hung, N. Mithulananthan, and R. C. Bansal, “Analytical strategies for renewable distributed generation integration considering energy loss minimization,” Applied Energy, vol. 105, pp. 75-85, 2013/05/01/ 2013.
- R. S. A. Abri, E. F. El-Saadany, and Y. M. Atwa, “Optimal Placement and Sizing Method to Improve the Voltage Stability Margin in a Distribution System Using Distributed Generation,” IEEE Transactions on Power Systems, vol. 28, no. 1, pp. 326-334, 2013.
- Y. M. Atwa, E. F. El-Saadany, M. M. A. Salama, and R. Seethapathy, “Optimal Renewable Resources Mix for Distribution System Energy Loss Minimization,” IEEE Transactions on Power Systems, vol. 25, no. 1, pp. 360-370, 2010.
- Y. M. Atwa and E. F. El-Saadany, “Probabilistic approach for optimal allocation of wind-based distributed generation in distribution systems,” IET Renewable Power Generation, vol. 5, no. 1, pp. 79-88, 2011.
- M. M. Al-Maghalseh and E. M. Maharmeh, “Economic and Technical Analysis of Distributed Generation Connection: A Wind Farm Case Study,” Procedia Computer Science, vol. 83, pp. 790-798, 2016.