
Textural Analysis of Pap Smears Images for k-NN and SVM Based Cervical Cancer Classification System
Volume 3, Issue 4, Page No 218-223, 2018
Author’s Name: Abraham Amole1,a), Bamidele Sanya Osalusi2
View Affiliations
1Department of Electrical, Electronic and Computer Engineering, Bells University of Technology, Ota, P.M.B. 1015, Nigeria.
2Neurology Unit, Department of Medicine, Olabisi Onabanjo University Teaching Hospital, Sagamu, Ogun State, Nigeria
a)Author to whom correspondence should be addressed. E-mail: latidassah@gmail.com
Adv. Sci. Technol. Eng. Syst. J. 3(4), 218-223 (2018); ![]() DOI: 10.25046/aj030420
DOI: 10.25046/aj030420
Keywords: Cervical Cancer, Morphological, Wavelet, GLCM, k-NN, SVM

Export Citations
Early detection and treatment of cervical cancer is crucial to patients’ recovery with a reported success rate of nearly 100%. Presently, Pap smear test which is a visual inspection of cells collected from the ectocervix is the screening tool mainly used in cancer prevention programs. The Pap smear is relatively easy to handle however, it is time-consuming and requires wet fixation of the cytological material. Thus, there is great demand for an automated-screening system that exhibits high sensitivity, high specificity and high-throughput. Hence, a textural based cervical cancer classification system has been developed in this research work. The wavelet transform was used to denoise 120 Pap smear images to enhance its visual quality while the images were segmented using the morphological operations. Eight textural features of GLCM that serve as inputs into the k-NN and SVM classifiers were extracted from each of the images and the performance was evaluated using accuracy, sensitivity and specificity. The result of the developed system shows that clustering shade SVM classifier out-performs entropy k-NN classifier in terms of classification accuracy of 90.0% and 88.3% respectively and vice visa in terms of sensitivity and specificity.
Received: 15 February 2018, Accepted: 17 July 2018, Published Online: 05 August 2018
1. Introduction
Cancer is characterized by uncontrolled growth and spread of abnormal cells and is one of the currently most ravaging diseases and if its spread is uncontrolled, can result in death [1, 2]. Cancer is a complex genetic disease that is potentially fatal and caused mainly by environmental factors that mutate genes encoding critical cell-regulatory proteins [3]. Also, it has been reported by [2] that cancer may be caused by external factors like tobacco, infectious organisms, unhealthy diet and internal factors, such as inherited genetic mutations, hormones and immune conditions. Currently, cancer constitutes public health problem for men and women, it has been reported as the leading cause of death for human being in worldwide, because the cause of the disease is unknown and the early detection of cancer is also tedious [4]. Cancer has variants like breast cancer, prostrate cancer, skin cancer and cervical cancer depending on the organ of the body affected. Cervical cancer is caused by human papillomavirus (HPV) which is a common virus that is passed from one person to another during sex. At least half of sexually active people will have HPV at some point in their lives, but few women will get cervical cancer [5].
Cervical cancer was reported the third most common cause of death among the female [6, 7]. It is a less aggressive cancer that tends to grow slowly with a development rate of several years and in the pre-cancerous stages it may be completely asymptomatic with preinvasive cervix lesions that can only be detected by screening methods [8]. Cervical cancer mostly occurs in women of over age 30 and it remains a challenge for the health care sector because of the numbers of invasive cancer that are involved and the high cost of maintaining quality screening programs. In fact, WHO maintained that cervical cancer constitutes approximately 12% of all cancers in women worldwide and that is a leading cause of mortality and morbidity. For instance, according to [5] approximately 12,000 women in the United States get cervical cancer each year. Cervical cancer can be prevented with regular screening tests and follow-up when found and treated early [2].
Early detection and treatment of cervical cancer is crucial to patients’ recovery with a reported success rate of nearly 100% [8]. Treatments of cervical cancer may include but not limited surgery, radiation, chemotherapy, hormone therapy, immune therapy and targeted therapy. There are a number of different methods like Automated cervical screening techniques, Neuromedical systems, HPV testing, Polar probe [9], flow cytometry [10], colscopy [8] and Pap smear [11] that have been proposed and tested for early detection and diagnosis of cervical cancer. Presently, Pap smear test which is a visual inspection of cells collected from the ectocervix is the screening tool mainly used in cancer prevention programs. The Pap smear looks for precancers and cell changes on the cervix for treatment thus preventing cervical cancer. The use of Pap smear test has led to a considerable reduction in the cases of cervical cancer though it is not a diagnostic but a screening tool [12, 13]. The Pap smear is important in diagnostic cytology because it uniquely stains pattern with differentially smeared cytoplasm. The Pap smear is relatively easy to handle however, it is time-consuming and requires wet fixation of the cytological material. Thus, there is great demand for an automated-screening system hat exhibits high sensitivity, high specificity and high accuracy.
2. Related Works
Several studies, majority of which aimed at early detection and classification of cervical cancer have been developed and reported in literatures. In [5], intelligent classification of cervical pre-cancerous cells based on the FTIR spectra in which peak-corrected area-based features’ extraction (PCABFE) was used and the Hybrid Multilayered Perceptron (HMLP) network was employed for classification with a reported performance of 97.4%. Likewise, [14] worked on identification of abnormal cervical regions from colposcopy image sequences using an algorithm that automates identification of abnormal cervical regions based on a set of low-level feature vectors as input to the support vector machine (SVM) classifier. The highest classification rate obtainable was 94.6% with linear kernel thus made the algorithm accurate and effective. The work of [15] was based on color histogram features used as an input to k-NN, NaiveBayes, and SVM classifiers to detect the Aceto White Region (AWR) with accuracy of over 85% and average sensitivity of over 74%. A comparative study between multi-sparse representation classification with accuracy of 93.3% and classical classifiers like ANN and NaiveBaiyes on cervical cancer cell images trained on genetic algorithm was done in [16]. In [17], a pap smear images classification for early detection of cervical cancer was performed using SVM classifier that gave promising results with average accuracy of 92.961%, sensitivity 90.833% and specificity 80.39%. Also, [11] presented a computer assisted pap smear analyser for cervical cancer screening system that produces higher sensitivity of 93% and 95% in HSIL and SCC grades respectively and was found to reduce the workload of cytologist to almost 60%. In [18] classification of MR Images of cervical cancer using SVM and ANN with classification accuracy found to be 92% and 84% respectively. Finally, [19] worked on improvement of features extraction process and classification of cervical cancer for the Neuralpap System based on Hybrid RBF (HRBF) networks with increase in the accuracy of the classification of cervical cancer to 76.35%, compared with 73.40% which is obtained from the previous NeuralPap system.
3. Materials and Methods
This section presents the stepwise approach towards the development of the developed k-NN and SVM based cervical cancer classification system.
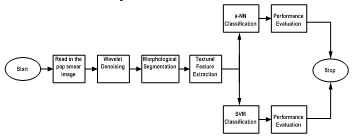 Figure 1: Block Diagram of the Developed System
3.1. Image Data Preparation
The images used in this work was collected online from the smear2005 database of the Herlev University Hospital and sample of the Pap Smear images used in this work were presented in Figures 3 and 2. These smear images were taken at a resolution of 0.201µm/pixel by skilled cyto-technicians with a microscope connected to a frame grabber. Light dysplasia in Figure 3 is one of the three variants of the dysplasia which is characterized by enlarged and light nucleus hence; it has similar features to the carcinoma-in-situ. Figure 2 presented images of cervical carcinoma-in-situ and is also characterized by very large nucleus. One hundred and twenty of these images were selected for use in this work out which sixty were used for training and the remaining sixty were used for testing.
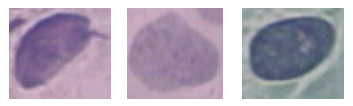 Figure 2: Images of Carcinoma-in-situ before Segmentation
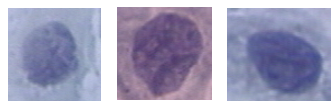 Figure 3: Images of Light Dysplasia before Segmentation
3.2. Wavelet based Denoising
The wavelet system builds a set of blocks to represents a signal or function by giving a time frequency localization of the signal [20, 21]. Wavelet systems are generated from single scaling function by scaling and translation. Hence, wavelet transform has become an important tool for denoising corrupted images by reconstructing the signal on the basis of the observations of a useful signal corrupted by noise [22, 23, 24]. The pap smear images were denoised based on the wavelet system using symlet 4 as the wavelet family.
3.3. Image Segmentation
Image segmentation is the process of partitioning a digital image into multiple segments with the goal of easing the representation of an image into a more meaningful and easy to analyze version. Image segmentation is basic to most medical image classification system hence; several approaches like Fuzzy clustering [25] have been used in the literatures. The morphological operation which applies a structuring element to an input image, creating an output image of the same size based on erosion and dilation was used in this work. Dilation adds pixels to the boundaries of objects in an image, while erosion removes pixels on object boundaries.
3.4. Feature Extraction
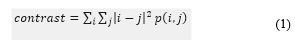
Feature extraction is an important step in any detection and classification system, and it has been reported that the key to successful classification is the ability of representing images based on visual characteristics such as texture, color and shape [26]. Texture is the basic and most widely used techniques for analyzing medical images [27, 28] through the gray level co-occurrence matrix (GLCM) which is a second-order statistical measure of image intensity variation. GLCM considers both the intensities distribution and the position of pixels. It has capability of revealing certain properties about the spatial distribution of the gray levels in the texture. It provides the basis for a number of texture features hence; we built GLCM of the smear images region of interest (ROI) defined as 50 pixel by 50 pixel from which 8 texture features were computed as follows [29, 30]:
- Contrast measures the intensity contrast between a pixel and its neighbour over the whole image. For a “constant” image (no variation) contrast is zero.
 Local homogeneity measures the closeness of the distribution of elements in the GLCM to the GLCM diagonal. For a diagonal GLCM, homogeneity is 1.
 Correlation is a measure of how correlated a pixel is to its neighbour over the whole image. It is 1 or -1 for a perfectly positively or negatively correlated image and infinity for a constant image.
![]() where; and are the GLCM mean of the first and second components
where; and are the GLCM mean of the first and second components
and are the GLCM variances of the first and second components
- Cluster shade and cluster prominence characterises the tendency of clustering of the pixels in the region of interest.
 Entropy is a measure of randomness that can be used to characterise the texture of an image
![]()
- Maximum probability describes the maximum likelihood of producing the pixels of interest.
 Energy returns the sum of squared elements in the GLCM, it has values between 0 and 1, it is 1 for a constant image.
![]() These texture features formed feature vectors which were used as input into two the classifiers whose performance were evaluated using accuracy, sensitivity and specificity.
These texture features formed feature vectors which were used as input into two the classifiers whose performance were evaluated using accuracy, sensitivity and specificity.
3.5. Classification
Subsequent to feature extraction is the classification stage where the images were classified using the support vector machine (SVM) and the k-Nearest Neighbors classifiers.
k-NN Classifier is based on the idea that a sample is classified by a majority vote of its neighbors, with the sample being assigned to the class most common amongst its k nearest neighbors. Let the training samples be described by n attributes thus each sample represents a point in n – dimensional space. Therefore, all the training samples form an n – dimensional pattern space. At the instance of an unknown sample, the k-nearest neighbor (k-NN) classifier searches the pattern space for the k training samples which are closest to the unknown sample where the k training samples are the k-nearest neighbors of the unknown sample [31, 32]. Assuming the number of voting neigbours are k = k1 + k2 …kN, where ki is the number of samples from i in the k sample neighborhood of the test samples. The test sample is assigned to class e if
![]() For this work, 7 nearest neighbours were used throughout the experimental set up.
For this work, 7 nearest neighbours were used throughout the experimental set up.
SVM is one of the most widely used classifiers in medical image analysis [33, 34]. SVMs are primarily two-class classifiers that have been shown to be an attractive and more systematic approach to learn linear or non-linear decision boundaries [35, 36]. It performs classification by constructing a hyperplane in a high-dimensional feature space for linearly separable classes as follows [37];
![]() This can be can be further written as
This can be can be further written as
![]() This implies that the support vectors lie on either of the two hyperplanes and they form the critical elements of the training set. Also;
This implies that the support vectors lie on either of the two hyperplanes and they form the critical elements of the training set. Also;
 Where w = parameter or support vector, li = Langrange multiplier, Ns = feature vector.
SVM can be used for classification purpose under different types of kernel function. Gamma kernel function with γ = 6 was used in this work. The choice of SVM lies in its flexibility due to parameters that can be adjusted to achieve better classification rate. The dimensionality of the feature space is determined by the number of support vectors extracted from the training data [38]. It performs structural risk minimization to achieve good generalization [35, 36].
3.6. Performance Evaluation
The performance of the developed cervical cancer classification system was evaluated based on sensitivity, specificity and accuracy defined as follows;
- Sensitivity is the ability of a system to identify the presence of disease and it has no dependence on the disease prevalence
TP/(TP+FN) (13)
- Specificity Ability to identify the absence of disease and has no dependence on the disease prevalence
TN/(TN+FP) (14)
- Accuracy represents the global reliability of the classification system but depends on the disease prevalence
(TP+TN)/(TP+TN+FP+FN) (15)
The performance of the developed system was evaluated using confusion matrix that shows the percentages of correct and incorrect classifications from which accuracy, sensitivity and specificity were computed. These indices indicate an increasingly high diagnostic performance of the examination under investigation the closer they are to unity [39, 40]. The overall process was implemented using MATLAB 8.5.
4. Results Discussion
This section presents the results of the developed texture based pap smear classification system for cervical cancer. Figure 4 presents some of the morphological operations and wavelet segmented images of carcinoma-in-situ. By visual inspection and comparison of Figure 2 and 4, it can be inferred that the wavelet is effective in remove artifacts from the pap smear images and that the morphological operations effectively segment the nucleus area of the image. Also, Figure 5 presents some of the morphological operations and wavelet segmented images images of light dysplasia. Figure 3 and 5 also gave a comparable result to that of Figure 2 and 4.
Figure 6 present confusion matrix classification results of clustering shade SVM and entropy k-NN with 90.0% and 88.3% respectively. According to Figure 6a, 55 of the images are not cancer whereas 5 are cancer, the SVM algorithm with clustering shade feature predicted 49 as not cancer and 11 as cancer; this translates to 90.0% accuracy. Similarly, in Figure 6b, 1 of the images are not cancer whereas 59 are cancer, the k-NN algorithm with entropy feature predicted 8 as not cancer and 52 as cancer; this translates to 88.3% accuracy. In Table 1, the summary of classification accuracy, sensitivity and specificity for SVM and k-NN classifiers with all texture features were presented. From the table, a general inference that can be drawn is that the SVM classifier with clustering shade out-performs the k-NN classifier with entropy in terms of classification accuracy of 90.0% and 88.3% respectively. On other hand, k-NN classifier with entropy out-performs the SVM classifier with clustering shade in terms of sensitivity and specificity with a value of 1.00 and 0.82 respectively for k-NN classifier and a value of 1.00 and 0.45 respectively for SVM classifier. This result is comparable to the work of [17] in terms of accuracy and sensitivity for SVM classifier.
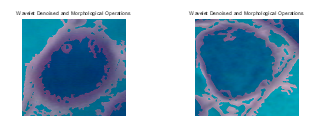 Figure 4: Denoised images of carcinoma-in-situ wavelet and morphological operations.
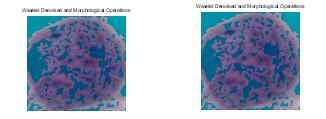 Figure 5: Denoised images of light dysplasia using wavelet and morphological operations.
Table 1: Summary of performance evaluation for SVM and k-NN classifiers
|
Textural Features |
SVM Classifier | k-NN Classifier | ||||
|
Acc. (%) |
Sen. | Spec. |
Acc. (%) |
Sen. | Spec. | |
| CP | 65.0 | 0.51 | 0.36 | 86.7 | 0.90 | 0.00 |
| CS | 90.0 | 1.00 | 0.45 | 86.7 | 1.00 | 0.00 |
| Energy | 65.0 | 0.80 | 0.00 | 86.7 | 1.00 | 0.82 |
| Entropy | 61.7 | 0.84 | 0.00 | 88.3 | 0.80 | 1.00 |
| Cor | 63.3 | 0.00 | 1.00 | 86.7 | 0.80 | 0.27 |
| Con | 81.7 | 0.73 | 0.36 | 86.7 | 1.00 | 0.00 |
| Hom | 66.7 | 0.78 | 0.18 | 86.7 | 1.00 | 0.00 |
| MP | 63.3 | 0.73 | 0.18 | 81.7 | 0.94 | 0.00 |
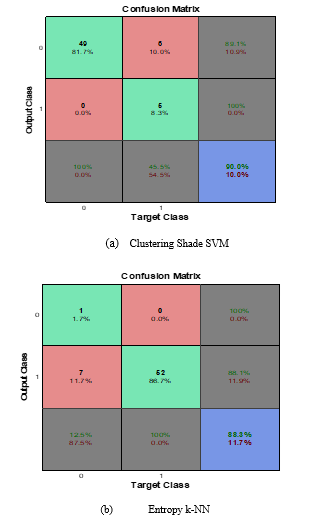 Figure 6: SVM and k-NN confusion matrix classification results with clustering shade and entropy.
5. Conclusion
With this paper our contribution is that we have shown the potential of textural features derived from GLCM in classifying cervical cancer Pap smears images. Generally, the result of the developed system shows that clustering shade SVM classifier out-performs entropy k-NN classifier in terms of classification accuracy of 90.0% and 88.3% respectively and vice visa in terms of sensitivity and specificity.
Acknowledgements
The authors wish thank the Herlev University Hospital for making available smear2005 database from which the test Pap smear image was obtained and Prof. Tope Bello at LAUTECH Teaching Hospital, Osogbo for his assistance and constructive criticism towards the success of this work.
- U.S. Department of Health and Human Services (2016, May 2). Centers for Disease Control and Prevention [Online]. Available: http://www.cdc.gov/cancer.
- American Cancer Society. Cancer Facts & Figures 2015. Atlanta: American Cancer Society; 2015.
- R. A. Malcolm, Cancer, Encyclopedia of Life Sciences. Nature Publishing Group, 2001.
- R.R. Jemila and S. Allwin, “Computerized Cancer Detection and Classification Using Ultrasound Images: A Survey” International Journal of Engineering Research and Development, Vol. 5, Issue 7, PP. 36-47, 2013
- J. Yessi, C. N. Siew and A. A. O. Noor, “Intelligent screening systems for cervical cancer” the Scientific World Journal, Vol. 2014, Article ID 810368, pp: 1-15, 2014.
- S. Rubina, A. Maheswari, K. K. Deodhar, B. Rekhi and K. C. Murali, “Raman spectroscopic study on classification of cervical cell specimens”, Vibrational Spectroscopy, vol. 68, pp: 115– 121, 2013.
- P. Sukumar and R. K. Gnanamurthy, “Computer aided detection of cervical cancer using pap smear images based on hybrid classifier”, International Journal of Applied Engineering Research, Vol. 10, no. 8, pp. 21021-21032, 2015.
- D. G. Juan, K. Jan and L. Wenjing, “Automatic colposcopy video tissue classification using higher order entropy-based image registration”, Computers in Biology and Medicine 41, pp: 960–970, 2011.
- K. Duraisamy, K.S. Jaganathan and J. C. Bose, “Methods of detecting cervical cancer “ Advances in Biological Research, vol. 5, no. 4, pp: 226-232, 2011.
- H. Xiaotian, P. Bo, M. Masakatsu, E. Ryuichiro, I. Junya, T. Yosuke, C. Ying, W. Xiaochun, Y. Wentao, C. Bin and W. Xiaohua, “A novel highly sensitive and specific flow cytometry system for cervical cancer screening”, Gynecologic Oncology, 139 pp: 52–58, 2015.
- R.U. Deepak, R. R. Kumar, N. B Byju, P. N. Sharathkumar, C. C. Pournami, S. Sibi, E. Bengtsson and K. Sujathan, “Computer Assisted Pap Smear Analyser for Cervical Cancer Screening using Quantitative Microscopy”, Journal of Cytology & Histology, pp: 1-6, 2015.
- J. Coste , B. Cochand-Priollet, P. deCremoux, C. Le Gales, I. Cartier, V. Molinie, S. Labbe, M. Vacher-Lavenu and P. Vielh, “Cross sectional study of conventional cervical smear, mono layer cytology, and human papilloma virus DNA testing for cervical cancers creening”, BMJ, vol. 326, pp: 733, 2003.
- C. Mathers, G. Stevens and M. Mascarenhas (2009), “Global Health Risks: Mortality and Burden of Disease Attributable to Selected Major Risks”, in World Health Organization, Geneva, Switzerland, 2009.
- L. Mingpei, Z. Gaopin, H. Xinyu, M. Gaolin and T. Alade, “Identification of abnormal cervical regions from colposcopy image sequences”, in Proceeding of 21st International Conference on Computer Graphics, Visualization and Computer Vision Plzen, Czech Republic, 2013.
- P.S.P. Rama and H. Ranganathan (2013), “Comparing different classifiers for automatic lesion detection in cervix based on colour histogram”, Journal of Computer Applications (JCA), vol. 6, issue 1, pp: 15-18, 2013
- S. S. Simi, V. M. Anit and S. Subha, “Comparative study between sparse representation classification and classical classifiers on cervical cancer cell images” International Journal of Advanced Research in Computer and Communication Engineering, Vol. 3, Issue 8, 2014.
- H. M. Ayubu and Z. Pei, “Pap smear images classification for early detection of cervical cancer”, International Journal of Computer Applications, vol. 118, No. 7, 2015.
- S. P. Aabha and B. B. Ashwini, “Classification of MR Images of Cervical Cancer Using SVM and ANN”, IJSR – International Journal of Scientific Research, vol. 4, Issue 5, pp: 3-6, 2015.
- S. N. Sulaimana, N. A. Mat-Isab, N. H. Othmanc and F. Ahmada, “Improvement of features extraction process and classification of cervical cancer for the neuralpap system”, in Proceeding 19th International Conference on Knowledge Based and Intelligent Information and Engineering Systems, Procedia Computer Science 60, pp: 750 – 759, 2015.
- P. Rathore and P. Dutta, “Implementation of noise removal methods of images using discrete wavelet transform and filters”, International Research Journal of Engineering and Technology, vol. 03 issue. 02, pp: 870-877, 2016.
- A. K. Sevcan, “Diagnosis of cervical cancer cell taken from scanning electron and atomic force microscope images of the same patients using discrete wavelet entropy energy and Jensen Shannon, Hellinger, Triangle Measure classifier”, Spectrochimica Acta Part A: Molecular and Biomolecular Spectroscopy vol. 160, pp: 39–49, 2016.
- M. Misiti, Y. Misiti, G. Oppenheim and J. M. Poggi, “Wavelets and their applications”, UK, ISTE, 2007.
- M. Sonka,V. Hlavac and R. Boyle, “Image processing, analysis, and machine vision”, Pp10-210 & 646-670
- M. Raghuveer, A.S. Rao and Bopardikar, “Wavelet Transforms: Introduction to Theory and Application”, Addison-Wesley, 2001.
- J. Talukdar, C. K. Nath and P.H.Talukdar (2013), “Fuzzy Clustering Based Image Segmentation of Pap smear Images of Cervical Cancer Cell Using FCM Algorithm, International Journal of Engineering and Innovative Technology (IJEIT), vol. 3, Issue 1, pp: 460-462, 2013.
- L. Alessandra, N. Loris and B. Shery, “Multilayer descriptors for medical image classification”, Computers in Biology and Medicine 72, pp. 239–247, 2016.
- R. M. Rangayyan, Biomedical Image Analysis, Boca Raton FL: CRC Press, 2005.
- F. Lucas, M.R. Rangaraj, A. M. Guilherme, M. A. Paulo and H. N. Marcello, “Shape, texture and statistical features for classification of benign and malignant vertebral compression fractures in magnetic resonance images”, Computers in Biology and Medicine, 73, Pp: 147–156, 2016.
- D. O. Aborisade, J. A. Ojo, A. O. Amole and A. O. Durodola A.O (2014), “Comparative analysis of textural features derived from glcm for ultrasound liver image classification”, International Journal of Computer Trends and Technology (IJCTT) – vol. 11 no. 6, pp: 239-244, 2014.
- R.M. Haralick R.M., Shanmugam K. and I. Dinstein, “Textural features for image classification”, IEEETrans. Syst.ManCybern, vol. 3, no. 6, pp. 610–621, 1973.
- R. E. Maleki, A. Rezaei and B. M. Bidgoli, “Comparison of Classification Methods Based on the Type of Attributes and Sample Size” Department of Computer Engineering, Iran University of Science & Technology (IUST), Tehran, Iran.
- J. Han and M. Kamber, Data Mining: Concepts and Techniques, Elsevier, Second Edition, 2006.
- E. Kim, and X. Huang, “A data driven approach to cervigram image analysis and classification”, In: Color Medical Image analysis, Lecture Notes in Computational Vision and Biomechanics, Vol. 6, 113, 2012. N No 2277 – 9
- J. Zhang and Y. Liu, “Cervical cancer detection using SVM based feature screening”, In: MICCAI, Vol. 3217, pp: 873-880, 2004.
- V. Vapnik, The Nature of Statistical Learning Theory, Berlin, Springer, 1995.
- C. Burges, “Tutorial on support vector machines for pattern recognition”, Data Mining Knowledge Discovery, vol. 2, no. 2, pp; 955-974, 1998.
- K. Fukunaga, Introduction to Statistical Pattern Recognition. Academic Press. USA, 1990.
- J.A.K. Suykens, T.V. Gestel, J.D. Brabanter and J.V.B.De Moor, Least Squares Support Vector Machines. Singapore, World Scientific Pub. Co., 2002.
- S. Francesco and D.L. Giovanni, Biostatistics for Radiologists, Italia, Springer-Verlag, 2008.
- J. Yessi, A. M. Nor, A. Rohana and H. O. Nor, “Intelligent classification of cervical pre-cancerous cells based on the FTIR spectra, Ain Shams Engineering Journal 3, Pp: 61–70, 2012.