Psychoacoustical Approach in Soundscape Characterization

Adv. Sci. Technol. Eng. Syst. J. 3(4), 211–217 (2018);
 DOI: 10.25046/aj030419
Four different soundscapes with different loudness and spectral distributions were recorded in Zagreb (capital of Croatia) and reproduced to two groups of listeners while they were performing a concentration demanding task – a simplified variation of the memory game. These two groups of test subjects listened to the same soundscapes but with different loudness distribution. The game results versus time were recorded, analyzed and compared to questionnaire answers, along with loudness and property changes of each soundscape. The goal was to determine which of the sound events causes the largest distraction and to establish a connection between these results and the annoyance level of each soundscape. As expected, the loudest soundscape resulted in the lowest score and caused the largest annoyance. However, other factors proved to cause listeners’ distraction, mainly unexpected sounds that differ from the main sound print. In that sense, this paper also deals with a concept of creating enjoyable sound environment in urban places.
1. Introduction
The initial concept of soundscape was proposed as an attempt to create an analytical perspective that would explain the total acoustic environment over time and across cultures [1]. Schafer wrote in 1977: “Ecology is the study of the relationship between living organisms and their environment. Acoustic ecology is the study of sounds in relationship to life and society.” He also suggested three different types of noise: 1) unwanted sound, 2) unmusical sound (defined as non-periodic vibration and 3) any loud sound and disturbance in signaling systems. In his book he deals with the idea that every city has a unique urban soundscape and furthermore, every part of the city has a unique soundscape. An example for that is a siren in a noisy environment can be barely noticeable, while the same siren in a different but calmer neighborhood can result in a temporal or chronic hearing loss if the attack is sudden [2],[3]. The soundscape studies are multidisciplinary and include: acoustics, psychoacoustics, otology (study and treatment of the ear) and noise reduction. Most soundscape studies concern the qualitative analysis of soundscapes; however, the methods for evaluating a soundscape vary depending on the purposes of the studies and the researchers conducting them [4],[5]. So far soundscape research has been oriented mainly on evaluating a soundscape in a qualitative way, e.g. assessing the soundscape pleasantness or rather its unpleasantness [6]-[9]. In order to describe a certain soundscape in greater detail and provide a more comprehensive approach to soundscape research, it is necessary to use other methods which could also define soundscape characteristics quantitatively. The basis for acoustical characterization can be achieved by using a set of subjective descriptors, for example bipolar adjectives, that describe specific soundscape characteristics such as loudness or a level of distraction or annoyance by a certain sound and are then assigned a numerical score which enables and facilitates the statistical analysis of specific sound properties [2],[10]-[12].
From a quantitative point of view, statistical relevance is of utmost importance in efforts to describe or quantify a listener’s perception and evaluation of a soundscape. Taking into account several variables such as loudness, pitch strength and fluctuation of pitch strength among others, it is possible to calculate the annoyance level of a certain sound or a soundscape [13]-[16]. Another part of soundscape and sound analysis deals with their distraction properties and the way in which characteristic sounds influence people performing logical, mathematical and other concentration demanding tasks [10],[11].
People are exposed to different sound environments on a daily basis. Long exposure to a specific sound environment results in eventual adaptation to that environment, and small and expected loudness changes in soundscape do not significantly influence one’s perception of that soundscape [2]. Frequent exposure to even a slight change in our everyday sound environment would also result in adaptation; furthermore, providing the loudness levels were not significantly higher, these changes would not be perceived as annoying [3].
In this paper, we aimed at analyzing and comparing in what way certain soundscapes with different loudness distributions distract listeners performing a rather simple but concentration-demanding task, like a simplified variation of the memory game. Since the test subjects received no training prior to undergoing the testing and were only given technical information pertaining to the testing environment, this game was chosen due to the familiarity of the test subjects with its format. Furthermore, the level of concentration required for this simplified variation of the game corresponds to day-to-day situations where people perform basic tasks while being exposed to different sounds which do not require their focus, but only cause distraction. We wanted to monitor listeners’ reactions to different sounds in the background of the main theme of a soundscape and to determine whether these sound events cause the distraction on the same level as louder, familiar and expected sounds of a certain soundscape.
In general, we intentionally opted for different spectral content, loudness distribution, duration and rate of change of individual louder events in the recorded soundscapes. The underlying idea was that the listeners perform a certain task for the duration of all soundscapes. We wanted for the listeners to perceive the soundscapes subconsciously, rather than actually listen to the recordings. The task involved playing a game, thus requiring a higher level of concentration. The results of the game for all listeners were compared to questionnaire responses which lead us to conclude that, when analyzing soundscape in general, listeners base the level of their annoyance mainly on loudness. On the other hand, distraction can also be attributed to unexpected sounds that are somewhat different from the main sound print.
Furthermore, a soundscape by definition includes a certain environment and therefore a large number of sound sources that affect human activity, concentration and mood which is why soundscape research investigates the conditions and reasons of its origin as well as the level of human soundscape perception and evaluation1.
Tim Beatley also explains in his paper “Celebrating the Natural Soundscapes of Cities” (2013) the importance of soundscape of the city in a way that the city should be enriched with natural sounds. There are also other studies that have shown that people especially enjoy the sound of water6. In that sense, we can conclude that the real challenge is how to create an enjoyable soundscape in nowadays overpopulated cities.
Unfortunately, the main concern of the society in general, is still only noise management and legislative. We can conclude that nowadays, urban planners have a big challenge before them. While fitting visual aesthetics with solutions for transport, waste and energy, they need to bear in mind the natural soundscape preservation perspectives.
2. Urban Soundscapes in Zagreb
The first recorded soundscape was a children’s park situated in the western suburb of Zagreb and surrounded by large housing blocks. Figure 1 shows a spectrogram of the recorded children’s park environment excerpt. The spectrogram is relatively wide stretching above 10 kHz, with very short leaps in loudness change which are up to 20 dB higher when compared to the steady part of the recording.
The second recorded soundscape was the expressway stretching from the east to the western exit of the city. Traffic in this avenue is almost always heavy and dense so the soundscape included sounds coming from cars, buses and trucks passing by and an audible traffic signal for the visually impaired (see Figure 2). The frequency spectrum is narrower compared to the children’s park environment and is mainly concentrated at frequencies below 1 kHz. Sudden and large changes in loudness were not as unexpected for the expressway environment as they were in the case of the children’s park.
The third soundscape was a stream on the outskirts of western part of Zagreb, in a small forest surrounded with local roads. The recording included sounds coming from the stream, nearby traffic, children playing and a small dog barking. Figure 3 shows the frequency spectrum of this recording excerpt. It is narrow and concentrated in the low frequencies making the sudden loudness changes (dog barking, children screaming etc.) very discernible.
The fourth soundscape was an industrial hall which produces rail vehicles situated in the eastern part of Zagreb. Figure 4 is a spectrogram of this soundscape which included the sounds of power tools such as grinders and drills, the sound of a hammer hitting metal and music coming from the radio. These specific sounds are very loud, as shown on the spectrogram (see Figure 4). The frequency spectrum is up to 10 kHz wide, with short loudness changes rising to 30 dB above the average level.
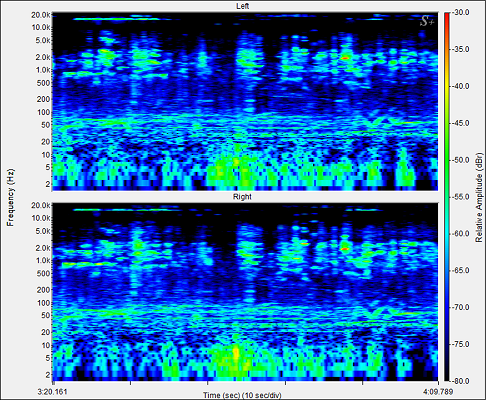 Figure 1. Children’s park spectrogram
These four soundscapes were chosen due to their relatively different sound characteristics. An average person living in an urban environment is familiar with three of them: the children’s park, the expressway and the stream soundscape. However, the industrial hall soundscape is less common, to say the least. For the research, comparing familiar with unfamiliar soundscapes enabled us to analyze whether the former was perceived less distracting than the latter. The research participants were divided into two groups: the control (marked CG) and experimental group (marked EG). The experimental group listened to the soundscapes with frequent sudden and short loudness changes, and the control group listened to the same soundscape but with lower loudness changes. Loudness versus time diagram were also created for a specific soundscape and listening group (see Figures 5a, 5b, 5c and 5d) based on Figures 1 to 4. In Figures 5a, 5b, 5c and 5d the soundscape recording for the experimental group is marked with a solid line while the recording for the control group is marked with a dotted line.
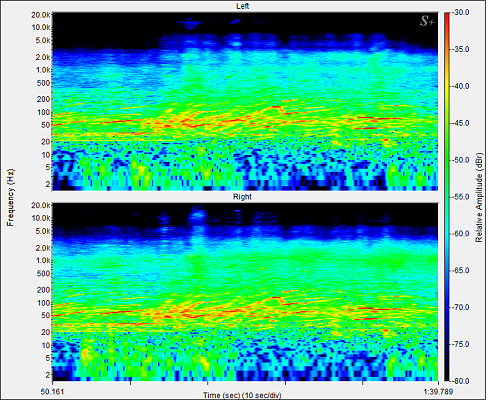 Figure 2. Expressway spectrogram
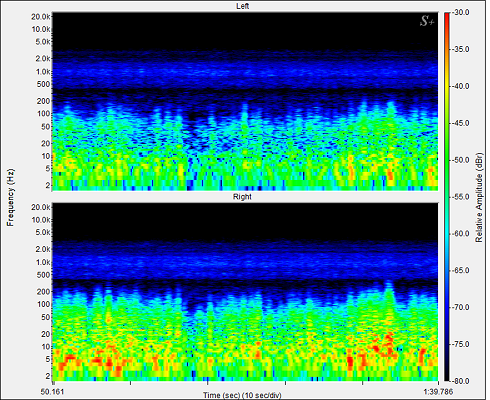 Figure 3. Forest stream spectrogram
3. Listening Tests
Four characteristic urban soundscapes were recorded using the soundwalk method [5,17]. The soundscape samples were recorded using the M-AUDIO recorder [18] and a pair of binaural microphones, with a 48 kHz sampling rate and a 16 bit quantization standard. The soundwalks were performed at different times of the day, different days of the week, always in nice, dry and sunny weather in March 2018. These recordings were performed at the soundwalker’s height so that the patterns obtained would be as similar to the natural binaural listening of people residing in these soundscapes. The recordings were then reproduced to two groups of listeners: the control group (CG) and the experimental group (EG). The experimental group listened to the soundscapes with frequent sudden and short loudness changes, and the control group listened to the same soundscape but with lower loudness changes.
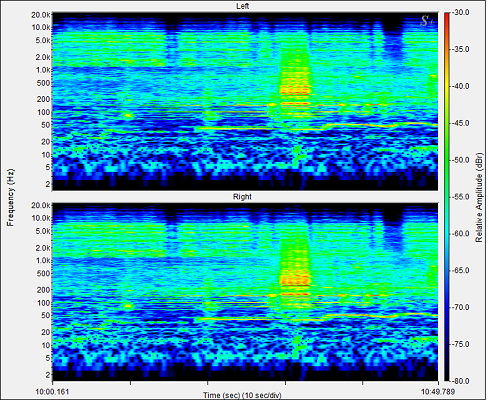 Figure 4. Industrial hall spectrogram
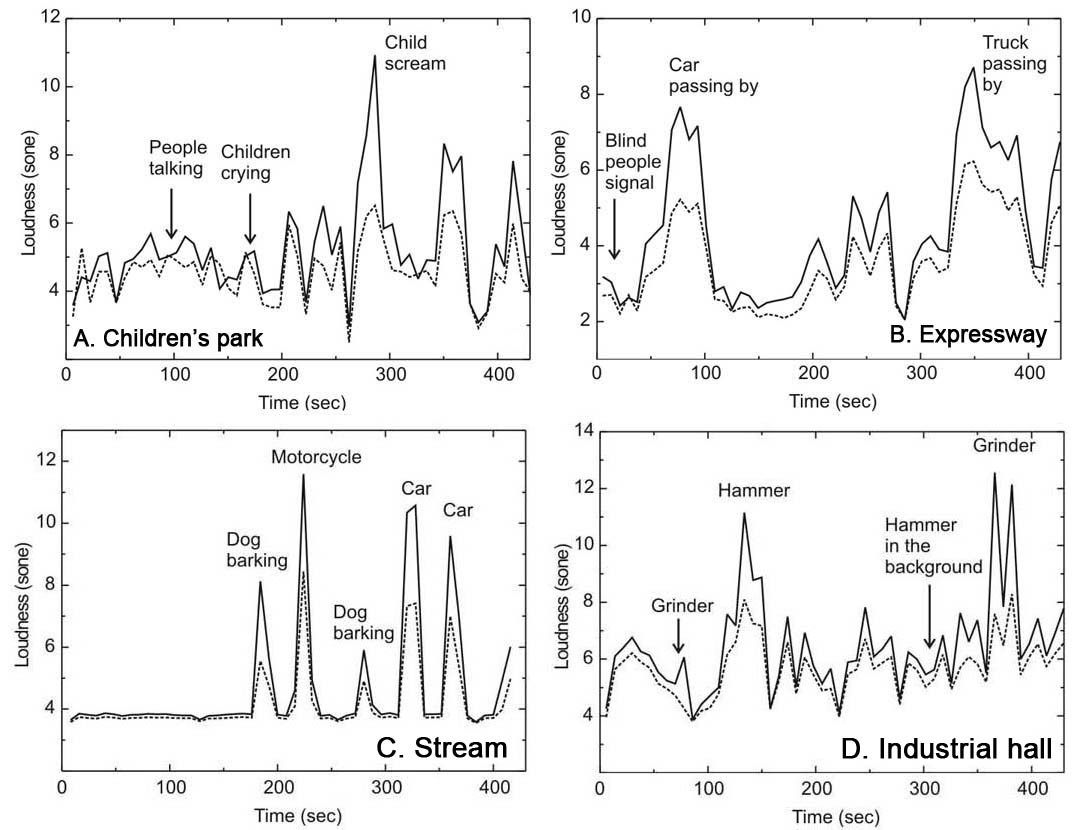 Figure 5. Average loudness versus time diagram for (the control group is presented with a dotted line and experimental group with a solid line): a) children’s park, b) expressway, c) stream and d) industrial hall
The recordings were reproduced using AKG K55 closed electrodynamic headphones with an average sound pressure level of 50 dB(A) in the steady part of the recorded soundscape. Loudness was calculated using the established Zwicker method [13],[14]. Free field equalization was used. It is important to emphasize that average sound pressure level of 50 dBA refers to the recordings listened by the experimental group while the recordings for the control group are corrected by a compressor with a limit value of 60 dBA and a compression ratio of 3:1. The listeners’ groups had equal female-to-male ratio, with median age of 24. Each of the listeners listened to all four recordings with a time gap of at least one week in order to facilitate recovery time and eliminate any potential influence of one recording on another. The listeners were not informed as to the content of the recording. The order of the listening of the soundscapes was fixed for all listeners which is in line with the established psychological and statistical research methodology and praxis [19],[20], and is as follows: the children’s park soundscape, the expressway soundscape, the industrial hall soundscape and the stream soundscape. The results wouldn’t have been different if we chose a different order of the soundscape listening. However, once you have chosen the order of the listening it has to remain the same for all participants of the study. For example: if a participant is placed in a control group (he or she is not of course aware of it) then he or she has to stay in the control group till the end of the study. Furthermore, if one participant listened the soundscapes in a certain order then the rest of the participants must have the same order due to psychological methodology and its requirement that all participants have to have the same testing conditions. Thus, this way of research enables the researcher to have a better control over the study.
Table 1 Most annoying sounds for the experimental and control groups (EG- experimental group, CG- control group)
| Children’s park | EG | CG |
| children screaming | 44,8% | 34,7% |
| sound of the swing | 27,6% | 20,4% |
| children crying | 10,4% | 8,2% |
| kindergarten teacher | 13,8% | 16,3% |
| all of the above | 1,7% | 8,2% |
| nothing bothered me | 1,7% | 12,2% |
| Expressway | EG | CG |
| vehicle horn | 13,3% | 2,4% |
| audible traffic signal for the visually impaired | 11,1% | 17,1% |
| sound of cars | 21,1% | 43,9% |
| all of the above | 0,0% | 7,3% |
| nothing bothered me | 24,5% | 29,3% |
| Industrial hall | EG | CG |
| sound of power grinders | 18,2% | 41,9% |
| sound of hammers | 70,4% | 38,7% |
| music from the radio | 0,0% | 1,6% |
| all of the above | 2,3% | 1,6% |
| nothing bothered me | 9,1% | 16,2% |
| Stream | EG | CG |
| small dog barking | 27,6% | 5,2% |
| children screaming | 20,7% | 10,7% |
| bus passing by | 37,9% | 7,3% |
| stream bubbling | 0,0% | 10,5% |
| all of the above | 13,8% | 0,0% |
| nothing bothered me | 0,0% | 66,3% |
Additionally, a questionnaire was composed in order to get a more detailed description of which particular sounds in a given soundscape were the most annoying and why. The listeners had to provide an answer to a direct question: Which of the given sounds in the soundscape bothered you the most? This form of research enabled us to establish a connection between annoying sounds and the results of the game (e.g. listeners’ distraction). For every soundscape we have supplied a list of potentially most annoying sounds. However, the list was far from selective as it contained all the characteristic sound events appearing in a certain soundscape. Our intention was to provide a reminder for the listeners considering the long duration of the soundscape samples, rather than to influence their answers. These results are laid out in Table 1. In addition to the list of the characteristic sound events, the questionnaire provided the “all or nothing of the above” answer options for each soundscape.
4. The Game
During the first listening of each soundscape, the listeners had to solve an interactive game, similar to the traditional children’s memory game, programmed in MATLAB (see Figure 6).
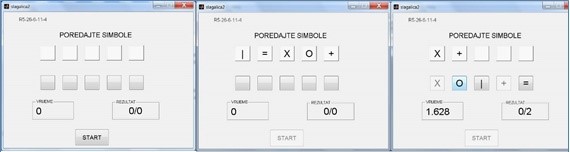 Figure 6. The game interface in MATLAB
The listeners played the game on the computer, while at the same time listening to a certain soundscape. The game uses five cards with simple mathematical symbols (X, O, I, +, =). The symbols on the cards are revealed to the listener in a random order for four seconds. The goal is for the listener to line up the symbols on the cards according to the order in which they appeared. Time allotted for this task is seven seconds, with a two second pause before the next layout of the cards. If the listener makes a mistake while arranging the symbols on cards, a new hand of cards is drawn automatically. The game is not intended to be difficult or complicated, but rather to serve as means of assessing listener’s concentration or the absence thereof during specific sound events in each soundscape, i.e., sudden loudness changes. For the duration of each soundscape, the program generates orders of symbols and records the listener’s score. In this way we could establish and analyze the potential correlation between the results of the game and time, as well as identify certain parts of a soundscape that could have caused the distraction occurring at a specific point in time. The results of the game, representing the success ratio of each move, are generated numerically. For instance, if a listener successfully arranged all the cards in the given time frame, their result for this move equaled 1. If a listener successfully arranged only 3 out of 5 cards, the result was 3/5 = 0.6. We then calculated and compared the average scores for each soundscape overall.
Finally, for each listener, we created an average score versus time diagram for a specific soundscape and listening group. All of these were then used in calculating the overall average score versus time diagram. Figure 7a, 7b, 7c to 7d show these diagrams for all four soundscapes.
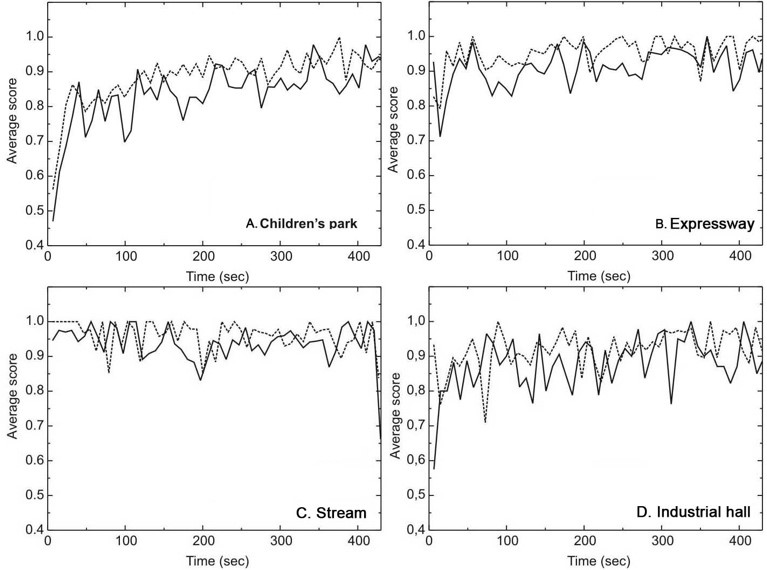 Figure 7. Average score versus time diagram for (the control group is presented with a dotted line and experimental group with a solid line): a) children’s park, b) expressway, c) stream and d) industrial hall
5. Research Results
The questionnaire responses describing the listeners’ assessment of the soundscapes showed that, in the majority of cases, annoyance can be assigned to loud sounds – mainly those louder than the main theme of the soundscape. Furthermore, a comparison between the experimental and control group soundscapes shows that, in general, loudness has the strongest influence on the annoyance factor. On the other hand, a more detailed analysis shows that significant loudness changes are not the only factor contributing to listeners’ distraction.
It is interesting to notice that when comparing two relatively loud soundscapes – the children’s park and industrial hall soundscapes, the percentage of listeners not bothered with any of the characteristic sound events was higher in the case of the loudest soundscape with artificial sounds – the industrial hall. Based on the content, the comparison of these two soundscapes shows that the louder sounds are much more varied in the former soundscape. Even though the industrial hall soundscape features a greater number of louder sounds, they are quite similar and consist mainly of the sound of power tools. In the case of the children’s park soundscape, individual sound events are much more varied in terms of frequency content, loudness distribution and rate of change.
In the case of the expressway soundscape, a larger percentage of listeners stated that nothing bothered them. This soundscape is in general quieter, but also consist mainly of the same sounds, with very narrow loudness distributions. In addition, fewer loud sounds differ from the main soundscape print in a way to annoy and distract the listeners.
The specific nature of the stream soundscape reflects in the longest period of the steadiness of the main theme. However, all the listeners in the experimental group reported some type of annoyance. Even though this soundscape features less sudden loudness changes than the previous three, these transitions are considerable in comparison with the steady part of the recording. Also, a large number of listeners in the control group stated that nothing bothered them which is in compliance with various studies in this field in terms of conclusion that people prefer the sound of water.
Upon careful examination of the game results, all the diagrams show a similar pattern (Figure7a, 7b, 7c and 7d). The average move score tends to slightly increase toward the end of the soundscapes. This effect is most evident in the children’s park soundscape. Moreover, the first moves for all listeners are most inaccurate, while the average scores tend to increase toward the end of the soundscape. The reasons for this are twofold: adaptation to the game environment and adaptation to the soundscape. Despite the fact that all the listeners played some type of a memory game prior to this testing and were therefore familiar with the pattern of the game, their initial moves were considerably less accurate than those made later in the game. The recorded average move time stabilized after the first few moves, and this can be attributed both to the adaptation to the game environment and adaptation to the soundscape factors. This effect is less obvious for soundscapes with smaller loudness change and for the control group soundscapes where loudness changes were intentionally lower, which is indicative of the importance of the occurrence of sudden and unexpected sounds.
Comparing the average score for all four soundscapes (see Table 2), the children’s park soundscape has the lowest average score, immediately followed by the industrial hall soundscape, expressway and stream soundscapes. There is an obvious difference for the experimental and control group soundscapes. As mentioned, soundscapes with lower loudness changes have lower distraction properties than those with higher loudness changes. This corresponds to the questionnaire results, where larger percentage of listeners of the control group soundscapes stated that nothing bothered them.
If we compare the average score with loudness diagrams for a specific soundscape, in some cases the lower score did not correspond to higher loudness change, as would be expected. Several other factors that affected a lower game score must be taken into consideration. For example, the time segment around the 100th second in the children’s park soundscape for the experimental group shows a lower average score even though there are no considerable loudness changes in this part of the soundscape. However, this interval features a short conversation which immediately distracted the majority of listeners. The same distraction pattern occurred whenever an indistinct conversation could be overheard in this soundscape. It seems that larger loudness changes in the form of children screaming did not distract the listeners playing the game as would be expected.
A similar example can be found in the industrial hall soundscape for the experimental group. Around the 300th second, a sound of a hammer could be heard in addition to that of power grinders. This sound stimulus proved to be unexpected and very distracting despite the fact that the main theme of the soundscape was louder (see Table 1). The sound of hammers was a high pitched sound of metal hitting metal, while the sound of power grinders was a constant noise. In the questionnaire, many of the listeners stated that the sound of hammers was the most annoying and disturbing in a generally loud soundscape.
As far as the expressway soundscape is concerned, the lower score can be attributed to the sounds of fast-passing cars which stood out from a generally noisy environment. In this case, there were no sudden and large loudness changes that would distract the listeners, thus the scores were relatively high.
Similarly, when it comes to the stream soundscape, lower results occurred at the moment of the dog’s first bark since this sound event was unexpected after a longer period of no loudness changes. After that, the listeners expected similar distracting sounds and, consequently, the scores were higher.
Table 2. The game results for the experimental and control groups
| Children’s park | Expressway | Industrial hall | Stream | |||||
| Group | EG | CG | EG | CG | EG | CG | EG | CG |
| Average score | 0.86 | 0.92 | 0.93 | 0.96 | 0.88 | 0.92 | 0.94 | 0.96 |
| Stand. deviation | 0.091 | 0.071 | 0.058 | 0.041 | 0.074 | 0.056 | 0.055 | 0.043 |
| The lowest score | 0.47 | 0.56 | 0.67 | 0.79 | 0.58 | 0.71 | 0.83 | 0.84 |
| N5 (sone) (7 min) |
8.1 | 6.1 | 8 | 6.5 | 10.5 | 8.1 | 9.5 | 6 |
6. Future Work
Taking into account the questionnaire and the game results, we can conclude that higher loudness in a certain soundscape is the most annoying factor. It determines general annoyance perception and influences the distraction features of a soundscape considerably. On the other hand, loudness is not the only distraction feature and other sound characteristics must be considered. After being exposed to sudden loudness changes, the listeners adapted, and the only remaining factors of distraction were the sounds perceived as different, unexpected or not corresponding to general soundscape characteristics.
Finally, we can conclude that the results of the testing showed that there is a sophisticated distinction between annoyance and distraction, and that these two terms should be distinguished from each other in the future. Further research on this topic should focus on determining in what way particular sounds differ from their background, as well as identifying the factors that influence human perception which defines these sounds as unexpected for a given soundscape.
One more way that we could proceed is preserving and/or creating ”silent places” within a certain urban soundscape. This research also showed that people prefer the sound of water. This can be a valuable information in soundscape studies in terms of masking the annoying soundscape with the soundscape that consist of water and natural sounds. We could also work on developing innovative design and materials: green spaces, green walls, water walls and other unrecognized ecosystem services.
7. Conclusion
In spite of adapting to a certain sound environment, providing it is not too loud, people still get distracted by unexpected sounds not ”belonging” to the main soundscape print. A soundscape may be loud but, at the same time, not perceived as such; whereas a somewhat different sound in that soundscape, no matter how short, could be the source of annoyance and the reason for distraction.
Finally, we can conclude that urban planning should include zoning requirements for new buildings and constructions, which would offer us the possibility for designing soundscapes.
Acoustic ecology is not just an interesting new aspect of urban studies. In our opinion soundscape designing will be one of the most important part for future city planning in a way to create sustainable and pleasant cities. Natural and water sounds in soundscape can be used as a tool when masking the undesirable sounds and soundscapes.
Conflict of Interest
The authors declare no conflict of interest.
Acknowledgment
This work has been supported by the European Union from European regional development fund (ERDF) under the project number KK.01.2.1.01.0103 Acoustical Camera (in Croatian: Akustička kamera).
- R. M. Schafer, Our Sonic Environment and the Soundscape: The Tuning of the World, Destiny Books, 1994.
- H. Fastl, S. Kerber, N. Guzsvány, ”Aspects of startling noises” in Proceedings of Euronoise 2009, Edinburgh, 2009. ISBN: 978-1-61567-680-4
- J. Vos, ”The Loudness of Impulse and Road-Traffic Sounds in the Presence of Masking Background Noise”, Acustica – Acta Acustica, 84(6), 1119-1130, 1998. ISSN 1610-1928
- B. Schulte-Fortkamp, A. Fiebig, ”Soundscape Analysis in a Residential Area: An Evaluation of Noise and People’s Mind”, Acta Acustica united with Acustica, 92(6), 875-880, 2006. ISSN 1610-1928
- B. Berglund and M. E. Nilsson, ”On a tool for measuring soundscape quality in urban residential areas”, Acta Acustica united with Acustica, 92(6), 938-944, 2006. ISSN 1610-1928
- J. Y. Jeon. P. J. Lee, J. You, J. Kang, ”Perceptual assessment of quality of urban soundscapes with combined noise sources and water sounds”, Journal of the Acoustical Society of America, 127, 1357-1366, 2010. https://doi.org/10.1121/1.3298437
- A. Torija, D. Ruiz, A. F. Ramos-Ridao, ”Application of a Methodology for Categorizing and Differentiating Urban Soundscapes Using Acoustical Descriptors and Semantic-Differential Attributes”, Journal of the Acoustical Society of America, 134, 791-802, 2012. https://doi.org/10.1121/1.4807804
- A. Ozcevik, Z. Yuksel Can, ”A Laboratory study on Evaluation of Soundscape”, in Proceedings of the Acoustics 2012, Nantes, France, 2012. https://hal.archives-ouvertes.fr/hal-00810900
- M. Suhanek, I. Djurek, ”Perception and Evaluation of Sudden Loudness Changes in Urban Soundscapes”, in Proceedings of the 5th Congress of the Alps Adria Acoustics Association 2012, Petrčane (Zadar), Croatia, 1-7, 2012. ISBN 978-953-95097-1-0
- E. E. Ryherd, L. M. Wang, ”The Effects of Noise from Building Mechanical Systems with Tonal Components on Human Performance and Perception”, ASHRAE Transactions, AB-10-018 (RP-1322), 2010. http://digitalcommons.unl.edu/archengfacpub/6
- L. M. Wang, ”Effects of Building Mechanical System Noise on Worker Performance and Perception”, in Proceedings of NOISE-CON 2010, 2010. http://digitalcommons.unl.edu/archengfacpub/6/
- M. Suhanek, I. Đurek, ”Implementation of Bipolar Adjectives pairs in Analysis of Urban Acoustic Environments”, Promet – Traffic & Transportation. 28 (5), 461-470, 2016. https://doi.org/10.7307/ptt.v28i5.2089
- E. Zwicker, ”Procedure for calculating loudness of temporally variable sounds”, Journal of the Acoustical Society of America, 62, 675-682, 1977. https://doi.org/10.1121/1.381580
- E. Zwicker, H. Fastl, Psychoacoustics: Facts and models, 2nd ed. Springer-Verlag, Berlin, Heidelberg, New York, p. 220, 1999.
- U. Widmann, ”A psychoacoustics annoyance concept for application in sound quality”, The Journal of the Acoustical Society of America 101, 3078 (1997); https://doi.org/10.1121/1.418779
- S. Viollon and C. Lavandier, ”Multidimensional Assessment of the Acoustic Quality of Urban Environments”, in Proceedings of Internoise, Nice, France, 2000. ISBN 2951561962, 9782951561960
- C. Semidor, ”Listening to a City With the Soundwalk Method”, Acta Acustica united with Acustica, 92(6), 959-964, 2006. ISSn 1610-1928
- http://www.m-audio.com/, 20.09.2013.
- G. Milas, Istraživačke metode u psihologiji i drugim društvenim znanostima (Research Methods in Psychology and other Social Sciences), Naklada Slap, p. 91-118, 153-216, 2009. ISBN 978-953-191-283-9
- M. Mejovšek, Metode znanstvenog istraživanja u društvenim i humanističkim znanostima (Methods of Scientific Research in Social Sciences and Humanities), Naklada Slap, p. 71-158, 2007. ISBN 953-191-342-3