
Vertical Accuracy Assessment of DSM from TerraSAR-X and DTM from Aerial Photogrammetry on Paddy Fields – Karawang, Indonesia
Volume 3, Issue 4, Page No 187-192, 2018
Author’s Name: Bambang Riadi1, Yustisi A. Lumban-Gaol1,a), Bimo Wicaksono2, Sekar Pranadita2
View Affiliations
1Geospatial Information Agency, Jalan Raya Jakarta-Bogor Km.46, Cibinong 16911, Indonesia
2University of Indonesia, Kampus Universitas Indonesia Depok, Depok 16424, Indonesia
a)Author to whom correspondence should be addressed. E-mail: yustisi.ardhitasari@big.go.id
Adv. Sci. Technol. Eng. Syst. J. 3(4), 187-192 (2018); ![]() DOI: 10.25046/aj030416
DOI: 10.25046/aj030416
Keywords: Accuracy, DSM, DTM, Check points, Stereo-plotting

Export Citations
A Digital Terrain Model (DTM) is a digital model representing the earth ‘s surface topography in three dimensions (3D) while a Digital Surface Model (DSM) represents the whole terrain including the objects on it such as trees and buildings. DTMs can be created through stereo-plotting. The advantage of this method is that the 3D data can be obtained with a high level of accuracy, but the data is limited in cloudy areas. This problem can be solved by using DSM, which can be created using TerraSAR-X and TanDEM-X Satellites with Synthetic Aperture Radar (SAR) system. This research aims to analyze the accuracy of DSMs from TerraSAR-X alongside DTMs extracted from aerial photogrammetry. The accuracy assessment of vertical height was completed by choosing 121 check points spread systematically on a paddy field in Karawang Regency, West Java. As paddy field was chosen to minimize errors between the DSM and DTM. The average, minimum, and maximum value of height differences between the DSM and DTM was calculated to obtain the standard deviation. The result showed that the average height difference between the DSM and DTM was 3.4 m with a minimum and maximum difference as 0.2 m and 10.808 m respectively. The standard deviation obtained was 4.9 m.
Received: 17 April 2018, Accepted: 25 July 2018, Published Online: 29 July 2018
1. Introduction
Spatial data acquisition technology from above the earth’s surface to obtain three-dimensional (3D) data can be completed using aerial photogrammetry and radar. The representation of topography on a specific reference system is generally related to Digital Terrain Models (DTMs). DTMs can be created with a terrestrial survey or remote sensing in areas where remote sensing is faster than a survey. Remote sensing technologies that can be used to produce data and information about the objects on the surface are aerial photogrammetry and radar. The height data model from those technologies will represent the DTM and the Digital Surface Model (DSM). DSMs represent the height of objects such as trees, buildings, ground level, and so on. This data is formed after orthorectification, a geometric correction process using satellite imagery to fix geometric errors related to topography, sensor geometry, and other factors. The height information is obtained for any point on the earth’s surface by calculating the phase difference received by the two antennas on the mission’s two satellites with X-band radar signals, such as TerraSAR-X or TanDEM-X [1]. DSM as one of height data model with grid spacing between 5-10 m is a digital earth surface model represented the earth surface height. The elevation model is based on a pair of stereo TerraSAR-X StripMaps with 3 m resolution. Then, the StripMaps are processed using the radargrametric technique by matching a homolog point from two images in the same area with different geometry [2]. The vertical accuracy value of an object showed the uncertainty of geometry of the height value on an object in the image towards an object which is considered correct in the actual position. The vertical accuracy of an object is the LE90 value, and it is based on a comparison between the height data values of a point that has been examined and is considered correct. Height value accuracy of any examined point should not fall below 90% [3].
The rapid development of technology for photogrammetry data processing, especially aerial photos, can fulfill several needs and purposes. DTMs provide information on the height of the earth’s surface in digital format (raster or vector) that shows the earth’s
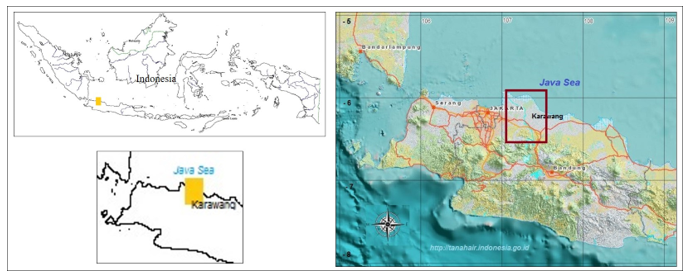 Figure 1. The location of Kerrawang Regency, West Java.
surface topography. Digital aerial photogrammetry is an advance tool used to build models of the earth’s surface that can produce high resolution DTMs by image matching automatically. Currently, acquisition technology uses digital cameras that provide direct, high-resolution images. The dimension of internal DTMs are measured in pixels and are related to the camera metrics quality, photo scale, flight height, Ground Sample Distance (GSD), surface morphology, vegetation, shadows, and atmospheric conditions. Digital photogrammetry can produce a 3D height point with high spatial resolution, and the image correlation method is applied to DTM extraction automatically. Standard procedure for producing DTM is based on basic steps consisting of internal orientation, external orientation, and point extraction.
Internal orientation aims to assign the position of the frame inside the camera to fix the distortion and set the known coordinate values on certain points. External orientation consists of two steps: relative orientation, and absolute orientation. Relative orientation is done to build a stereoscopic model. Automatic procedure for image processing and DTM extracting generates a high precision model in a very short time, which reduce manual editing. DTM accuracy is related to image quality and terrain features.
The accuracy level of TerraSAR-X along with spatial resolution is very high, and a DTM generated from TerraSAR-X is 90% accurate within a range of 9.75 m [4]. The same research was completed by Seferick et al. (2012) [5] and their results showed that the accuracy of DEM TerraSAR-X was between 8 to 10 m depending on a slope with an RMSEz value of approximately 2.5 m. The purpose of this research was to analyze the vertical accuracy of DTMs by comparing the vertical value of DSMs from TerraSAR-X with DTMs from aerial photos.
2. Materials and Method
2.1. Study area
This research was completed from July 2017 through November 2017 at Indonesia Geospatial Information Agency (BIG). This study is located in the Karawang Regency in the north part of the West Java Province. Geographically, it is located between Longitude 107o15’33” – 107o21’31” East and Latitude 6o13’32” – 6o21’36” South as is shown in Figure 1.
2.2. Materials and data used
The primary data used in this study consists of DTMs from aerial photos and DSMs from TerraSAR-X. The aerial data acquisition process including Ground Control Point (GCP) survey was not discussed in this article. Details of the materials used are provided in Table 1.
2.3. DTM Photogrammetry Process
Digital aerial photos from acquisition contain information about the camera, images, and external orientation (EO). Beforehand, premark was installed as a GCP so the control point could be captured in the images, which is very important in aerial triangulation. Global Positioning System (GPS) survey was done on each premark to obtain an accurate geo-reference point for image processing so that each image had a reference system in line with the needs of mapping the results. GCP was used to process data for geometric correction on mosaic orthophoto to produce a highly accurate map.
Table 1. DSM and aerial photogrammetry specification.
| Materials | Specifications |
| DSM TerraSAR-X in 2011, orthorectification | Resolution: 9 m |
| Aerial photogrammetry in November 2016 |
Leica RDC30 60MP 6 micron Ground sample distance 10 cm Flight height 1000-1300 m Photo scale 14000-16000 Overlap 65% Sidelap 30% |
Scale uniformity on each photo required several control points. Photogrammetric work covers a wide area which produces a lot of images, so the control points were with aerial triangulation. Aerial triangulation is a coordinate transformation from image to ground using GCP. Aerial triangulation was used to establish a direct relationship between the photo and ground coordinate systems without a relative and absolute orientation process [6].
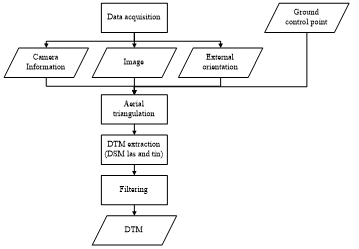 Figure 2. DTM photogrammetry flowchart.
The DTM photogrammetry was extracted from aerial photos after the aerial triangulation process using Inpho 5.4 to produce a DSM. After that, the DSM was filtered using software Terrasolid to obtain a DTM (Figure 2).
DTMs are used to describe terrain or relief models in 3D. DTMs depict actual shapes in the real world and is visualized using graphic computers and virtual reality technology [7]. The utilization of aerial photo techniques to produce 3D data has been heavily studied and is discussed in several publications. A discussion on the utilization of medium format cameras for producing 3D images was written by Warner et al. and used medium format Rollei 6006 cameras that could obtain a horizontal accuracy of 0.5 m and vertical accuracy of 1 m (1996) [8]. Currently, data acquisition and aerial photo processing uses the full digital system [9]. The provider and developer of photogrammetry software integrated data processing using AutoCAD and ArcGIS for vector data [6].
2.4. The determination of check points
Hereafter, the DTM from aerial photogrammetry was compared to the DSM from TerraSAR-X to find out the accuracy of the DSM. From the research location, an area was chosen to be an examination sample area. The sample area was a paddy field, based on the assumption that a paddy field is relatively flat. A DSM was examined directly without smoothing to eliminate spikes. The comparison between both elevation models was performed using the Combine/Compare Terrain Layers menu on Global Mapper with sample spacing matching the higher resolution, 0.5 m x 0.5 m.
The retrieval of sample points for examination (Figure 3) began by looking at the visual area of the paddy field, and a maximum limit of the coordinates was determined. From that boundary, the sample points were taken systematically with a range of 500 m between each point in either a north-south or east-west direction. This range was decided by assuming that each point represented the paddy field and was accurate enough to represent the elevation difference between DTM and DSM [10]. The selected points still had spikes or extreme values due to normal error. To reduce the effect of such error, any points with an elevation difference of more than 5.2 m were eliminated [3].
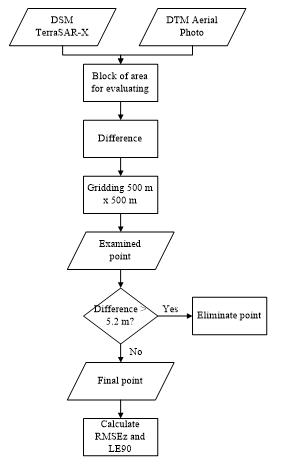 Figure 3. Statistic examined process for DSM and DTM.
The vertical accuracy of points was calculated using the RMSE (Root Mean Square Error) method from the difference between vertical values of a DSM TerraSAR-X and a DTM Aerial Photo on 90% confidence level. A total of 121 points were examined. RMSE and LE90 values were obtained from the equation below [11]:
RMSEz = √Σ(zDSM- zDTM) (1)
LE90 = 1.6499 x RMSEz (2)
where
zDSM : vertical value on the DSM
zDTM : vertical value on the DTM
RMSEz : RMSE on z (vertical)
LE90 : confidence level 90%
3. Results and Discussion
The accuracy information of orthorectification of the DSM TerraSAR-X from BIG was presented in Table 2. The difference between the DSM and the DTM of the sample area can be seen in Figure 6. and Table 3. A negative value indicates that the DSM TerraSAR-X elevation was lower than in the DTM aerial photo, while a positive value means the opposite. Then, the examined point was taken systematically on paddy field. The total number of examine point was 121 with range 500 m both directions, north to south and west to east (Figure 5). Based on statistical results from the examined points, the difference in maximum value was 10.8 m, minimum value was 0.2 m, and average value was 3.4 m. The RMSEz and LE90 values were 4.2 m and 6.9 m respectively.
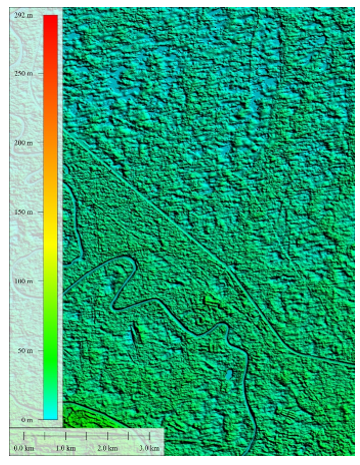 Figure 4. DSM TerraSAR-X elevation range.
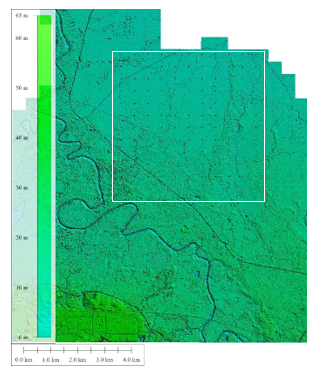 Figure 5. DTM aerial photogrammetry elevation range, white box was the examined area.
Table 2. DSM TerraSAR-X resolution.
| Image statistics | ICESat statistics | ||
| Min (m) | 0 | Nu. of points | 135 |
| Max (m) | 292 | RMSE (m) | 2.4 |
| Mean (m) | 41.6 | LE90 (m) | 5.4 |
| STD (m) | 35.9 | ||
From 121 examined points, there were 23 points with a difference greater than 5.2 m. After those points were eliminated, the RMSEz value become 2.9 m with LE90 4.9 m, which means the vertical accuracy value at a 90% confidence level was 4.9 m. This result fulfills the specification for a base map on a 1:25.000 scale class 1 in line with [1] BIG Regulation Nu. 15 Year 2014.
To see the form of a cross-section from the DTM and the DSM, a cross-section graphic analysis was done. The sample cross-section of a DEM can be seen in Figure 6.
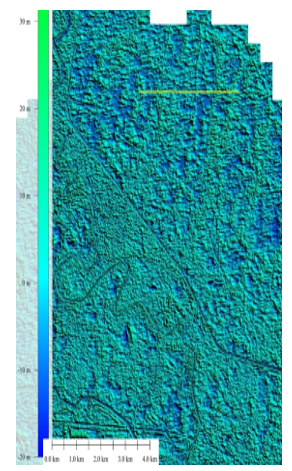 Figure 6. The elevation difference between DTM and DSM, yellow line was the sample for cross-section.
Table 3. The difference between DSM TerraSAR-X and DTM aerial photogrammetry.
| No | X | Y | Z | No | X | Y | Z | No | X | Y | Z | ||
| 1 | 754000 | 9308000 | -3.972 | 41 | 755500 | 9304500 | 3.894 | 81 | 757500 | 9306500 | -3.942 | ||
| 2 | 754000 | 9307500 | 0.376 | 42 | 755500 | 9304000 | -1.51 | 82 | 757500 | 9306000 | -8.44 | ||
| 3 | 754000 | 9307000 | 4.577 | 43 | 755500 | 9303500 | -0.161 | 83 | 757500 | 9305500 | -9.351 | ||
| 4 | 754000 | 9306500 | -3.641 | 44 | 755500 | 9303000 | 3.192 | 84 | 757500 | 9305000 | -10.808 | ||
| 5 | 754000 | 9306000 | -5.727 | 45 | 756000 | 9308000 | -4.453 | 85 | 757500 | 9304500 | -1.558 | ||
| 6 | 754000 | 9305500 | -8.806 | 46 | 756000 | 9307500 | 4.249 | 86 | 757500 | 9304000 | 0.576 | ||
| 7 | 754000 | 9305000 | 2.005 | 47 | 756000 | 9307000 | 3.477 | 87 | 757500 | 9303500 | -6.552 | ||
| 8 | 754000 | 9304500 | 7.152 | 48 | 756000 | 9306500 | 7.737 | 88 | 757500 | 9303000 | -0.257 | ||
| 9 | 754000 | 9304000 | 4.728 | 49 | 756000 | 9306000 | 4.026 | 89 | 758000 | 9308000 | 3.985 | ||
| 10 | 754000 | 9303500 | 1.038 | 50 | 756000 | 9305500 | 5.134 | 90 | 758000 | 9307500 | -6.659 | ||
| 11 | 754000 | 9303000 | -4.375 | 51 | 756000 | 9305000 | 2.249 | 91 | 758000 | 9307000 | -1.072 | ||
| 12 | 754500 | 9308000 | 0.472 | 52 | 756000 | 9304500 | -7.246 | 92 | 758000 | 9306500 | -1.328 | ||
| 13 | 754500 | 9307500 | -2.82 | 53 | 756000 | 9304000 | -3.047 | 93 | 758000 | 9306000 | 3.581 | ||
| 14 | 754500 | 9307000 | 0.155 | 54 | 756000 | 9303500 | -1.152 | 94 | 758000 | 9305500 | -1.052 | ||
| 15 | 754500 | 9306500 | 4.278 | 55 | 756000 | 9303000 | -7.689 | 95 | 758000 | 9305000 | 4.863 | ||
| 16 | 754500 | 9306000 | -9.396 | 56 | 756500 | 9308000 | -6.606 | 96 | 758000 | 9304500 | -0.42 | ||
| 17 | 754500 | 9305500 | -3.316 | 57 | 756500 | 9307500 | -6.262 | 97 | 758000 | 9304000 | 6.261 | ||
| 18 | 754500 | 9305000 | -6.891 | 58 | 756500 | 9307000 | 4.802 | 98 | 758000 | 9303500 | 4.378 | ||
| 19 | 754500 | 9304500 | 0.745 | 59 | 756500 | 9306500 | -0.775 | 99 | 758000 | 9303000 | -5.167 | ||
| 20 | 754500 | 9304000 | 0.248 | 60 | 756500 | 9306000 | 0.798 | 100 | 758500 | 9308000 | -2.864 | ||
| 21 | 754500 | 9303500 | -4.528 | 61 | 756500 | 9305500 | -4.061 | 101 | 758500 | 9307500 | 5.298 | ||
| 22 | 754500 | 9303000 | 0.661 | 62 | 756500 | 9305000 | -0.314 | 102 | 758500 | 9307000 | 3.358 | ||
| 23 | 755000 | 9308000 | -1.839 | 63 | 756500 | 9304500 | -3.851 | 103 | 758500 | 9306500 | 1.638 | ||
| 24 | 755000 | 9307500 | 4.869 | 64 | 756500 | 9304000 | 1.045 | 104 | 758500 | 9306000 | 4.5 | ||
| 25 | 755000 | 9307000 | 0.957 | 65 | 756500 | 9303500 | 4.311 | 105 | 758500 | 9305500 | 8.423 | ||
| 26 | 755000 | 9306500 | 3.702 | 66 | 756500 | 9303000 | -3.555 | 106 | 758500 | 9305000 | 0.763 | ||
| 27 | 755000 | 9306000 | 2.996 | 67 | 757000 | 9308000 | -2.406 | 107 | 758500 | 9304500 | 1.855 | ||
| 28 | 755000 | 9305500 | -1.624 | 68 | 757000 | 9307500 | 0.925 | 108 | 758500 | 9304000 | 4.613 | ||
| 29 | 755000 | 9305000 | 2.933 | 69 | 757000 | 9307000 | 3.056 | 109 | 758500 | 9303500 | 3.655 | ||
| 30 | 755000 | 9304500 | 1.499 | 70 | 757000 | 9306500 | 3.89 | 110 | 758500 | 9303000 | 3.465 | ||
| 31 | 755000 | 9304000 | 3.986 | 71 | 757000 | 9306000 | -7.521 | 111 | 759000 | 9308000 | 3.18 | ||
| 32 | 755000 | 9303500 | 3.635 | 72 | 757000 | 9305500 | -9.084 | 112 | 759000 | 9307500 | 0.357 | ||
| 33 | 755000 | 9303000 | 3.241 | 73 | 757000 | 9305000 | -2.893 | 113 | 759000 | 9307000 | 0.466 | ||
| 34 | 755500 | 9308000 | -4.334 | 74 | 757000 | 9304500 | -1.636 | 114 | 759000 | 9306500 | -3.496 | ||
| 35 | 755500 | 9307500 | 0.523 | 75 | 757000 | 9304000 | 4.002 | 115 | 759000 | 9306000 | -0.502 | ||
| 36 | 755500 | 9307000 | 0.482 | 76 | 757000 | 9303500 | -4.239 | 116 | 759000 | 9305500 | 3.17 | ||
| 37 | 755500 | 9306500 | -0.927 | 77 | 757000 | 9303000 | -2.274 | 117 | 759000 | 9305000 | -1.703 | ||
| 38 | 755500 | 9306000 | 1.573 | 78 | 757500 | 9308000 | 6.151 | 118 | 759000 | 9304500 | -7.686 | ||
| 39 | 755500 | 9305500 | -0.345 | 79 | 757500 | 9307500 | 5.917 | 119 | 759000 | 9304000 | -2.701 | ||
| 40 | 755500 | 9305000 | -1.809 | 80 | 757500 | 9307000 | -0.722 | 120 | 759000 | 9303500 | 0.876 | ||
| 121 | 759000 | 9303000 | -0.658 |
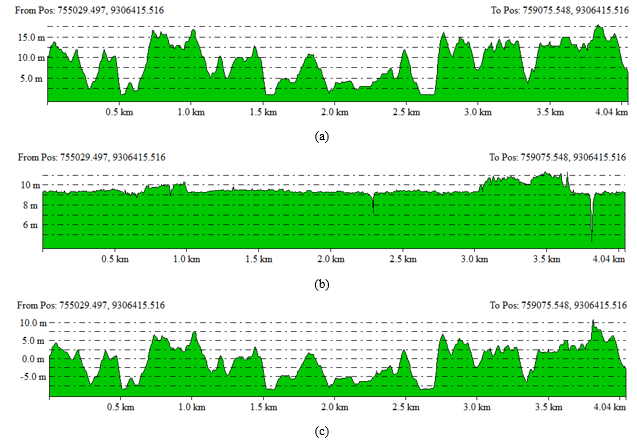 Figure 7. Cross-section of (a) DSM TerraSAR-X; (b) DTM aerial photogrammetry;
(c) The elevation differences between DSM and DTM.
Figure 7b above shows that the surface from a DTM aerial photo was relatively flat while on the DSM spikes were still occur (Figure 7a). Additionally, the DSM from TerraSAR-X was rougher than the DTM aerial photo because DSM has a lower spatial resolution. Smoothing the DMS using validated points can be done to eliminate spikes, but this step was not completed in this research. The elevation differences between DSM and DTM was seen in Figure 7c where the metrics value had already discussed before.
4. Conclusion
Until now, a DTM from aerial photography was the most ideal for finding basic data for topographic mapping. From this study, the vertical accuracy of a DSM TerraSAR-X was 4.9 m with an average value of 3.4 m and standard deviation of 2.9 m. This result leads to the conclusion that on a paddy or flat area, a DSM TerraSAR-X can also be used for situations that need high vertical accuracy.
Conflict of Interest
The authors declare no conflict of interest.
Acknowledgment
Thanks to the Geospatial Information Agency for data and equipment support for data processing of DSM TerraSAR-X and DTM photogrammetry, so this article can be resolved.
- Collins J., Riegler G., Schrader H., Tinz M., 2015. Applying Terrain and Hydrological Editing to TanDEM-X Data to Create a Consumer-ready WolrdDEM Product. 36th International Symposium on Remote Sensing of Environment, Berlin, Germany.
- Infoterra. 2010. TerraSAR-X Elevation DSM. Regional Digital Surface Models worldwide. E.info@infoterra-global.com.
- Prihanggo M, Geofana A, Mulyana AK. 2015. Uji Akurasi Ketelitian Vertikal DSM TerraSAR-X (studi kasus : Kota Banjarmasin dan Kota Palangkaraya). Prosiding Forum Ilmiah Tahunan Ikatan Surveyor Indonesia 2015.
- Susetyo, D.B., Syafiudin, M. F., Prasetyo, Y. 2017. DTM Generation from TerraSAR-X Using TIN Algorithm in Papua Island, Indonesia. ISPRS Hannover Workshop, Germany.
- Seferick, U. G., Schunert, A., Soergel, U., Watanabe, K. 2012. Validation of DEMs Derived from High Resolution SAR Data: A Case Study on Barcelona. XXII ISPRS Congress, Melbourne, Australia.
- Pranadita S and Harintaka. 2013. Digital Elevation Model Development from Interactive Stereo-plotting of Medium Format Aerial Photo Using DiiCam Camera. Jurnal Ilmiah Geomatika Vol. 19 No.2, Desember 2013.
- Fabris, M and Pesci, A. 2005. Automated DEM extraction in digital aerial photogrammetry: precisions and validation or mass movement monitoring. Annals of Geophysics, Vol. 48, N. 6, December 2005.
- Warner WS, Graham RW, Read RE. 1996. Small Format Aerial Photography. ISBN 1-870325-5-7, Whittles Publishing. Scotland, UK.
- Höhle, J. 2011. DEM Generation by Means of New Digital Aerial Cameras. International Archives of Photogrammetry, Remote Sensing and Spatial Information Sciences 38 (3/W22).
- Karabork, H., Yildiz, F., Coskun, E., a, Yilmaz, H.M., Yakar, M. 2007. Investigation of Accuracy for Digital Elevation Models Generated With Different Methods In Photogrammetry. Engineering Faculty, 42031 Kampus-Konya, Turkey.
- Badan Informasi Geospasial. 2014. Peraturan Kepala Badan Informasi Geospasial tentang Pedoman Teknis Ketelitian Peta Dasar. Nomor 15 Tahun 2014.