Acoustic Signal Processing and Noise Characterization Theory via Energy Conversion in a PV Solar Wall Device with Ventilation through a Room

Adv. Sci. Technol. Eng. Syst. J. 3(4), 130–172 (2018);
 DOI: 10.25046/aj030414
Noise defined as ‘a sensation of unwanted intensity of a wave’, is perception of a pollutant and a type of environmental stressor. The unwanted intensity of a wave is a propagation of noise due to transmission of waves (viz. physical agents) such as light, sound, heat, electricity, fluid and fire. The characterization of noise interference, due to power difference of two intensities in a wave is presented. Noise interference characterization in a wave is obtained depending on type of wave. Standard definitions of noise sources, their measurement equations, their units and their origins under limiting reference conditions are derived. All types of wave form one positive power cycle and one negative power cycle. The positive and negative noise scales and their units are devised depending on speed of noise interference in a wave. A numerical and experimental study was conducted for supporting the noise characterization theory via ascertainment of energy conversion characteristics of a pair of photovoltaic (PV) modules integrated with solar wall of an outdoor test-room. A pre-fabricated outdoor room was setup for conducting outdoor experiments on a PV solar wall with ventilation through the outdoor room. Acoustic signal processing is supported with some experimental and numerical results of a parallel plate PV solar wall device installed in an outdoor test-room to authenticate the noise interference equations. Detailed discussions on noise characterization theory along with some examples of noise filter systems as per noise sources are also presented. The noise characterization theory is also exemplified with some noise unit calculations using presented noise measurement equations.
1. Introduction
The aim of this paper is to present acoustic signal processing and noise characterization theory with support of energy conversion models and experiments on a photovoltaic (PV) solar wall with ventilation through a room. This paper is an extension of work originally presented in conference [1, 2].
Noise, defined as ‘a sensation of unwanted intensity of a wave’, is perception of a pollutant and a type of environmental stressor. An environmental stressor such as noise may have detrimental effects on various aspects of health. The unwanted intensity of a wave is a propagation of noise due to transmission of waves (viz. physical agents) such as light, sound, heat, electricity, fluid and fire [1]. A unified theory for stresses and oscillations is applicable so as to take into effect of all the physical agents as an environmental stressor on a human body [3]. As per the theory, the stresses acted on a particle due to interaction of many forces are distinguished as fundamental, internal and external stresses. The existence of fundamental stresses is due to presence of electromagnetic and gravitational forces. The internal stresses are acted under the influence of fundamental stresses and are constituted by composition and properties of a particle. The external stresses are acted under the existence of an external source of energy.
Solar energy conversion occurs at solar cells and solar intensity of incident solar energy is converted into electric power and waste heat. The photovoltaic devices with ventilation provide means for converting waste heat lost to surrounding environment into useful thermal power [2-7]. The composite waves are transmitted in photovoltaic (PV) devices due to stresses and oscillations of incident solar and ventilation energy. In this way solar power intensity is converted into heat, fluid, electricity, light, sound and fire depending on intensities of its transmitted composite waves in a PV solar wall device.
1.1. Methodology
This paper has summarized the concept of acoustic signal processing and noise characterization theory with aid of energy conversion in a PV solar wall device. Basic definitions on noise characterization are presented in Appendix. Sources of noise are characterized as per physiological responses from human senses. Definitions of various types of noise as per type and speed of wave are presented. Noise measurement equations are deduced from the wave theory. Acoustic or noise filters as per source of various power systems are defined and illustrated with examples. Experimental results on energy conversion are presented on a PV solar wall device. Sensible heat storage capacity and thermal storage capacities are explained for their energy conversion phenomenon.
Some numerical results are also presented to support the noise characterization. In order to further authenticate the noise wave characterization, signal processing is achieved from a PV device composed of RC analogue signal. Acoustic signal processing is supported with some experimental and numerical results of a parallel plate PV solar wall device installed in an outdoor test-room for verification of the noise interference equations. Some noise unit calculations deduced from the numerical model based on newly devised noise measurement equations are also presented in tables. Detailed discussions are also presented on significance of noise characterization theory for: i) cities; ii) acoustics; iii) electrical engineering, instrumentation & control; iv) energy conversion in engines; v) noise pollution and control; vi) fire alarm systems; vii) operation of power systems; viii) friction & oscillations; ix) noise instrumentation; x) automatic control & management in noise systems; xi) potential research themes and graduate teaching subjects.
The following sections define and describe ‘noise’, its sources, its measurement equations with support of experimental and numerical results of a PV solar wall device with ventilation through a room. Discussions of noise characterization theory on solar energy acoustics, energy conversion model and experiments, acoustic signal processing, noise filters & their examples with description of sensors & transducers for a human brain along with human comfort & health are presented in later sections.
2. Noise Characterization
2.1. Source & Sink of Noise
The strength of a source is defined as total energy flow per unit time and unit length of line. A line which is drawn hypothetically perpendicular to the plane, from which energy is assumed to flow uniformly in all directions at normal angles to it, is defined as a source. It acts as a point in the usual two-dimensional energy flow diagram. The flow is in imaginary radial lines from the source, the current of energy flow is at a distance r from the source. The current is determined by the strength divided by the energy flow area [8-10].
2.2. Psychoacoustics in New Dimensions
The standard sources of noise along with their definitions, their measurement equations and measurement units are presented. A contemporary theory of psychoacoustics was presented for characterization of interference of noise waves due to difference of power of two intensities [11]. The difference of two intensities of power is due to transmission of heat, fluid, light, electricity, fire and sound into a particle body. The sources of noise are classified according to the type of wave of interference. The various types of noise are defined with factors of speed of wave, areas of energy stored in a wave, due to interference and difference of power between two intensities of wave. Noise filters as per source of noise signals from noise power systems are differentiated for filtering unwanted frequencies from solar power, electric power, light power, sound power, heat power, fluid power and fire power.
The interference of noise arises due to difference of power of two intensities [1-13]. The intensity of power for any particle body is a function of development of various stresses. The phenomenon of acoustic resonance arises due to matching of critical stress level with the natural stress level necessary for oscillation of a particle body. The criteria for generation of acoustic resonance include waves propagated with transmission of light, sound, noise, heat, electricity, fluid and fire from a particle body. The psychological feeling of sensation and perception of noise from light, sound, heat, electricity, fluid and fire is a physiological response from the sensory organs of a standard (average) human body.
3. Sources of Noise
The sources of noise are classified according to the type of wave of interference:
Light: In the electromagnetic radiation wavelength band from approximately between 380-765 nm, the visual sensation of light is tested by the eye of an observer with seeing of a radiant energy. The physiological response from an average eye defines units of light. The sensitivity of human eye is not same in all wavelengths or colors. The contribution of adding daylight is visual sensation in the visible region of the solar energy spectrum.
Sound: In the range of frequencies between 20 Hz and 20,000 Hz, the sound is evaluated due to presence of fluid pressure energy as a hearing sensation by the ear. The sound units are based on the functional feedback of an average ear. The sensitivity of sound to the whole frequency band is not same for human ear.
Heat: In the electromagnetic radiation between 0.1 μm to 100 μm, the heat as a temperature sensation is examined by the human body. The sensation function of temperature defines units of heat. The temperature sensation function is a measure of coldness and hotness. The comfort zone of temperature is evaluated from functional feedback of a human body which also defines thermal comfort. The contribution to discomfort of human body is in the ultra violet region of solar energy spectrum.
Electricity: With passing of direct current or an alternating current, the electricity as a shock sensation is evaluated by skin of an observer due to electromagnetic energy stored in a conductor which is short-circuited by a human body.
Fluid: The fluid as combined ventilation and breathing sensation is evaluated by amount of fluid passed either externally or internally through a standard (average) human body.
Fire: The exposure of radiant energy and fluid acting on skin surface of an average human body, defines the fire as a sensation of burning.
4. Noise Measurement Equations
The following standard measurement equations are derived and adopted from the standard definitions for sources of noise interference as mentioned in Appendix.
Noise of Sol: For a pack of solar energy wave, the multiplication of solar power storage and the velocity of light gives solar power intensity I. On taking logarithm of two intensities of solar power, I1 and I2, provides intensity difference. It is mathematically expressed as:
![]() Whereas logarithmic unit ratio for noise of sol is expressed as Sol. The oncisol (oS) is more convenient for solar power systems. The mathematical expression by the following equality gives an oncisol (oS), which is 1/11th unit of a Sol:
Whereas logarithmic unit ratio for noise of sol is expressed as Sol. The oncisol (oS) is more convenient for solar power systems. The mathematical expression by the following equality gives an oncisol (oS), which is 1/11th unit of a Sol:
![]() Noise of Therm: For a pack of heat energy wave, the multiplication of total power storage and the velocity of light gives heat power intensity I. The pack of solar energy wave and heat energy wave (for same intensity I), have same energy areas, therefore their units of noise are same as Sol.
Noise of Therm: For a pack of heat energy wave, the multiplication of total power storage and the velocity of light gives heat power intensity I. The pack of solar energy wave and heat energy wave (for same intensity I), have same energy areas, therefore their units of noise are same as Sol.
Noise of Photons: For a pack of light energy beam, the multiplication of total power storage and the velocity of light gives light power intensity I. The pack of solar energy wave and light energy beam (for same intensity I), have same energy areas, therefore their units of noise are same as Sol.
Noise of Electrons: For a pack of electricity wave, the multiplication of total electrical storage and the velocity of light gives electrical power intensity I. The pack of solar energy wave and electricity wave (for same intensity I), have same energy areas, therefore their units of noise are same as Sol.
Noise of Scattering: For a pack of fluid energy wave, the multiplication of total power storage and the velocity of fluid gives fluid power intensity I. On taking logarithm of two intensities of fluid power, I1 and I2, provides intensity difference. It is mathematically expressed as:
![]() Whereas, logarithmic unit ratio for noise of scattering is Sip. The oncisip (oS) is more convenient for fluid power systems.
Whereas, logarithmic unit ratio for noise of scattering is Sip. The oncisip (oS) is more convenient for fluid power systems.
The mathematical expression by the following equality gives an oncisip (oS), which is 1/11th unit of a Sip:
![]() For energy area determination of a fluid wave, the water with a specific gravity of 1.0 is the standard fluid considered with power of ±1 Wm-2 for reference intensity I2.
For energy area determination of a fluid wave, the water with a specific gravity of 1.0 is the standard fluid considered with power of ±1 Wm-2 for reference intensity I2.
Noise of Scattering and Lightning: For a pack of fire wave, the intensity I, of fire flash with power of light, is the multiplication of total power storage and the velocity of light. Whereas for a pack of fire wave, the intensity, I, of fire flash with power of fluid, is the multiplication of total power storage capacity and velocity of fluid.
- For a noise due to fire flash, the collective effect of scattering and lightning is to be obtained by superimposition principle.
- For same intensity I, the pack of solar energy wave and a fire flash with light power have same energy areas, therefore their units of noise are same as Sol. The therm power may also be included in fire flash with power of light.
- For same intensity I, the pack of fluid energy wave and a fire flash with fluid power have same energy areas, therefore their units of noise are same as Sip. In determining the areas of energy for the case of fluids other than water, a multiplication factor in specific gravity of fluid is to be considered.
Noise of Elasticity: For a pack of sound energy wave, the product of total power storage and the velocity of sound gives sound power intensity I. On taking logarithm of two intensities of sound power, I1 and I2, provides intensity difference. It is mathematically expressed as:
![]() Whereas, logarithmic unit ratio for noise of elasticity is Bel. The oncibel (oB) is more convenient for sound power systems. The mathematical expression by the following equality gives an oncibel (oB), which is 1/11th unit of a Bel:
Whereas, logarithmic unit ratio for noise of elasticity is Bel. The oncibel (oB) is more convenient for sound power systems. The mathematical expression by the following equality gives an oncibel (oB), which is 1/11th unit of a Bel:
 4.1. Limiting Conditions
The Table 1 summarises units of noise and their limiting conditions.
Table 1: Noise under Limiting Conditions
| Referencea
(I2 = ±1 Wm-2) |
Noise Scales and limiting Conditions | ||
| Noise of Sol | Noise of Scattering | Noise of Elasticity | |
| Units | Sol | Sip | Bel |
| I1 = 1 Wm-2 | No Positive Solar Energy | No Positive Fluid Energy | No Positive Sound Energy |
| I1 = 1+→0 Wm-2 | Decreasing Solar Energy | Decreasing Fluid Energy | Decreasing Sound Energy |
| I1= + ve | Increasing Solar Energy | Increasing Fluid Energy | Increasing Sound Energy |
| I1 = -1 Wm-2 | Negative Solar Energy | Negative Fluid Energy | Negative Sound Energy |
| Darkness | Low Pressure | Inaudible range | |
| I1 = -ve | Darkness increasing, distance from point source of light increasing | Low pressure increasing, vacuum approaching | Inaudible range increasing, vacuum approaching |
| I1 = -1+→0 Wm-2 | Negative Solar Energy | Negative Fluid Energy | Negative Sound Energy |
| Decreasing Darkness | Decreasing Low Pressure | Decreasing inaudible range | |
| * Reference value of I2 = ±1 Wm-2 signifies the limiting condition with areas of noise interference approaching to zero. | |||
There are following elaborative points on choosing an onci as 1/11th unit of noise [1]:
- Reference value used for I2 is -1 W m-2 on positive scale of noise and 1 W m-2 on negative scale of noise. In a power cycle, all types of wave form one positive power cycle and one negative power cycle (see Figure 10). Positive scale of noise has 10 positive units and one negative unit. Whereas, negative scale of noise has 1 positive unit and 10 negative units;
- Each unit of sol, sip and bel is divided into 11 parts, 1 part is 1/11th unit of noise;
- The base of logarithm used in noise measurement equations is 11;
- Reference value of I2 is -1 W m-2 with I1 on positive scale of noise, should be taken with negative noise measurement expression (see Eqs 2, 4 and 6), therefore it gives positive values of noise;
- Reference value of I2 is 1 W m-2 with I1 on negative scale of noise, should be taken with positive noise measurement expression (see Eqs 2, 4 and 6), therefore it gives negative values of noise.
5. Noise Filters
The noise filters are classified as per source signal of unwanted frequencies from solar power, electric power, light power, sound power, heat power, fluid power and fire power. An acoustic filter is an electrical analog circuit of various combinations of RC feedback circuit with an operational amplifier and is used to filter unwanted frequencies of oscillations from a power system [14]. It is a network with selective transmission for currents from a power system of varying frequency. The unwanted frequencies generated from a power system are removed by using an operational amplifier with different combination of filter arrangements. An operational amplifier is an integrated circuit that consists of several bipolar transistors, resistors, diodes, and capacitors, interconnected so that amplification can be achieved over a wide range of frequencies [15].
The action of filtering the frequency from a power system is based on the variation in the reactance of an inductance or a capacitance with change in frequency. The band of frequencies that can be removed from a power system can be at the low frequency end of frequency spectrum, at the high frequency end, at both ends, or in the middle of the spectrum. The filters to perform each of these operations are known respectively as low-pass filters, high-pass filters, band-pass filters and band-stop filters. There are many configurations of design of filters. The filters are divided into passive and active configurations. The passive filters are less effective simple circuits constructed with resistors, capacitors, and inductors. The active filters are useful in providing an effective filtering action than passive filters. The active filters require a source of operating power.
5.1. Noise Filter Systems
The criteria for definitions of filters for noise filtering is based on areas of energy stored in a wave due to noise interference, speed of wave and difference of power between two intensities of wave. The filtered noise signals are considered from systems of solar power, electric power, light power, sound power, heat power, fluid power and fire power. The noise filters as per sources of noise are defined as follows:
Filter for noise of sol: This filter is used to filter noise due to difference of power intensities between two solar power systems. Example: window curtain, window blind, wall and glass.
Filter for noise of therm: This filter is used to filter noise due to difference of power intensities between two heat power systems. Example: house, insulation, clothing and furnace.
Filter for noise of photons: This filter is used to filter noise due to difference of power intensities between two light power systems. Example: 3-D vision of any object, electric bulb, television, computer and LCD screen laptop.
Filter for noise of electrons: This filter is used to filter noise due to difference of power intensities between two electrical power systems. Example: AM/FM radio clock with ear phones, telephone instrument with ear phones and CD audio player with ear phones.
Filter for noise of scattering: This filter is used to filter noise due to difference of power intensities between two fluid power systems. Example: electric fan, pump, motor vehicle, river stream and tap water.
Filter for noise of scattering and lightning: This filter is used to filter noise due to difference of power intensities between two fire power systems. Example: lighter, matchstick, gas stove, locomotive engine and thunder-bolt.
Filter for noise of elasticity: This filter is used to filter noise due to difference of power intensities between two sound power systems. Example: your vocal apparatus, organ pipe, thunder-bolt and drum beats.
6. Some Examples of Noise Filters
Some examples of noise filters are enumerated as under.
6.1. Human Voice Production
The example of phonetics of filtering sound of a human speech is illustrated. The human speech is synthesized due to development of stresses at vocal folds [16-17]. The smoothening of the sound is function of its amplitude and its shape of oscillations at vocal tract of a human being. The vocal tract is a resonant cavity wall with sound energy stored in oscillations of its vocal folds. The vocal chords showing mechanism of synthesis of human speech is illustrated in Figure 1.
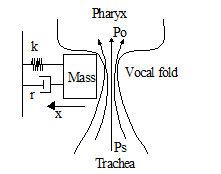 Figure 1: A human vocal mechanism
6.2. An Airflow Window with a Photovoltaic Solar Wall
The filtering of solar energy is illustrated through an example of an airflow window attached with a shading device. An airflow window is fixed with a movable roller blind to control the transmission of daylight as well as amount of solar heat. The bottom portion of photovoltaic solar wall is used for controlling the amount of air ventilation along with generation of solar electric power. The example is illustrated in Figure 2.
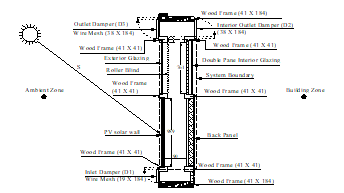 Figure 2: An Airflow window with a Photovoltaic Solar Wall (Dimensions shown are in mm).
6.3. Psychrometric Air Conditioner
An elementary air conditioner for summer comfort conditioning consists of a cooling coil, a cooling fluid with a filter [18]. The schematic of operation of a psychrometric air conditioner is illustrated in Figure 3.
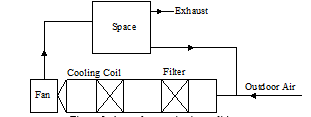 Figure 3. A psychrometric air conditioner
6.4. Telephone Line
The impedance of a telephone line is composed of distributed resistance, capacitance, and inductance [19]. The impedance of telephone line is proportional to the insulation, loop length and whether the wire is buried, aerial or bare parallel wires strung on telephone pole. A telephone line is usually supplied with a 48 VDC from the telephone exchange. The schematic of operation of a telephone line with telephone instrument is illustrated in Figure 4.
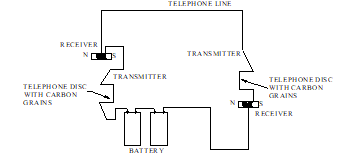 Figure 4: Operation of a Telephone Line.
6.5. Fire and Smoke Detection System
A fire detection system consists of a control system with interconnected alarms, smoke and heat detectors. A fire detector is a device which is used for presetting an alarm at a particular temperature. A smoke detector is a device which is used for presetting an alarm when a certain percentage of smoke accumulates. The photovoltaic cell activates the smoke alarm only if it senses requisite obscuration of light over a unit area with control from BMS [20]. The schematic of various components for fire detection system is illustrated in Figure 5. The detail description of a fire alarm systems is provided later in discussions.
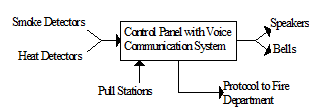 Figure 5: A fire detection system
7. Experiments
Many studies on facade integrated PV system are focused on the model simulation of radiation and convection [21-36]. Kim and Kim [28] compared three different types of integrated PV-thermal system configurations. The study analyzed the system performance as well as the building performance. Various researchers [29-30] have also conducted research on the energy performance and efficiency of actively air cooled PV modules integrated into facades.
In the present study, the salient feature of a pair of PV modules used in solar wall was the glass coating surrounding the semiconductor material of solar cells [24-25]. The manufacturing of glass coated PV modules was based on multi-crystalline solar cell technology. The operating conditions were selected for conducting various experiments on a PV solar wall. The indoor solar simulator tests were conducted for PV modules under standard operating conditions. The outdoor tests were conducted under available climatic conditions for obtaining temperatures, air velocities, thermal time constants, heat capacity, and thermal storage capacity of a PV solar wall. The PV modules used for experiments were having a glass coating of 3 mm attached on its exterior and interior sides. The glass coating was attached to exterior and interior sides of PV modules in the form of glass sheets by a double-glass (PWX) manufacturing technology. Each PV module was having 36 multi-crystalline solar cell units, with thin transparent gaps in between them. The glass coating on PV modules has improved the overall performance of PV modules in many ways; it has: i) protected semi-conductor material from weather deterioration; ii) absorbed ultra violet rays of solar energy and trap solar heat in glass coating, thus increasing the temperature of the surrounding environment; iii) reduced the reflection losses of sunlight rays reflected from PV module; iv) improved the aesthetic appearance of PV module; v) increased the thermal mass of PV module; and vi) enhanced the structural strength of PV module. The pictorial view of glass coated PV module used in experiments is illustrated in Figure 6. The typical characteristics of glass coated PV module without frame were: dimensions of 993 mm by 453 mm and a thickness of 6.2 mm with glass coating, typical current of 2.8 A, typical voltage of 17 V, temperature coefficients of current and voltage were + 0.034 %/°C and -2.17 mV/°C/solar cell at standard test conditions [2, 24].
 Figure 6: Glass coated PV module used in experiments
The indoor measurement tests were carried out in an indoor simulation test facility of CANMET Energy Technology Centre of Natural Resources, Varennes, Québec, Canada [2]. The schematic of indoor solar simulator used for establishing characteristics of glass coated PV modules is illustrated in Figure 7.
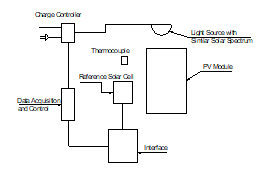 Figure 7 Block diagram of an indoor solar simulator
The current-voltage and power-voltage characteristics of one of the PV modules are shown in Figs. 8 and 9 [2]. Table 2 has presented characteristics of a pair of PV modules established with an indoor solar simulator [2]. As presented in Table 2, electrical conversion efficiency to the order of 8.9% was reported from indoor simulator tests. The current-voltage and power-voltage characteristics of tested PV module are illustrated in Figs. 8 and 9.
Table 2: Characteristics of glass coated pv modules established with an indoor solar simulator
| PV
Module |
Solar Intensity
(Wm-2) |
Spectrum | Isc
(A) |
Voc
(V) |
| PW30 | 1009.11 | 1.5 A.M.
Class B |
2.833 | 21.296 |
| PW31 | 1007.58 | 1.5 A.M.
Class B |
2.829 | 21.352 |
| PV
Module |
Vmax
(V) |
Pmax
(Watts) |
Fill factor | Efficiency
(%) |
| PW30 | 16.198 | 42.157 | 0.6985 | 8.703 |
| PW31 | 16.503 | 43.435 | 0.7188 | 8.981 |
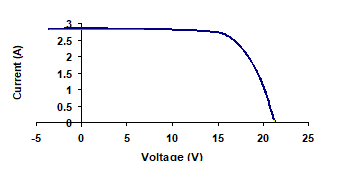 Figure 8: Current-voltage characteristics of PW30
After determining current-voltage and power-voltage characteristics from an indoor solar simulator, the pair of glass coated PV modules was installed in the test section of an outdoor test-room. The outdoor experiments were conducted on PV modules in order to determine energy conversion characteristics and further improving the overall performance of PV modules by using thermal mass of an outdoor room.
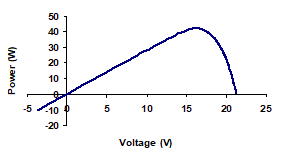 Figure 9: Power-voltage characteristics of PW30
The outdoor room was a pre-fabricated structure that was delivered into the premises of Concordia University in Montréal, Québec, Canada for conducting experiments on glass coated PV modules [2]. The test section with vertical PV modules, was aligned 10° East of South for receiving maximum solar radiation between 8.00 and 14.00 hrs solar time and also avoiding shading from adjacent buildings. The schematic of an outdoor room used for conducting outdoor experiments is illustrated in Figure 10. The outdoor experiments were conducted on a solar wall section built with two commercially available glass coated PV modules, an air passage with gap width of 90 mm, an insulating panel, side walls made up of Plexiglas and connected wooden frames. The insulation panel was assembled with 7 mm thick plywood board enclosure filled with 26 mm polystyrene. The steady state average resistance of the composite plywood board-polystyrene section of insulation panel obtained from the heat flow meter test was 1.0 m2 °C W-1 [2]. The side wall of wooden frame was fixed with Plexiglas of thickness 12 mm (k = 0.1316 W m-1 K-1) placed perpendicularly facing air-gap for view of the air passage from inside the test room.
A series electrical circuit connection was established for a pair of vertical PV modules installed on a solar wall for determining the current-voltage measurements and electric power output. The electrical circuit for two PV modules connected in series for generation of electric power with a rheostat of maximum varying resistance up to 50 Ω is illustrated in Figure 11. A circular variable resistor of 50 Ω was a wire-wound coil with a sliding contact that was used to vary electrical resistance without interrupting the current. The Joule heating at a rate of 73 cal/s (305 W) was predictable at a typical current rating of 2.8 A for a PV module. The null resistance of rheostat was calculated to be 39 Ω at a current of 2.8 A, which was not having any potential difference across it. In Figure 6, the sliding contact of rheostat has a resistance of Rs, with a current (i= Vr/Rs) flowing across the circuit; Vr is potential difference across the resistance, Rs.
The passive air ventilation was created in the PV module test section by natural wind or through buoyancy effect in the absence of wind. The active fan pressure was used to achieve higher air velocities by operation of the exhaust fan fixed on opposite façade with respect to the PV test section. The slight negative pressure was induced for drawing low air velocities in absence of wind-induced pressure from the inlet damper into the PV test section through the outdoor room. The exhaust ventilation fan was rated at 270 CFM (ft3/min) (0.127 m3 s-1) at standard atmospheric pressure so as to create between 10-25 Pa of negative pressure depending on the air leakage from the outdoor room.
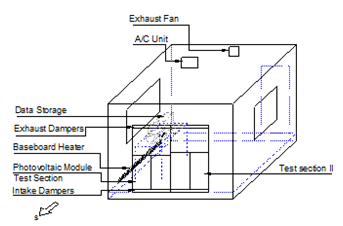 Figure 10: Schematic of a pre-fabricated outdoor room with PV solar wall test section
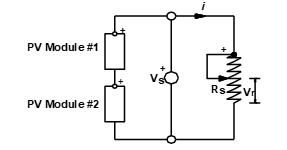 Figure 11: Electric circuit for PV modules
The air velocities near the exit of PV modules were obtained both as a measure of buoyancy and fan induced hybrid ventilation. The fan pressure was created with an exhaust fan fixed on wall of an outdoor room opposite to wall with a wooden frame installed with glass coated PV modules. The air velocity sensor was placed perpendicular to the walls of the PV solar wall section for measuring axial air velocities near its outlet.
In order to minimize boundary layer effect in air velocity measurement, air velocity sensor was placed at middle air-gap width at a distance of 45 mm from either of the walls of the PV solar wall. To minimize turbulence effects in air velocity measurement, air velocity sensor was placed near the outlet (at 1100 mm from the bottom) of the PV test section with total air passage length of 2100 mm in the test section. To minimize three-dimensional effect in air velocities, fan-induced active ventilation was achieved by developing air velocities by the induced draft fan fixed on the opposite wall so that it was placed at a distance from the walls of PV module test section. It was validated by one of the experiments that measured surface temperatures of the two adjacent glass coated PV modules were within ±0.5 °C under similar operating conditions.
7.1. Outdoor Measurements
Three thermocouple sensors were placed at the top, middle, and bottom locations in the PV module, air-passage, and insulating panel. They were used to measure their local temperatures at their defined fixed positions. Two thermocouples were used to measure the inside test room air temperature and ambient air temperature. One differential thermocouple was used to check the air temperature difference between top and bottom sections of the PV module test section. The thermocouple outputs, current, voltage, solar irradiation, and air velocity signals were connected to a data logger and a computer for data storage. The copper-constantan junction (T-type) thermocouples were used for measurements for generating voltage signals to the data logger. As mentioned earlier, the air velocity sensor (make-Dwyer instruments, model no. 640-0) was used to collect air velocity measurements. The solar intensity measurements were collected with a photometer sensor fixed on the south wall of an outdoor room. The schematic of outdoor experimental apparatus for a PV solar wall device is illustrated in Figure 12.
7.2. Temperature Plots
The measurements collected from the sensors were recorded in a data logger as a function of air velocities through a PV solar wall for the cases of passive ventilation and active ventilation with use of fan pressure. Similarly, temperature measurements were obtained from the PV solar wall section as a function of air velocities. The temperatures for PV module, air passage, and insulating panel in the PV solar wall were obtained. The sample measurements obtained from outdoor experimental setup are presented in Table 3.
The temperature plots for PV module, insulating panel, and air for different conditions of ventilation are illustrated in Figs. 13 and 14. The temperature plots with respect to height of a PV solar wall for the data provided in Tables 3 to 5 are obtained. The variation of mean temperatures of PV module, insulating panel, and air in a PV solar wall with approximately steady solar noon irradiation with varying air velocities for the case of active ventilation and passive ventilation are illustrated in Figs. 15 to 16. Temperature differences for various cases of ventilation are provided in Figure 17(a) and 17 (b).
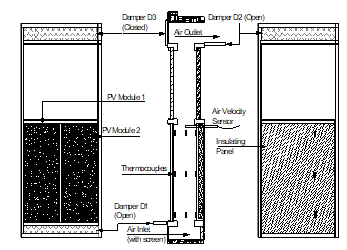 Figure 12: Schematic of outdoor experimental apparatus for a PV solar wall installed on a wooden frame
7.3. Sensible Heat Storage Capacity
The PV solar wall test section with wooden frame was composed of non-homogeneous materials having different densities, specific heats, and thicknesses. The pair of PV modules was fixed with three layers of material, viz. a flat sheet of solar cells, glass sheets on its exterior and interior sides. It was assumed that surface temperature of PV module was uniformly distributed in the three layers. It was also assumed that the heat capacity of the wooden frame and sealing material was having little effect on the temperature of PV module, air or insulation panel. This was because of the fact that wood was used as a construction material, and moreover, the magnitude of the heat capacity of wood framing material was not proportional to the face area of glass coated PV modules. The sensible heat capacities of glass faces, solar cells, air and polystyrene filled plywood board are presented in Table 4. It was observed that the difference of temperatures recorded by the top and bottom sensors for PV module, air and insulating panel were 6.9 °C, 8.1 °C, and 9.9 °C, respectively, for the critical case of passive ventilation of Run no. 4 in Table 3. Furthermore, the temperature differences were used for obtaining sensible heat storage capacities of various components in y-ordinate. The heat storage capacities obtained were 59.6 kJ, 0.755 kJ, and 510.7 kJ for PV module, air and insulation panel respectively. The heat capacities obtained were negligible in comparison with the total daily solar irradiation on PV modules on the day of conducting the outdoor experiments. It was also assumed that there were constant surface properties and ideal still air at the instance of collection of the measurements. Heat storage capacity in x-ordinate was also obtained from the similar procedure by assuming same proportionate temperature difference along thicknesses in x-ordinate. It was found that heat capacity in x-ordinate was nil in comparison with the value of heat capacity obtained for y-ordinate.
Table 3: Outdoor Measurement
| Run No. | S
(W m-2) |
Ep
(W) |
To
(°C) |
Ts
(°C) |
V
(m s-1) |
||||||||
| Active ventilation (Fan-assisted) | |||||||||||||
| 1 | 716.1 | 30.7 | 15.2 | 22.4 | 0.68 | ||||||||
| 2 | 716.1 | 30.7 | 13.4 | 22.4 | 0.53 | ||||||||
| Passive ventilation (Buoyancy-induced) | |||||||||||||
| 3 | 697.5 | 28.9 | 13.2 | 25.1 | 0.13 | ||||||||
| 4 | 697.5 | 28.8 | 13.3 | 24.9 | 0.17 | ||||||||
| Run No. | Tp(b)
(°C) |
Tp(m)
(°C) |
Tp(t)
(°C) |
Tb(b)
(° C) |
Tb(m)
(°C) |
Tb(t)
(°C) |
Ta(b)
(°C) |
Ta(m)
(°C) |
Ta(t)
(°C) |
||||
| Active ventilation (Fan-assisted) | |||||||||||||
| 1 | 35.4 | 33.8 | 36.8 | 20.6 | 24.7 | 29.1 | 18.8 | 21.7 | 19.4 | ||||
| 2 | 35.9 | 34.6 | 37.9 | 20.9 | 25.0 | 29.5 | 19.3 | 22.5 | 19.9 | ||||
| Passive ventilation (Buoyancy-induced) | |||||||||||||
| 3 | 40.8 | 44.9 | 46.8 | 27.9 | 34.8 | 38.0 | 21.3 | 29.5 | 29.8 | ||||
| 4 | 39.9 | 45.0 | 46.8 | 28.4 | 35.0 | 38.3 | 21.7 | 28.3 | 29.8 | ||||
| Distance as per locations shown in Figure 7 | Tp(b)
(°C) |
Tp(m)
(°C) |
Tp(t)
(°C) |
Tb(b)
(°C) |
Tb(m)
(°C) |
||||||||
| y (cm) | 15 | 55 | 94 | 15 | 55 | ||||||||
| z (cm) | 60 | 60 | 60 | 60 | 60 | ||||||||
| x (mm) | 6.2 | 6.2 | 6.2 | 96.2 | 96.2 | ||||||||
| Distance as per locations shown in Figure 7 | Tb(t)
(°C) |
Ta(b)
(°C) |
Ta(m)
(°C) |
Ta(t)
(°C) |
Air velocity sensor | ||||||||
| y (cm) | 94 | 15 | 55 | 94 | 99 | ||||||||
| z (cm) | 60 | 60 | 60 | 60 | 60 | ||||||||
| x (mm) | 96.2 | 51.2 | 51.2 | 51.2 | 51.2 | ||||||||
| Note: x is horizontal; y is vertical; z is adjacent 3rd axis of x-y plane | |||||||||||||
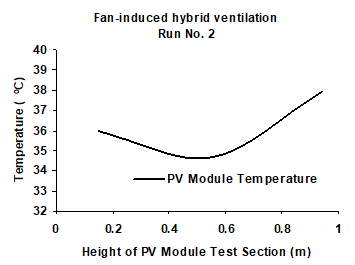 Figure 13: (a) Temperature plot of PV module for fan-assisted ventilation with height of PV solar wall section
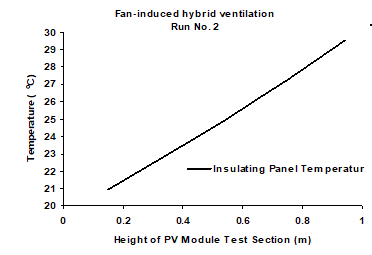 Figure 13: (b) Temperature plot of insulating panel for fan-assisted ventilation with height of PV solar wall section
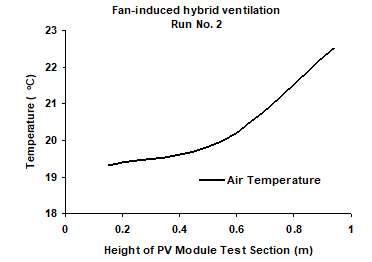 Figure 13: (c) Temperature plot of air for fan-induced hybrid ventilation with height of PV solar wall section
Table 4: Sensible heat storage capacities
| Component | ρn
(kg m-3) |
Cn
(J kg-1 K -1) |
dn
(m) X 10-3 |
dnρnCn
(J m-2K-1) |
Hpv-T
(J K-1) |
| Glass coating | 3000 | 500 | 3 | 4500 | 4171.5 |
| PV module | 2330 | 677 | 0.2 | 315.48 | 292.45 |
| Glass coating | 3000 | 500 | 3 | 4500 | 4171.5 |
| Sub-total | – | – | – | – | 8635.5 |
| Air | 1.1174 | 1000 | 90 | 100.56 | 93.22 |
| Plywood | 550 | 1750 | 7 | 6737.5 | 6245.66 |
| Polystyrene | 1050 | 1200 | 26 | 32760 | 30368.5 |
| Plywood | 550 | 1750 | 7 | 6737.5 | 6245.66 |
| Sub-total | – | – | – | – | 42953.0 |
| Total | – | – | – | – | 51588.5 |
Note: Heat capacities were calculated for face area of PV module test section of 0.927 m2.
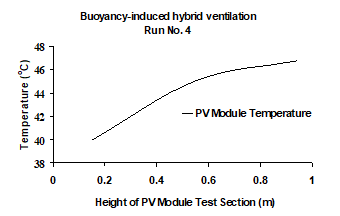 Figure 14: (a) Temperature plot of PV module for buoyancy-induced hybrid ventilation with height of PV solar wall section
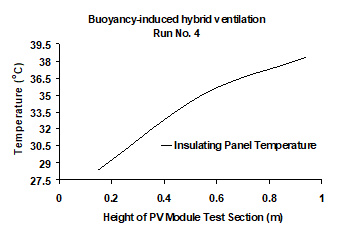 Figure 14: (b) Temperature plot of insulating panel for buoyancy-induced hybrid ventilation with height of PV solar wall section
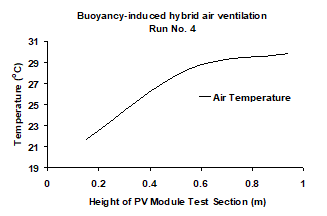 Figure 14: (c) Temperature plot of air for buoyancy-induced hybrid ventilation with height of PV solar wall section
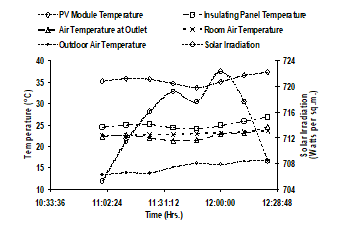 Figure 15: Variation of mean temperatures of PV module, air and insulating panel with solar irradiation under fan-induced hybrid ventilation
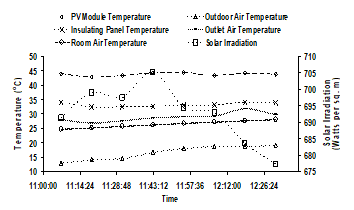 Figure 16: Variation of mean temperatures of PV module, air and insulating panel with solar irradiation under buoyancy-induced hybrid ventilation
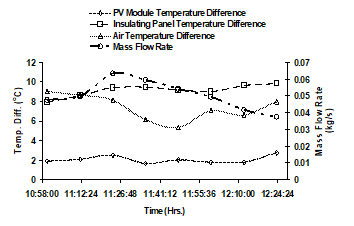 Figure 17(a): Temperature difference for PV module, insulating panel and air with height of PV solar wall under fan-induced hybrid ventilation
Table 5: Thermal storage capacities
| Component | kd
(W m-1 K-1) |
dnρnCn
(J m-2K-1) |
Hd
(Wm-2K-1) |
T
(sec) |
ΔTV
(K) |
ΔTH
(K) |
QV
(kJ) |
QH
(J) |
| PV module | 0.91 | 9315.48 | 10 | 932 | 6.9 | 0.04 | 5.8 | 0.2 |
| Air | 0.02624 | 100.56 | 10.0 | 10 | 8.1 | 0.75 | 0.0 | 0.0 |
| Plywood | 0.0835 | 6737.5 | 10.0 | 674 | 9.9 | 0.40 | 0.55 | 0.16 |
| Polystyrene | 0.02821 | 32760 | 1.0 | 32760 | 9.9 | 0.40 | 9.0 | 9.6 |
| Plywood | 0.0835 | 6737.5 | 10.0 | 674 | 9.9 | 0.40 | 0.55 | 0.16 |
| Total | – | – | – | – | – | – | 15.9 | 10.12 |
Notes:
- Equivalent thermal conductivity of glass coated PV module was calculated to be 0.91 W m-1 K-1
- Temperature differences along y-direction i.e. along height of PV module test section (0.993 m) were obtained from Table III for Run No. 4 in the case of buoyancy-induced hybrid ventilation.
- Temperature differences along x-direction i.e. along thicknesses of each component of PV module test section were obtained proportionate to temperature differences along y-direction.
Table 6: Temperature difference and noise of sol with solar irradiation (air velocity: 0.75 m·s-1)
| Solar irradiation
(W·m-2) |
Air Temperature Difference (ΔT) °C | Noise of Sol
oS (oncisol) |
| 450 | 15.50 | 28 |
| 550 | 18.90 | 28.93 |
| 650 | 22.40 | 29.7 |
| 750 | 25.90 | 30.36 |
| 850 | 29.40 | 30.91 |
Table 7: Temperature difference and noise of scattering with air velocity (S = 650 W·m-2)
| Air velocity (m·s-1) | Fluid Power (W·m-2) | Air Temperature Difference (ΔT) °C | Noise of Scattering
oS (oncisip) |
| 1.35 | 47.62 | 15.28 | 17.72 |
| 1.05 | 37.0 | 18.22 | 16.50 |
| 0.75 | 26.45 | 22.40 | 15.02 |
| 0.45 | 15.87 | 28.15 | 12.65 |
| 0.15 | 05.29 | 29.80 | 07.64 |
Table 8: Mass flow rate and noise of therm with (ΔT) °C
| (ΔT) °C | Mass flow rate
(Kg·s-1) |
Thermal Power
(W·m-2) |
Noise of Therm
oS (oncisol) |
(ΔT) °C | Mass flow rate (Kg·s-1) | Thermal Power
(W·m-2) |
Noise of therm
oS (oncisol) |
| 15.50 | 0.01376 | 71.09 | 19.5602 | 15.28 | 0.0231 | 117.65 | 21.868 |
| 18.90 | 0.01275 | 80.325 | 20.119 | 18.22 | 0.0171 | 103.85 | 21.296 |
| 22.40 | 0.0120 | 89.6 | 20.614 | 22.40 | 0.0120 | 89.6 | 20.614 |
| 25.90 | 0.0115 | 99.2833 | 21.043 | 28.15 | 8.1 X 10⁻³ | 76.0 | 19.866 |
| 29.40 | 0.0111 | 108.78 | 21.505 | 29.80 | 6.2 X 10⁻³ | 61.59 | 18.898 |
Table 9: Noise of elasticity with air particle velocity (Impedance Z0 = 413 N·s·m-3 at 20°C)
| Air velocity
(m·s-1) |
Fluid Power (W·m-2) | Noise of Scattering
oS (oncisip) |
Sound Pressure
(N·m-2) |
Sound Power Intensity
(W·m-2) |
Noise of Elasticity
oB (oncibel) |
| 1.35 | 47.62 | 17.72 | 557.5 | 752.7 | 30.36 |
| 1.05 | 37.0 | 16.50 | 433.65 | 455.33 | 28.05 |
| 0.75 | 26.45 | 15.02 | 309.75 | 232.31 | 24.97 |
| 0.45 | 15.87 | 12.65 | 185.85 | 83.63 | 20.24 |
| 0.15 | 05.29 | 07.64 | 61.94 | 09.29 | 10.12 |
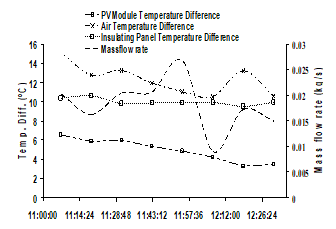 Figure 17(b): Temperature difference for PV module, insulating panel and air with height of PV solar wall under buoyancy-induced hybrid ventilation
8. Numerical Model
The initial boundary values in the model are based on the measured values of quasi steady-state solar irradiation, ambient air temperature, and room air temperature and air velocities. The measured boundary values were then used to obtain solutions for heat equations of the photovoltaic solar wall section. The actual observed temperatures from the experimental apparatus were then compared with the simulated temperatures obtained from the model.
The results of noise unit calculations using Equations 2, 4 and 6 for an outdoor duct exposed to solar radiation are tabulated in Tables 6 to 9. The results of the 2-D numerical model are presented in Table 10 and are obtained by assuming constant fluid and surface properties.
The variation of temperature of air with height of the photovoltaic solar wall test section is illustrated in Figure 18. Figure 18 also illustrates the deviation caused in the proposed model solution in comparison with the ideal exponential or logarithmic temperature variation.
The profiles of surface temperatures of PV module and back panel along the height of the solar wall section are illustrated in Fig, 19. The deviation from the ideal exponential and logarithmic temperature profiles of PV module and back panel is also presented in Figure 19. It was observed that significant cooling of surface of PV module was achieved by radiation heat exchange with the back panel. The surface temperatures of PV module and back panel for four different runs representing variation in solar intensities are presented in Table 10.
8.1. Thermal Time Constant
The thermal time constant is defined as the time required for the outlet air temperature to attain 63.2% of the total difference in value attained in air temperature following a step change in temperature of outdoor air crossing the inlet opening of the PV solar wall. Data for a step change were selected for observing the ambient air temperature. The data selected were in a steady state before and after the time-interval during the unsteady state response of the outlet air temperature with the step change in ambient air temperature. From the graphs, it was observed that thermal time constant under passive air ventilation was between 8-10 minutes in comparison to 2 minutes under active air ventilation. Therefore, it was decided that duration of time.
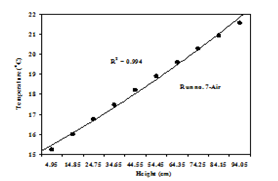 Figure 18: Temperature profile for Air for S=725.4 W m-2 (Run no. 7)
interval was selected for a minimum of two minutes to record any subtle temperature changes for obtaining measurements from the data logger [34]. The graphs of ambient and outlet air temperatures were plotted against the time-interval of measured data for the two cases of passive and active ventilation are presented in Figure 20(a) and 20 (b). Thermal time constants of the PV solar wall section were function of ambient air temperatures and air velocities and were therefore approximately calculated under conditions of passive and active air ventilation.
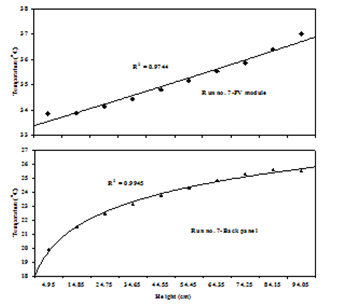 Figure 19: Temperature profile for PV module and Back Panel for S=725.4 Wm-2 (Run no. 7)
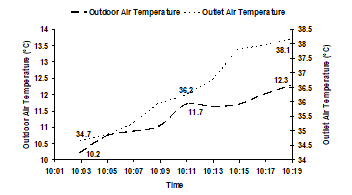 Figure 20 (a): Changes in outlet air temperature from a PV solar wall with a step change in outdoor air temperature under passive (buoyancy-induced) ventilation
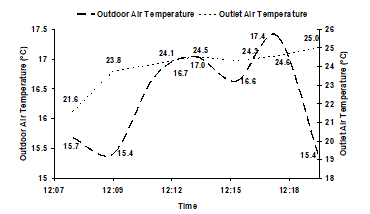 Figure 20 (b): Changes in outlet air temperature from a PV solar wall with a step change in outdoor air temperature under active (fan-induced) ventilation
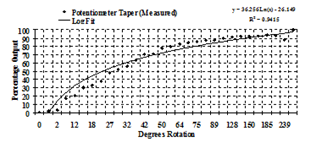 Figure 21: Potentiometer Taper (Measured) with percentage voltage output
8.2. Photovoltaic Amplification
In a parallel plate PV device, the temperatures were measured as a function of its volume. The measurements of temperatures for PV modules, insulating panel and ventilated air column in the wooden frame were non-linear. In the ventilated PV solar wall device for transportation of heat, the air velocities were developed both as a measure of buoyancy-induced and fan-assisted ventilation. The measurements of PV solar wall device, ambient air and room air temperatures, air velocities and solar intensities are presented in Table 10. The location and nomenclature of sensors is presented in Table 3. The power output results from a potentiometer with rotation of its circular knob are illustrated in Figure 21. From the graphs of Figs. 13, 14, 18, 19 and 20, phenomenon of photovoltaic amplification is observed. For a PV solar wall device, the gain is a function of its resistance or volume of steady state thermal and electrical functions. A loudspeaker has similar operational characteristics.
9. Signal Processing Parameters for a PV Device
The sinusoidal steady-state response was applied in performing the analysis of the parallel plate PV device circuit, because of the advantage of representing a periodic function in terms of a sinusoidal exponential function. Electrical analog RC circuit parameters of a parallel plate PV device are enumerated as under [4, 22]:
Capacitance: The capacitance of a parallel plate PV device with air as a dielectric medium was calculated to be 91.2 picofarads.
Resistance: The electrical resistances of various components were calculated as: glass coated PV modules were approximated as 5.3 kΩ, air was approximated as 1200 MΩ, and plywood board was approximated as 26.5 Tera Ω. The total equivalent electrical resistance of a parallel plate PV solar wall device was approximated as: 5.3 kΩ.
Time Constant: The time constant, which is product of resistance and capacitance, was calculated to be: 0.5 microseconds. The frequency with this time constant was calculated to be 2 MHz.
Capacitive Reactance: The capacitive reactance was calculated to be: 872.5 Ω.
Impedance: The impedance of the circuit was calculated to be: 5.4 kΩ.
The Phase angle θ: The phase angle between capacitance and reactance was calculated to be 9°.
The Phasor representation:
Z = 5.300 – j 0.8725 = 5.4 kΩ ∟-9°.
Capacitive Heating: The joule law gives instantaneous power absorbed by the capacitive impedance which is converted to heat. The heat capacities under critical operation of buoyancy-induced ventilation were calculated to be 59.6 kJ, 0.755 kJ and 510.7 kJ for PV module, air and plywood board respectively. The total average value of joule heating for the parallel plate PV device was calculated to be 571 kJ.
Induction Losses: The induction losses due to thermal storage effect in the parallel plate PV device were calculated to be 15.9 KJ.
Power Factor: The power factor was calculated to be cos θ = 0.911 lag.
Current function (i2(t)): Using the current function, i2(t) = Im2sin2(ωt + θ), the effective (root mean square) value of current was calculated to be 10.4 amps and maximum value of current was calculated to be 14.71 amps.
Voltage function: The voltage function is defined as per the sine wave: v = Vm.sin(ωt). The effective value of the voltage was calculated to be 60.4 volts and maximum value of the voltage was calculated to be 85.42 volts.
Power function: The instantaneous power is given by the expression:
![]() The Plots: The time diagram for current, voltage is plotted in Figure 22 (a). The time diagram for power is plotted in Figure 22 (b).
The Plots: The time diagram for current, voltage is plotted in Figure 22 (a). The time diagram for power is plotted in Figure 22 (b).
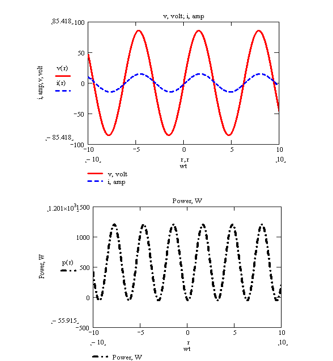 Figure 22 – Time diagrams: (a) voltage and current; (b) power in a RC circuit amplifier
Power Transfer: To describe the resonance phenomenon for equivalent mechanical, hydraulic and thermal systems of PV solar wall device, an electrical analog was used.
The Figure 22 shows that the instantaneous power is negative whenever the voltage and current are of opposite sign. However, as is illustrated in the Figure 22 that positive area of p(t) energy exceeds the negative area. Therefore, the average power is finite. Since the angle, θ, is small between current and voltage, the negative area of energy become very small. The induction losses due to thermal storage amount to 1.5% in comparison to the capacitive heating. Thus induction losses cannot be avoided in any electrical circuit, but can be minimized.
10. Solar Energy Acoustics
10.1. Theory
A theory of acoustics in solar energy was proposed by the author [10], which can be arrived and deduced from definitions of Noise of Sol and Equations (1) and (2).
A brief on the theory of a solar energy absorber is presented here in this paper. On the transparent surface of a solar energy absorber, direct rays from the sun are incident. The diffuse rays from the sky, clouds, and surrounding objects are also incident, which is also partly reflected and partly transmitted from a solar energy absorber. In addition to this, the selective coating on the surface of a solar energy absorber absorbs some part of the radiation. The reflected part of the incident flux is called the reflectance p, the absorbed part of radiation is called the absorptance α, and the transmitted part of radiation is called the transmittance τ. The sum of absorptance, transmittance and reflectance is unity, or
α + τ + p = 1 (8)
There are non-constant distributions of radiations over the directions of incidence and over the wavelength (or frequency) scale on a solar energy absorber. A sample of selective material of a solar energy absorber has radiation properties of transmittance, reflectance and absorptance, which are function of a specific thickness. For a solar energy absorber, the emittance ε is defined as the division of the thermal radiant flux emission from a surface to the black body radiant flux emitted at the same temperature.
The evaluation of radiation properties from angular dependence point of view is explained through geometry theory of a solid angle formed by all rays joining a point to a closed curve. The solid angle is defined as the ratio of the projected area A on the sphere to the square of length R and radius R. A sphere is considered to be having a solid angle of 4π steradians. For a solar energy absorber, the solar radiation incident on a point at a surface is presumed to be coming from many directions in a conical solid angle. For a cone of half angle θ, the solid angle defined by the circular top of the cone and point bottom of that cone is given by expression as:
Ω = 2 π (1-cos θ) (9)
In measuring the transmittance or reflectance, a sample is illuminated over a specified solid angle. The flux is then collected for a given solid angle for measurement of reflectance or transmittance. A conical solid angle is bound through a right circular cone. The source of solar radiation is sunlight.
The radiation properties of sunlight essential for performance analysis of daylighting and lighting are defined as follows:
The luminous flux is directed outward from a source, it ultimately strikes on many surfaces, where it is reflected, transmitted and absorbed. The illuminance is the density of the luminous flux incident on that surface.
The luminance is defined as the intensity of the source or the sink in the direction of an observer divided by the area projected on the source or sink as viewed by an observer.
Luminous intensity is defined as the power due to generation of the luminous flux. A source of sunlight is depicted to be having a luminous intensity in a particular direction. The inverse square law demonstrate that the illuminance incident perpendicular to the line from the point source of sunlight to the surface is directly proportional to the intensity of the source and inversely proportional to the square of the distance from the source of sunlight to the incident surface.
The luminous flux is defined as the rate of flow of light. A receiver surface receives watts of sunlight and it emits luminous flux. The measure of the success rate in converting watts of sunlight to lumens is called efficacy.
Quantity of sources is defined as luminous energy and is related to luminous flux, which is luminous power per unit time.
The luminance exitance is defined as the density of luminous flux leaving a surface of a solar energy absorber. The reflectance is defined as the ratio of the luminous flux reflected from a surface to the luminous flux incident on that surface. The transmittance is defined as the ratio of the luminous flux transmitted through a surface to that incident on the same surface.
10.2. Source and Sink of Solar Energy
The planet earth and its surrounding environment is absorber of solar energy. Examples of solar energy absorbers are civil structures such as green houses, buildings, panels, collectors, thermal power plants, roads, ports, bridges and canals. The earth-atmosphere system is an absorber for a portion of the incident solar energy radiated from the sun. The surface of the earth is also heated by a flux from its interior region from the decay of radioactive isotopes of the earth. The tides on earth occur due to the earth-moon system, result in viscous friction, energy input that affects the surface energy balance of the earth. To the extent that the earth is at a steady state and is not changing, the heat radiated by the surface of the earth is equal to the sum of the heat inputs. The solar radiation sources consist of many waves of interference in its radiation spectrum. The absorbed sources of waves of interference of light, sound, heat, electricity, fluid, fire are function of absorptivity for a solar intensity. The sink of solar energy is the earth and its earth-moon system. The temperature of the earth is raised by absorbed solar radiation as incident solar energy is the dominant energy input. The radiation absorbed by the earth is proportional to the earth’s cross-sectional area perpendicular to the sun’s flux. The earth is acting as a black body radiator with actual power radiated by the earth is determined from the radiative temperature of the earth-atmosphere system.
10.3. Radiation Sources and Life on Earth
Life on the earth is completely dependent upon the energy radiated by the sun. By photosynthesis green plants convert solar energy into chemical energy. All biological processes are either directly or indirectly reliant upon photosynthesis. In addition to the primary role of light in a living economy, a constant environment of radiations from various sources produces other effects, reactions and adaptations. These radiations have receptiveness to influence the life activities. The solar radiation, while passing through the atmosphere is reflected, scattered, and absorbed by gas molecules, ozone, water vapour, clouds and dust. The atmospheric length path traveled by sun rays is obtained by the air mass m, which is the ratio of the mass of atmosphere to the mass which would exist if the sun was directly overhead at sea level. In this case of overhead earth-sun path, m is equal to 1.0.
The sunlight on the earth is the major source of radiations. The spectrum of sunlight constitutes ultraviolet radiation, visible light, infrared rays and radio waves. The x-rays are originated by solar flares and their ionization due to absorption happens high in the earth’s atmosphere. From various celestial sources, x-rays also reach the earth’s atmosphere. About 60 per cent of the sunlight energy is in the invisible infrared region’s indefinite limit in radiation spectrum. Before radiations of shorter wavelengths reach the surface of earth, they are absorbed in the earth’s atmosphere. The artificial radioactive elements are produced by bombardment through high energy particles, examples include helium nuclei. The radioactive emanations consist of three components: i) alpha particles, which are positively charged helium nuclei; ii) gamma rays, which are penetrating radiations of very short wavelength but otherwise like x-rays; and iii) beta particles, which are rapidly moving electrons.
10.4. Greenhouse Gases
The most of ultraviolet solar radiation is absorbed by the ozone in the upper atmosphere. The part of the solar radiation in the shortwave region is scattered by the air molecules. The ozone layer is formed high above the atmosphere through absorption of ultraviolet radiation by oxygen. The reversible reaction again turns the ozone into oxygen through absorption of longer ultraviolet rays. The strength of the absorption of solar energy is proportional to the wavelength and absorption bands that are formed at regions of strong absorption. The examples of important atmospheric gases forming part of absorption bands are oxygen (O2), ozone (O3), carbon dioxide (CO2), methane (CH4), water vapour (H2O), nitrogen dioxide (NO2) and chlorofluorocarbons (CFC).
11. Sensors and Transducers for a Human Brain
Your body has feedback systems that regulate the internal environment of your body. The feedback systems make use of storage depots and numerous feedback loops. The monitoring of plasma calcium is a good example of negative feedback. The bones constitute large storage depots for calcium, for the plasma to withdraw these storage supplies in times of need. Our body’s homeostatic regulatory systems are represented by feedback loops. The feedback is considered negative, when it is compensating or negates any change. The negative feedback is essential to stabilize a system.
The gastrointestinal tract, the lungs, the kidneys, and skin of your body make exchange of materials and energy between the internal and the external environments. A steady state is achieved by regulatory mechanisms involving the balance between the inflow and outflow of the internal environment that stabilizes the composition of the internal environment. The tendency to regulate the internal environment so that it is maintained in a steady state is called homeostasis [1, 7].
11.1. Heat Stress
When vulnerable to solar radiation, your body acts as a solar energy absorber. This enables your senses for interpretation of our surrounding environment. The amount of heat you lose is dependent on the difference in temperature between the environment and the surface of your body. The heat loss from your body is directly proportional to this difference in temperature. The heat would be released from your body, if the surface temperature of your body is at a higher level than that of the environment. If due to excessive solar radiation, the environmental temperature rises above your body temperature, you will gain heat from the environment.
11.2. Effects of Intense Heat in a Room
Your presence in a room with solar radiation, high room air temperature and conduction do not count in your favour for loss of body heat. In this situation, your body gain heat from the surrounding environment. You have the chance to survive, but only through mechanism of sweating for losing heat. The normal response of your body is resulting in intense heat strains through the body’s circulatory system. This happens because the hypothalamus reacts to the heat through expansion of the blood vessels in your skin. As a consequence, it results in decreased resistance to blood flow and your blood pressure falls. The reflexes happen, which prevent large changes in blood pressure, ultimately begin to operate and the decreased resistance to blood flow is compensated through the heart working much harder. The expanded blood vessels create it potential for large amounts of blood to pool in the vessels of your skin at the price of other organs. You will faint as a result of sufficiently low blood supply to your brain.
11.3. Sweating
Through sweating, a circulatory problem occurs, because of the salt and water loss. A decreased plasma volume occurs because of excessive fluid loss. As a result, the output of blood from the heart is slowed down, which could lead to decreased blood flow to the skin, which ultimately could reduce sweating. If this occurred, your main avenue for heat loss would be shut down. In this case, heat production would continue and your body temperature would rise until your whole body system is collapsed. The body’s ability to control heat loss is very limited. A vicious circle may occur as a result of heat not losing rapidly enough to prevent a rise in body temperature. When heat regulation fails, the positive feedback loop occurs into operation in your body (Heat production – metabolism – temperature control); if unchecked it results in heat stroke and death.
11.4. Evaporation
Sweating is an evident method to lose heat by evaporation. Water continuously evaporates from your skin during the process of sweating. When you breathe, there is also a small loss of water from the surface of the lungs. When you breathe or sweat, the amount of water that evaporates is proportional to the humidity of the air. At high humidity of the surrounding air, water evaporates much slowly and therefore contributes less to the cooling process. One of the important methods of losing heat from the surface of your body is through evaporation. There is evaporation of water from your skin after swimming and you feel cool. There should have minimum amount of energy of the water molecules on your body’s surface for evaporation to happen. The speeding water molecules on the surface of skin beat the forces holding them in the liquid state. This finally results in evaporation into the air as water vapour molecules. The cooler molecules are left behind in the whole process. As a result, heat pours from the warmer surface of your skin to the cooler water molecules. This heat flow transfers energy to the water, increasing the number of evaporating water molecules. Furthermore, the cooling of your skin also cools any underneath blood which tends to flow through that part of your body.
11.5. Protection through Noise Filters
The keeping of face beard (facial hair) and wearing of a knitted head cloth (patka) and a turban (pag) on your body has a logical and a scientific significance. The daily self-making folds of hair knots and making round folds of turban over the head of your body with colourful cotton cloths has following historical, medical benefits: i) it indicate, protects and concentrate the disciplinary physical and mental strength of a person; ii) it gives hair tonic to the growth of hairs on your body due to solar energy; iii) the whole system acts as noise filter and provides immunity to your body; and iv) the folded Patka with style, folded design of hair knots on top of your head is your identity in time domain, the face beard on your body is a measuring ration and a sign of man, the turban with style, colour, design is your identity in space domain.
12. Comfort and Health
The ASHRAE handbook of fundamentals has provided a detailed discussion of the physiological principles of human thermal comfort [37]. The amount of heat generated and dissipated by your body varies considerably with activity and age as well as with size and gender. The complex regulatory system of your body act to maintain the temperature of your body to about 36.9 °C regardless of the environmental conditions.
The environmental factors that affect thermal balance of your body for influencing thermal comfort are [38]: i) the dry bulb temperature of the surrounding air; ii) the humidity of the surrounding air; iii) the relative velocity of the surrounding air; iv) the temperature of any surfaces that are in direct view to any part of your body and thus exchange radiation. In addition the personal variables that affect the thermal comfort of your body are activity and clothing. The physiological mechanisms that your body uses to control your body temperatures are metabolism, blood circulation, near the surface of the skin termed as cutaneous blood circulation, respiration and sweating. The metabolism rate determines the rate at which energy is converted from chemical to thermal form within your body and blood circulation controls the rate at which the thermal energy is carried forward to the surface of your skin. In respiration, air is taken in at ambient conditions but leaves saturated with moisture and very near the temperature of your body. The sweating has a significant effect on the rate at which energy is carried away from the skin of your body by heat and mass transfer.
The energy generated by metabolism rate of your body varies considerably with the activity of your body. A unit to express the metabolic rate per unit of area of your body is termed as met (1 met = 58.2 W m-2), defined as the metabolic rate for your body while seated quite (called sedentary). The variable which affects the comfort of your body is the type and amount of clothing that you are wearing. The insulation of clothing is defined as a single equivalent uniform layer over your whole body. The insulation value for clothing of your body is expressed in terms of clo units (1 clo=0.155 m2CW-1). A heavy business suit with accessories has insulation value of 1 clo, whereas a pair of shorts has 0.05 clo. ASHRAE Standard 55 provides comfort conditions for an acceptable thermal environment [38]. The most comfort studies involve use of the ASHRAE thermal sensation scale. The scale relates words describing thermal sensations to a corresponding number. These are enumerated below:
+3 hot
+2 warm
+1 slightly warm
0 neutral
-1 slightly cool
-2 cool
-3 cold
The operative temperature is the average of the mean radiant and ambient air temperatures, weighted by their respective heat transfer coefficients. Energy balance equations are developed that use a predicted mean vote (PMV) index. The PMV index predicts the mean response of a large group of persons. The coordinates of the comfort zones are:
Winter: Operative temperature of 20 to 23.5 °C at 18 °C wet bulb temperature; operative temperature of 20.5 to 24.5 °C at 2 °C dew point.
Summer: Operative temperature of 22.5 to 26 °C at 20 °C wet-bulb temperature; operative temperature of 23.5 to 27 °C at 2 °C dew point.
The loss of hearing is a serious occupational hazard. Factory workers, truck drivers and other workers are exposed to noise levels that are harmful. The continuous exposure to harmful noise level results in hearing impairment of your ear. The federal Occupational Safety and Health Administration (OSHA) in the Department of Labour has maintained noise exposure limits. The noise exposure is expressed in daily noise for an 8-hour shift.
13. Discussions
13.1. Experiments
The electrical characteristics that were obtained for a pair of glass coated PV modules with indoor experiments under standard operating conditions were performed under ideal conditions. The ideal test conditions gave inconclusive characteristics which certainly are not suitable for consideration during design of PV module system connected to buildings. Additional information under available operating conditions was essential for system design of the PV module system. The results of outdoor experiments revealed that thermal characteristics of PV modules were improved with a glass coating. There was considerable loss in generation of electrical power from a pair of glass coated PV module in comparison to typical rated electrical power for a PV module. The glass coating was responsible for increasing thermal storage along the major dimensions of the PV module system. The conduction heat flow along the height of the glass coated PV module resulted in rise of temperature along its height. This resulted in formation of thermal gradients along the volume of PV module system. The original metallic frame of the glass coated PV module was replaced with a wooden frame to minimize the effect of thermal gradients. The insulating panel in the wooden frame was a plywood board filled with polystyrene which is used in a modern building for insulation. A comparison of experimental results of passive and active ventilation envisaged that active ventilation was necessary to reduce high temperatures of PV modules. The heat storage capacities and thermal storage capacities of various components of PV module system were calculated. The major heat storage in the PV module system was due to heat capacities of the insulating panel. The result was loss of heat along the height of the PV module system. The packed polystyrene with loose fills in the plywood board was responsible for increasing thermal storage capacity of insulating panel. The rise in temperature along the thickness was calculated proportionally from the observed temperature rise along the height of the PV module system. Hence, the temperature measurements were also obtained along the volume, viz. height of a PV solar wall system.
13.2. Numerical Model
The temperature plots of Figure 18 and Figure 19 show that there was steep rise in temperature of insulating panel in comparison to glass coated PV module. The air temperature of air passage in the PV module test section was increased considerably due to increase in thermal mass of the PV module system connected to a building.
A periodic solar heat flux was subjected to heat exchange with ambient and heated air in the PV solar wall. With the assumption of lumped parameter applicability in x-direction imposed a very small percentage of error in the solution of the model. More elaborate solution techniques for heat exchange analysis though improve the accuracy of solution method but certainly were not realistic in environmental conditions involving large deviation due to variation in convection heat exchange coefficients but no deviation with simulated periodic variation of solar intensity.
13.3. Composite Waves due to Stresses and Oscillations
The following composite waves are generated due to development of stresses and oscillations on a PV solar wall device with incident short wavelength electro-magnetic waves: (i) due to connected external electrical load, transmission of electrical energy wave; (ii) due to exchange of viscous dissipation with air, the propagation of heat waves at longer wavelength; (iii) due to thermal stress generation with propagation of heat waves, elastic waves are transmitted in a PV solar wall device; (iv) due to combination of stress development with heat waves, elastic waves and applied external source of energy, the fluid surface waves are propagated; (v) due to climate-particle oscillations of wind and fan induced pressure, applied external waves are propagated; In absence of wind and fan pressure, thermosyphon based oscillations are propagated due to thermal buoyancy.
Such as in an organ pipe, the sound waves can transmit with combination of applied external source of energy and fluid surface waves. From the surrounding environment due to air-borne sound transmission, the sound waves are propagated. Due to various stresses and oscillations acting on a static particle body, the transmission of composite waves is generated. With action of composite forces acting on a PV solar wall device, the developed stresses are classified as: (i) fundamental; (ii) internal; and (iii) external. Due to presence of electromagnetic and gravitational forces of a solar system, the fundamental stresses are generated. Under the influence of fundamental stresses, internal stresses are generated with characterization of composition properties at chemical, atomic and molecular level. With application of external source of energy such as fan based force used for active air ventilation in PV solar wall device, the external stresses are generated. With stress development due to periodic force of expansion/compression, cooling/heating and night/day, the oscillations are assumed to be generated on PV solar wall device. On a PV solar wall device, climate-particle oscillations due to wind force are also transmitted. Due to superposition of composite waves, the fluctuating forces are generated.
13.4. Resonance
The parallel and series cases of LCR circuit resonance are briefed here. With the aid of presented modelling and experimental data, the cases of resonance are visualized. For elastic waves transmission, the inductance force exists due to mass of the mechanical system. The capacitance force exists due to heat storage capacities of PV solar wall device (PV modules, air and polystyrene filled plywood board). The polystyrene filled plywood board is vulnerable to heat stress of fire as soon as heat waves propagated with frequency matching with its latent heat of vaporization is achieved. Due to thermal and fluid resistance in energy storage elements of PV solar wall device, equivalent electrical analog resistance is developed. The parallel case of LCR resonance happens with fluid surface waves (RC) and heat waves (RC) in conjunction with inductance (L) due to mass of PV solar wall device and resistance (R) due to temperatures of ambient air and ground surface. The series case of LCR resonance occurs with propagation of elastic waves of a PV solar wall device.
13.5. Human Regulatory Feedback Mechanism
Our body has feedback systems that regulate the internal environment of our body. The feedback systems make use of storage depots and numerous feedback loops. The monitoring of plasma calcium is a good example of negative feedback. The bones constitute large storage depots for calcium, for the plasma to withdraw these storage supplies in times of need. Our body’s homeostatic regulatory systems are represented by feedback loops. The feedback is considered negative, when it is compensating or negates any change. The negative feedback is essential to stabilize a system. The gastrointestinal tract, the lungs, the kidneys, and skin of your body make exchange of materials and energy between the internal and the external environments.
A steady state is achieved by regulatory mechanisms involving the balance between the inflow and outflow of the internal environment that stabilizes the composition of the internal environment. The tendency to regulate the internal environment so that it is maintained in a steady state is called homeostasis. The coordination of the activities of the various sensory organs within your body is controlled by the secretion of hormones and by transmission of nerve impulses. The nerve impulses travel along axons.
The sensory nerve axons carry impulses from different parts of your body to the central nervous system (brain and spinal cord). Although parts of your brain involved in various physiological functions have been located, research attempts to localize complex behavior patterns in sensory areas of your brain have failed. The sensory areas are located for the impulses on the cortex. The motor areas are also located where “command” impulses leave the cortex. The cerebellum receives impulses from sensory receptors and interacts with motor cortex, insuring smooth muscular movements. The reticular formation receives sensory impulses from the environment and sends impulses to the cortex.
13.6. Noise Filters and Kinetic Theory of Gases
The behavior of gases over wide range of temperatures is predicted through kinetic theory model by average kinetic energy of translation. The noise filters are defined based on the model of kinetic theory of gases for filtering unwanted frequencies of oscillations from a power system. It is a network with selective transmission for currents from a power system of varying frequency. The noise filter is used to filter unwanted frequencies of oscillations from a power system. The noise protection and security is a crucial operation for obtaining a desired output from a power system.
13.7. Significance of Noise Characterization Theory in Cities
Energy & Entropy: Developed cities are highly reliant on continuous inputs of energy to provide goods, services and environment associated with a high standard of well-being. Energy is typically thought of in purely sensible terms of heat and work consumption of a city, but the process development itself may be shown to be theoretically dependent upon inputs of energy in a city. Primarily, energy is required to achieve an increase in order and knowledge (since thought process of an individual requires a metabolic input). The theoretical basis for this concept of increase in order and knowledge is based on principle of kinetic theory of gases. The laws of mechanics are insufficient to predict the behavior of a gas, since they provide no preferred direction for time. With some limitations, the concept of increasing entropy, however, provides a direction for time. Since the entropy of a system is associated with its lack of order, the concept of entropy also applies to non-thermodynamic systems [39].
Biological System and Entropy: Biological system represents an increase in order for the evolved material (i.e. a decrease in entropy) and is termed as ‘complexification’ by the biologists. Cultural evolvement and industrialization also signify movement by a developing city from less order to greater order. Additionally, life also requires continuous input of low entropy energy to recompense for the ultimate entropy increase experienced by all living material, i.e. death.
Photosynthesis is directly reliant upon energetic photons of shorter wavelength visible light. By means of photon-activated chemical reactions, plants are able to produce organic material from carbon dioxide and water. Since the energy potential of the organic material is greater than that of constituents, an entropy decrease is achieved. The organic material has higher order degree than the carbon dioxide and water from which it was produced. The process of respiration both by the plants and living organisms which depend either directly or indirectly through plants, achieves in low-temperature waste heat. It is this biological heat engine upon which life on earth is almost entirely dependent.
Knowledge, Order and Well-Being: Knowledge is gained mostly through social-economic process, which requires inputs of low entropy reserves. Well-being of a city also increases through knowledge even though history has been marked with short-term reversals such as in the event of a war. Smart improvements in a city represent an increase in order i.e. a decrease in entropy. Improvement in well-being of a city is often the result of endeavours that have very subtle effects such as an insight of a new scientific theory, which represents a more ordered image of the world. In addition to increases in order, human created systems frequently produce undesired forms of disorder, i.e. environmental pollution. For example, emissions (indoor and outdoor) represent a ‘scattering’ to the winds of pollutants, an increase in disorder.
Solar Energy and Waste Recycling: Recycling of wastes is equivalent to interconnecting the material inputs and outputs. Energy though conserved cannot be completely recycled, due to inevitable increase of entropy. A shift from the present dependence upon conventional energy resources to either a direct or indirect usage of solar energy is already happening. A complete recycling of materials and a total reliance upon solar energy would lead to sustainable and smart economy. Energy derived from the sun is obtained without entropy increase. There is generation of waste heat irrespective of energy source. However, a solar energy system results in no greater increase of entropy in comparison which occurs without the system. Entropy is an indicator of non-utilization. The increase in entropy specifies a decrease in low entropy sources of energy with high utilization, which occurs irrespective of energy conservation in a system.
Noise and Noise Behaviour: It is recognized that many proposed methods of energy conservation also results in reduction of energy cost. For example, an improved transportation system would not only result in energy conservation, economical affordability but also generates less Noise. As is the case of increased energy consumption, increased quantities of goods and services result in generation of more noise behaviour in a city. As stated previously, ‘Noise’ is defined as a sensation of unwanted intensity of a wave. It is perception of a pollutant and a type of environmental stressor. An environmental stressor such as noise may have detrimental effects on various aspects of health. The unwanted intensity of a wave is a propagation of noise due to transmission of waves (viz. physical agents) such as sun, light, sound, heat, electricity, fluid and fire. Noise Behaviour is checked by identifying a source and a sink of noise i.e. a person making noise in the environment and a person affected by such noise in the environment.
The omnipresent characteristic of the urban environment is its exposure to environmental noise. The excessive noise is accepted by the public health doctors and professionals as an undesirable feature of the urban environment. Noise is indisputably perceived to be an irritant, interfering into personal privacy, and causing displeasure and diminishing the worth of a person and his health. As health is largely defined to include quality of life and displeasure, therefore noise undoubtedly affects health.
The effects of stress due to noise of physical agents are consideration to contribute to a range of disorders as wide as impairment of hearing, cancer, heart disease, musculoskeletal conditions, skin disease, gastrointestinal and other disorders. The evidence is strongest for links between certain types of prolonged stress and heart disease, hypertension, and mental illness. Most of the evidence for such links is epidemiological. It is possible that what is bad for the individual employee is also bad for the organisation. Organisational worries connected with work related stress include high absenteeism, increased staff turnover, low job satisfaction, low morale, poor organisational commitment, poor performance and productivity, possible increased accident and near miss rates, and, in some cases, an increase in employee and client complaints and litigation.
All such unwanted disturbances of noise caused by a person or deviation from a normal behaviour so as to distract attention of a normal person are termed as ‘Noise behaviour’. There is always a source of noise and a sink of noise i.e. a person making the noise in the environment and a person affected by such noise in the environment. A person making the noise in the environment is also affected. The occurrences of noise related stress alters the way people think, feel, and behave. Many of the changes that occur are diffident and potentially reversible, although harmful to the person’s value of life at the time. Other changes may be more enduring, and have substantial consequences for health. Behavioral changes include increases in health risk behavior, such as smoking and drinking, and decreases in health positive behavior, such as exercise and relaxation. Many behavioral changes represent attempts to cope with the emotional experience of stress due to noise—for example, by making noise due to presence of physical agents in the environment or because of other person’s noise behavior in the form of polluting the environment. The noise in the environment is associated with poor decision making, impaired concentration, reduced attention span, impaired memory, and confusion. People who report under stress due to noise also admit that not being able to think straight forward. Social behavior and interpersonal relations of the person affected by noise may also be demolished, possibly reflecting these and other psychological changes such as tiredness and increased irritability.
Biomedical Instrumentation for a Noise System: Biomedical instrumentation for measurement and monitoring of noise from human systems in a city require real time informatics capabilities. Sensing and actuating capabilities as well as measurement systems for noise can be ‘in vivo’ and ‘in vitro’. The signals can be classified as bio-electric, bio-sound sample, bio-mechanical, bio-chemical, bio-magnetic, bio-optic and bio-impedance depending upon origin of ‘stresses and oscillations’ in a noise system.
Energy Conversion, Energy Processes and Noise: Energy conversion materials and devices convert one form of energy into another form. The energy conversion efficiency of a device is an expression of energy balance between energy input and energy output. Materials play important role in conversion efficiency due to involvement at molecular and atomic level. Energy conversion is deeply associated with energy processes of heat, fluid, electricity and HVAC devices.
Combustion is primary form of energy conversion of low grade fuels such as biomass and municipal solid waste. Energy conversion of low grade fuels from solid to a liquid or gaseous state is through various techniques for enhancement of calorific value of fuel. Inefficient fuel combustion is wasteful as well as generates higher level pollutants. The pollutants and solid wastes generated during energy conversion must be controlled to protect public health and well-being of the affected environment in an ecosystem.
Energy conversion efficiency can be increased through cogeneration. A cogeneration plant consists of energy equipment to produce both electric energy and useful forms of thermal energy such as heat or steam for commercial, industrial, heating, or cooling purposes. Cogeneration plant is designed as either topping-cycle or bottoming-cycle process. Either of these cycles can utilize thermal energy to meet process heating, ventilating, and air-conditioning (HVAC) or built environment comfort requirements for steam or for hot/cold water.
There is generation of waste heat, entropy and noise in all energy conversion devices and systems, which can be minimized by selective materials, optimized design configurations and performing high-resolution modelling and simulations.
13.8. Significance of Noise Characterization Theory in Acoustics
Traditionally acoustics is associated with sound. Nearly all life activities result in generation of sound. However, in traditional acoustics only vibrations by way of pressure difference is associated with sound. In noise characterization theory, apart from sound, acoustics is associated with composite wave elements of light, heat, fluid, electricity, fire and sun. Since all life activities are associated with these composite waves, therefore contemporary acoustics should also involve these wave elements. In this way, knowledge of wave theory principles enables the requirements for the control of noise due to these composite wave elements.
A clear differentiation must be made between the objective specification and measurement of noise field due to these composite wave elements and its subjective appraisal or the sensation it produces on people exposed to it. Many kinds of subjective judgment are possible, according to the particular circumstances, but no objective measurement can determine subjective response directly. Although much of the discussion of noise can be in objective terms and be concerned with quantities which can be evaluated and measured, it is essential to introduce the subjective aspect since noise is associated with people and their routine lives.
Investigation of the noise quantities due to composite wave elements vary with frequency. Frequency is normally plotted on a logarithmic scale because the pitch, which is a subjective assessment of frequency of composite waves (viz., physical agents) perceived by human senses, varies approximately in this way. Usually, measurements are normally made in ranges of frequency bands, or at frequency intervals which are equal steps on a logarithmic scale. Octave steps may be suitable in many cases of composite wave elements, but narrower bands may be more appropriate where applicable. For comparison purposes, certain standard frequencies and frequency bands may need to be developed for these composite wave elements.
For some cases, such as expressing the reduction or insulation provided by a particular building wall, the relative values in oncibel and oncisol are sufficient. A wall with reduction in sound power intensity and thermal power intensity is given by a certain ratio. Sound pressure measurements are normally made in terms of Root Mean Square (r.m.s) value of the alternating pressure of the sound wave. Similar r.m.s values can be obtained for light, heat, fluid, electricity, fire and sun. Objective measurements and specification of intensity level is to be made on a hexagonal noise scale with seven edges. Figure 23 has presented a double-sided hexagonal slide rule with seven edges for noise measurement representing seven sources of noise [6]. In subjective assessment, however, we are concerned with the way people perceive and respond to various physical agents, and the response of human senses play important role. Contours of equal loudness (pressure level) can also be determined for a number of similar conditions using bands of noise and perceiving conditions of physical agents more closely resembling under practical conditions. A number of other criterion curves, similar in form to the equal contours, are in use for assessment of subjective attributes of noise, such as noisiness, disturbance etc. A simple subjective assessment is presented in Table 11, in which grades and flag colors of noise are notated under limiting conditions [6].
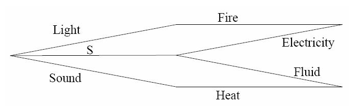 Figure 23: A Double-Sided Hexagonal Scales of Noise with Seven Edges (S denotes Sun)
13.9. Significance of Noise Characterization Theory in Electrical, Instrumentation and Control
Electrical noise is defined as unwanted signals that interfere with the wanted signal output. In electrical engineering, noise is associated with circuits, devices, power systems, electronics, instrumentation and control.
There are many sources of measurement noise. It is mainly caused by the sensor physical mechanism. In general, for sensors and transducers, there are many sources of noise that lead to: i) Johnson’s noise; ii) radiation noise; iii) shot noise due to recombination; iv) flicker or contact noise; and v) interference noise.
A control system is gained in measurement noise by way of amplification and it is fed into the whole system. This results in substantial variations in the signal for control of process variable. In this way measurement noise, disturbs the information about the process variable which is delivered by the sensor. Measurement noise has high frequencies in most cases. It is essential that the fluctuations in the control signal are maintained to minimum and not so large to cause the actuator to steep. Measurement noise and its actuator steep leads to inevitable gain of high frequency in the controller and therefore results in its rapid response speed.
In computer controlled systems it is also caused by the resolution of the analog to digital converter. The signal to noise ratio (SNR) is plotted for example with a Bit Error Rate (BER) in a digital communication system. The units expressed in various types of electrical noise should be in oncisol which can be plotted on a log scale against frequency or any other parameter. Similarly noise due to an actuator for example a stepper motor, can be expressed in terms of electrical noise (oncisol) and its motion noise (oncisip).
13.10. Noise Fields
In a free space, noise travels away from a point source, and is small compared with the wavelength. In this case, there is spherical radiation and the intensity at a remote point varies inversely as the distance from the source. There is another case when noise source is large or extended and the distance is not large compared with the noise source size, in this case the inverse square relation does not hold. Noise fields are complex pattern. Wave theory is necessary to estimate the complete behaviour of noise and even in simple cases, analysis is complex. In actual field practice, only geometrical and statistical methods are used.
Table 11: Noise Grades and Flag Colors under Limiting Conditions
| Grades
|
Noise Grades and Flag Colors under Limiting Conditions | ||
| Noise of Sol | Noise of Scattering | Noise of Elasticity | |
| G2a = ±U | Sol | Sip | Bel |
| G1 = G2 = U | No Positive Solar Energy | No Positive Fluid Energy | No Positive Sound Energy |
| Base Color for
G1 = G2 |
|||
| G1 = U+→0 Wm-2 | Decreasing Solar Energy | Decreasing Fluid Energy | Decreasing Sound Energy |
| Base Color for G2 | |||
| G1= + ve | Increasing Solar Energy | Increasing Fluid Energy | Increasing Sound Energy |
| Base Color for G2 | |||
| G1 = -U Wm-2 | Negative Solar Energy | Negative Fluid Energy | Negative Sound Energy |
| Darkness | Low Pressure | Inaudible range | |
| Base Color for G2 | |||
| G1 = -ve | Darkness increasing, distance from point source of light increasing | Low pressure increasing, vacuum approaching | Inaudible range increasing, vacuum approaching |
| Base Color for G2 | |||
| G1 = -U+→0 Wm-2 | Negative Solar Energy | Negative Fluid Energy | Negative Sound Energy |
| Decreasing Darkness | Decreasing Low Pressure | Decreasing inaudible range | |
| Base Color for G2 | |||
- Reference value of G2 = ±U signifies the limiting condition with areas of noise interference approaching to zero.
We need to define the system boundary in a noise system. Noise is radiated initially from a source, but due to finite dimensions of the system and as per wave theory some portion of the noise is reflected, whenever it strikes a bounding surface. The resulting noise field at any other point is made up partially of noise radiated directly and partially of the reflections from the system boundaries. When the system surfaces are made as reflecting as possible and the system boundary is irregular with reflections occurring in all directions, the noise field is effectively diffuse. There is no preferred direction in which the noise is travelling at any point and the noise pressure level is assumed to be uniform throughout the volume of the system. There is exception when the noise pressure is not uniform, when the point investigated is close to the noise point source.
Materials play important role in noise absorption. Most of the materials available are not complete reflectors. In many cases, noise is partially reflected, partially absorbed and partially transmitted through the system surfaces forming the system boundaries. The magnitude and direction of noise field depends on the material and surface characteristics of the system boundary. Therefore, the noise fields occurring in practice are rarely completely diffuse. In most of the cases, in the system boundary, there are surface irregularities which are sufficient to provide diffusion at the higher frequencies, where wavelength is short. In the cases, where the noise source wavelength is comparable with the dimensions of the investigated system (such as a cubical or rectangular), complete diffusion may occur at lower end of the frequency range. For many practical cases, it is assumed that the noise fields in the system are diffuse, with support of the measurements made at a number of different positions throughout the investigated system under steady state conditions, which do not show much variation, hence the average of a suitable number is normally taken.
Insulation and Absorption: Physical agents which are propagated into the system fall into two classes, wanted and unwanted. The wanted physical agents are the new field of acoustics. The unwanted physical agents, noise, are controlled in a system in two ways, by insulation and by absorption. Energy is removed from the system containing the sources of physical agents by the absorption at the bounding surfaces. The steady state level to which the physical agent builds up with a given source is determined by the volume and total absorption of the system. Small proportions of the non-reflected composite wave elements of physical agents, which are incident upon a system surfaces, are transmitted through the structure of the material and may be radiated from the other side of the system. In this case the surface acts as an insulating barrier between the source of physical agent and the remote position. Materials which are good absorbers of physical agents are rarely effective insulators if used in the form of barriers in a system. However, the principal requirements for each function are completely different. Thus it is important to distinguish between the two mechanisms by which intensities of composite waves are reduced. The reduction of noise field and kinds of materials suitable for insulation and absorption can also be investigated.
When an insulation panel acts as a barrier to a noise field the practical insulation or reduction to intensities of composite wave elements is given by the amount by which the noise pressure level due to a source is reduced by the barrier. The surface densities, thermal, optical and elastic properties, of the insulation panel are direct factor influencing insulation. It cannot be expected that this simple statement will take into account all the factors which are likely to affect the insulation of a panel in practice. However, it gives an extremely good indication of the values likely to be expected. The noise insulation expression is required, which gives a good indication of the insulation to be expected from an insulation panel at sufficiently low and sufficiently high frequencies depending on the particular physical characteristics of the panel. Between these frequencies there is a band where the material stiffness and the corresponding bending wave pattern in the panel influences its noise insulation behaviour. The panel is forced by the noise field into bending waves of this wavelength and at the same frequency as is present in the incident composite wave. If the physical constants of the panel-stiffness, density, thickness, optical and thermal characteristics, for example – are such that a free bending wave of this wavelength coincides with this frequency, there is theoretically the possibility of total transmission, with the panel, being freely excited and radiation from the other side occurring. At a particular frequency the bending wavelength imposed on the panel is smallest for noise fields near grazing incidence and largest towards normal incidence. At normal incidence the imposed bending wavelength is infinite and true bending waves cannot be excited. In this case the panel can be forced into uniform oscillations of physical agents. This effect is only possible above the critical frequency for which the bending wavelength in the wall is equal to the wavelength in contact medium since only then is the bending wavelength larger than the wavelength of contact medium. It is simply experienced in practice that this effect has some influence on the insulation values of panel when the appropriate conditions are satisfied. Although noise fields in a closed system (such as rooms) are reverberant and partitions are not normally exposed to plane composite waves, at particular angles of incidence. Although the transmission is never total nor the insulation reduced to zero (because of finite dimensions, the damping in the material and at the edges, and the random noise fields which exist in practice). The depression or dip in composite wave which is obtained can have a significant subjective effect. One way of increasing the critical frequency to above the practical range and hence increasing the insulation is to reduce the stiffness of a panel.
Radiation from Panel: The power of panel radiating noise field is also closely connected with the critical frequency. The depression or dip in the behaviour of insulation occurs because noise is freely radiated when the wavelength in the material is greater than the corresponding wavelength in contact medium. At frequencies for which wavelength in contact medium is greater than wavelength of the material, the value of incidence angle is imaginary and radiation no longer occurs, the oscillations of composite waves in the panel occurs without much stress or pressure field. On the basis of this radiation theory it is expected that thicker panels for which wavelength in material is larger would radiate better than thin ones, and this is so when the amplitudes of oscillations are the same. For the same amount of energy used to excite a panel, however, the thick panel has a lower amplitude of oscillation but better radiating power and thin panel the higher amplitude and the lower radiating power; the net effect of a given excitation, is to have the same order of noise.
Factors affecting Insulation: There are a number of interacting factors which affect the insulation. Mass is normally of greatest importance and determines the insulation at low frequencies. At the lowest frequencies it is possible that the normal resonances or modes of oscillation of panel of typical size may affect the insulation but the practical difficulties of determining the insulation at low frequencies are such that the measurements are not as reliable or reproducible as measurements at higher frequencies. Therefore, any effect caused due to low frequency resonance is difficult to detect.
Heat transmission also plays important role in thermal insulation [40]. The three types of heat transfer affecting the comfort level is radiation, conduction and convection. The integrated thermal and sound insulation is to be determined by various factors such as climate, heat transfer rate, solar energy intensity, elastic, thermal and optical transmission properties. Water vapour barrier and insulation play important role in comfort and wellness of the occupants. In warmer climates, water vapour barriers on exterior side of panel or wall are normally not provided because: i) the temperature drop across the insulation is usually less, and because of this vapour migration would be slower; ii) there are less chances of condensation due to less temperature difference; iii) the built environment is subjected to significant amount of cooling in summer, the vapour barrier would be on the wrong side of the panel much of the yearly time. This is because when the vapour barrier is on the cold side of the insulation, the barrier traps moisture inside the wall. A good integrated insulation will act as noise filter to prevent unwanted oscillations of composite wave elements. Other factors affecting insulation of a system are infiltration. Air and moisture leak into the closed system (or building) through cracks around openings such as windows and doors. This leakage is caused by a combination of the wind pressure on the system and the difference in temperature between the inside and the outside. Sound insulation will depend on the materials and methods used in a system. As mentioned before sound transmission through a panel depends on mass of the panel and on its inelasticity. Massive, thick walls provide excellent sound barriers, but there is a diminishing point when mass alone is not an economical solution.
Integrated noise insulation ratings depend on materials and assemblies of materials. Integrated Noise Transmission Class (INTC) can be used to represent the transmission loss performance of the panel construction over a broad range of frequencies. The results can be plotted, and a standard curve based on human senses response at the various measuring frequencies can be used to determine the rating. The higher the rating, the better will be the construction of a panel in terms of reducing composite wave elements. Average Integrated Transmission Loss (AITL) can be used to check performance of the panel over a range of different frequencies. The results of these performance tests, at each frequency, should be averaged together for integrated transmission loss rating. In these performance tests, the effect of various people sensitivities to various types of noise over various frequency ranges is not taken into consideration. Integrated Noise Reduction Coefficient (INRC) rating could be used to measure the ability of a material to absorb various physical agents rather than reflecting them.
Double or Cavity Walls: When a single panel or wall does not provide sufficient insulation and it is impracticable either to increase the weight or to gain adequate advantage from single wall or panel, a system of double wall construction could be used. The double wall insulation obviously depends on the overall behaviour of each panel, on their relative spacing along with their structural joints for support and interconnection. In the case of double wall, the air cavity acts as a coupling. If the air in the cavity between the two panels of a double wall is prevented from moving laterally, i.e. along the width and height, rather than across the cavity, the lower frequency resonances due to noise field at oblique incidence and the resulting effect on the insulation are less noticeable. Such a lateral restriction occurs whenever a suitable absorbing material is put into the airspace. The effect of such materials is most noticed at the lower and upper ends of the frequency range and their influences least at mid-frequencies. The best type of material should have a reasonably high resistance, good damping, and stiffness adequately high but not higher than the air. Complete isolation of the two panels of a cavity wall is normally impracticable. Even when the two adjoining panels are capable of standing independently it is normal practice to link them together for structural stability. The way in which these links provide integrated thermal and sound bridges between the panels is likely to have a marked effect on the resultant integrated insulation. Sufficiently light or resilient bridges on the one hand or sufficiently heavy or rigid bridges on the other are likely to have least influence on the insulation, since in either case the impedance of the bridging element, i.e. resistance to being driven into oscillations due to composite wave elements, is different from that of the two panels. It is difficult however, to ensure that a bridge used in practical situation, falls into either of these two categories, hence the use of bridges in cavity wall structures is likely to result in lower values of integrated airborne sound and thermal insulation than expected, and should be avoided if at all possible in practical situations.
Building Structures: In addition to being excited by various airborne physical agents, building structures can also be directly excited by direct impact forces, oscillating bodies such as machine vibrations and footsteps. These forces can also be natural such as wind, thunderstorm, earthquake, lightning etc. One difference between these two methods of excitation is the effective area of the structure which is excited. With airborne physical agents, it is normally the whole area of wall or surface exposed to the noise field, unless the source is particularly directional and these are marked differences in level between the direct and reverberant noise field exciting the structure. With direct impact forces, the area directly excited is more limited, although the structure-borne waves produced may travel through the structure and be radiated from larger areas remote from the noise source. The degree of excitation close to the source may, however, be much greater than with airborne physical agents at the levels normally experienced.
Direct structural excitation may frequently be considered to act at a point and the amplitude of oscillation in the immediate area may well be large although when the energy is spread to other parts of the structure. The resultant amplitude of oscillations is of the same order of magnitude as with airborne composite wave elements. The obvious solution for most impact force transmission problems lies in preventing the impact stresses or pressures, which give rise to oscillations in the main body of the structure, either by providing surfaces which act as cushion absorbers, or by having a discontinuous structure preventing the oscillations implanted on the noise source side from being transmitted to and radiated from surfaces beyond.
With thicker constructions the local elasticity at the point of impact of physical agent may be such that the simple expression for the velocity cannot be used since the noise fields from all types of physical agents not on their velocities but on the resultant velocity subsequently produced in adjacent regions, and on the local resilience at the point of impact. The radiating power of the surface excited also has an effect and this in turn depends on the ratio of the frequency to the critical frequency of the panel. Further, the level of radiated noise field, which can be obtained from the resultant velocity, assumes a constant bandwidth with respect to frequency whereas practical spectra are normally obtained in terms of constant percentage bandwidth.
Design and Insulation: Ventilation systems such as an airflow triple glazed window with an automated roller blind and photovoltaic solar wall which include adequate noise attenuation can be provided in new building construction. At present they are expensive, and the problem of adapting existing buildings for such type of acoustic filter is difficult though not impossible. In particular situations where noise due to physical agents is intermittent, automation of the integrated noise and ventilation system could be performed. The provision of adequate noise insulation in a new building is always possible providing the standards which have to be achieved are known and the appropriate decisions are made at the planning and design stage. In many cases the appropriate standards can be met without extra expense at planning and design stage but it is extremely difficult to make any appreciable changes when the building is already in existence, particularly when high values of insulation are required. At the higher level of insulation, however, the effect of flanking transmission via the supporting structure is most marked and slight changes in structure may give significantly different results. It is at these higher levels of insulation that the results of field and laboratory measurements of noise insulation show the greatest difference. If a completely new form of construction is planned for which no corresponding field results are available, a laboratory measurement will indicate the potential insulation which the construction could give.
Maximum intruding noise levels: In every case, before the acoustic design is considered, the problem of eliminating external noise has to be solved, removing the unwanted physical agents, so that wanted composite wave elements can be perceived to the best advantage. The principles of noise insulation has been described, but in practice an appreciable proportion of the overall design is concerned with ensuring that these principles are adequately applied in practice to eliminate all the possible weak links in the external structure, and to ensure that no noise comes from plant or equipment which would produce any undesirable physical changes in the system.
The particular integrated insulation required will obviously depend on the level of external noise and the degree of disturbance to be eliminated. Various criteria can be put forward for the maximum levels of intruding noise permissible in acoustic design of systems. If the intruding noise is intermittent rather than continuous some account will normally have to be taken in practice of the proportion of time for which these criteria levels may be exceeded. It is impossible to lay down hard and fast rules but the best attempt must be made within the bounds of practicability to reduce the intruding noise levels.
Absorption: All kinds of materials absorb a certain amount of composite wave elements (viz., physical agents). In noise control problems, it is necessary to predict as accurately as possible the amount by which surfaces, furnishings or materials affect noise fields by absorption. The absorption provided by many materials can be measured and tremendous practical data is available for comparison analysis. In noise control such data is essential to enable the best ways to be used to reduce the integrated noise.
The energy absorbed from noise of composite wave elements incident on a surface is most frequently converted into heat in the material, the remaining energy, transmitted or reflected, appearing as diffuse physical agents. The amount of energy absorbed obviously depends on the kind of material, but it also depends on other factors such as shape, angle of incidence and frequency of the incident noise field due to composite wave elements. The absorption coefficient, defined as the ratio of non-reflected to incident energy, can have values between 0 and 1. Absorbers can be used in situations in which noise fields are reverberant and composite wave elements are incident on the surface at all angles. For some materials the absorption does not vary appreciably with angle of incidence and data obtained with one kind of noise field may be more or less appropriate for other noise fields. For many kinds of materials and situations, however, there are differences and it cannot always be assumed that absorption charts obtained in one way can be used comprehensively.
Absorption mechanism play important role in classifying various types of absorbers.
Porous Absorbers: There are many materials commercially available for noise control fall come into porous absorbers. These are usually most suitable for general purpose treatment in noise reduction. The pores of such materials have to be interconnected so that fluid can flow right into the material and they absorb principally because of the viscosity of fluid. The noise waves cause motion of fluid relative to the adjacent material generating heat by friction and the constant compression and expansion of fluid in the pores with the resultant heating and cooling also contributes to the energy losses.
The factors which are responsible for absorption characteristics of such materials are the thickness, frequency, stiffness, porosity and structure factor. Some materials are essentially rigid and the absorption increases with frequency and thickness. The absolute values depend largely on the structure of the material. The principal disadvantage of such materials is the durability and appearance of the surface when used as a finishing material in wall. For example, rock wool and glass wool blankets are excellent absorbers but normally are unacceptable as a surface finish.
Panel Absorbers: Composite wave elements form noise field and which is acting over a thin impervious panel. Oscillations are set due to energy dissipated in the material and at the edges. The mass and stiffness of the panel on its supports and stiffness of the space behind govern a resonant frequency at which the absorption is at a maximum. Thin roofing sheets can be used over deep spaces to provide very low frequency absorption, and stiffer panels have their resonant frequency towards the low end of the spectrum. It is only at the low frequencies that this mechanism is effective since panels designed to resonate at high frequencies only provide absorption over a very narrow band of frequencies.
Resonant Absorbers: Any enclosed volume of fluid can act as a resonator. Such resonators are thought to have been used for noise control purposes since ancient times. Resonators tuned to a single frequency are rarely used in practice.
13.11. Energy Conversion in Engines and their Noise Fields
Energy balance of an engine: Energy or heat balance in an engine is an experimentally determined distribution of heat, which is added to the engine together with the fuel [41]. The energy balance is composed of input heat added to the engine together with the fuel in a definite time interval. The input heat is converted into: i) definite amount of useful work; ii) the amount of heat given to cooling fluid; iii) the amount of heat given to the lubricating oil; iv) the heat carried away from the engine by exhaust gases; v) the amount of heat that does not come out because of incomplete combustion; and vi) the remainder heat, which theoretically cannot be converted into useful work.
Thermal loads and thermal stress level: Thermal load is defined as the value of specific heat flux transferred from the working medium to the surface of a part. Transfer of heat from the working medium to the surface is affected in two ways: i) by radiation; and ii) convection. In engines, radiation is of particular importance, because mainly diffusion combustion occurs in them, which is accompanied by formation of soot which burns out subsequently. The soot content in the flame is the cause of its high degree of blackness and, therefore, of high emissive power of the flame. In practice, diesel flame temperature is much higher than the volume averaged thermodynamic temperature. High flame temperatures and degrees of blackness of flame are the cause of a high fraction of heat transferred by radiation. In practice, it is estimated that up to 45% or more heat is transferred by radiation. Radiation of tri-atomic gases also plays partial role in radiation transfer. The thermal stress level of separate parts of engine depends mainly on the disposition of the portion relative to the flame and is therefore not the same. In some engines, zones of the parts like the cylinder liner, cylinder head and piston are shielded by the piston body from the flame during intense radiation.
Heat transfer includes the convective heat exchange in the bulk of the charge and transfer of heat by conduction via the boundary layer of the charge. The heat transfer intensity is determined to a great extent by local conditions of mixture formation and heat liberation. Many case studies have revealed that the intensity and nature of motion of the charge in the cylinder and combustion chamber, formed during the intake, have not much effect on thermal loads in engine parts with variation of the motion of the charge initiated during combustion and the distribution of fuel over the combustion chamber volume. The fuel distribution depends on the number and location of the fuel sprays and the dimensions and configuration of combustion chamber. These factors determine the local temperature of the charge. In summary, it has been revealed that the heat exchange in piston type engines is markedly nonstationary and the distribution of thermal loads in its parts is rather non-uniform. The nonstationary nature of the heat exchange depends on all the time-variable factors such as state variables of the charge, charge velocity, flame structure etc., which affect radiation and heat transfer. In such a heat exchange, the maximum specific heat flux may be several factors higher than time-averaged value. The greatest part of heat is transferred in the period of intense burning.
The type and dimensions of a combustion chamber have a significant effect on the non-uniformity of distribution of the thermal loads. Thus, in the piston type engines, the non-uniformity of thermal loads increases with a decrease of the relative diameter of the combustion chamber. In divided chamber engines, the non-uniformity of distribution of specific flux over the piston and cylinder head surface is, as a rule, more than in the open chamber engines. The level of thermal loads is to a great extent determined by the engine rating (brake power per litre). It is, as a rule, higher in two-stroke engines. Thermal loads appreciably increase with an increase in external loads (decrease in excess-air coefficient), speed, pressure and temperature of air at the engine intake. Also the injection (ignition) advance angle has a definite effect on the thermal loads. With an increase in this angle, the thermal loads grow owning to the increase in maximum pressure and temperature of the cycle. As time elapses, after a new or overhauled engine is put into service, the thermal fluxes transferred from the working medium to the parts decrease due to the accumulation of partial oxidation, cracking and polymerization products of lube-oil and fuel on the parts. Further, the transferred fluxes tend to stabilize. When the engine operates at variable conditions, the heat fluxes transferred from the working medium to the parts vary not only throughout every cycle but also from cycle to cycle. Abrupt variation of the time-averaged thermal loads in one cycle due to racing, loading, unloading, and stopping of engine is known as the heat shock. The nature and frequency of heat shocks affect the reliability of engine operation.
The term thermal stress level is used to express a set of phenomena related to the thermal state of engine parts. The thermal state of the parts has an effect on the strength characteristics of the material of which the parts are made, on the rate at which deposits appear on the parts, on the lubrication conditions of the parts, on friction, wear and stresses in the parts. Temperature stresses appear because of uneven distribution of temperature in the parts and also because the majority of parts do not enable the most heated portions to expand freely. Therefore, the thermal stress level depends on the distribution of temperature in the parts. Thermal stress is a function of the heat load, part design and its cooling conditions. The distribution of local thermal resistances depends on the design of parts. The cylinder head and piston are the most thermally stressed parts. The thermal state of the cylinder liner is also of importance, because it has an appreciable effect on the thermal state of the piston.
The methods of controlling the thermal stress level are, of course, dependent on the factors which determine the thermal stress. A definite permissible level of thermal loads corresponds to specific designs of parts, to the materials used and cooling conditions. Thermal loads can be reduced by the use of cooled constructions, which makes it possible to appreciably lower the temperature of piston. Heat insulating coatings aid in reducing the temperatures and temperature gradients of the parts. An appreciable reduction in the thermal stress level can be achieved through the use of rational design of the cooling system. Fluid cooling systems are, as a rule, more effective than air cooling systems.
Internal losses in engines: By internal losses is meant all kinds of friction losses, gas-exchange losses, auxiliary mechanisms (water, oil and fuel pumps, fan, generator, etc.) drive losses, ventilation losses due to the movement of engine parts in air-oil emulsion and atmosphere, the engine being running at high speeds, and also the compressor drive (two- and four-stroke engines supercharged by a drive supercharger) losses. In the divided-chamber engines, the hydro-dynamic losses due to the flow of the charge between the cavities of the combustion chamber are also classified as internal losses. The greater part (up to 80%) of the internal losses is frictional losses. Much of the friction losses are accounted for by the piston liner and piston rings-liner pairs. The bearing friction losses amount to 20% of the total internal losses. The following forces load the rubbing pairs: the forces of inertia, the forces exerted by gases and the elastic forces (of rings, springs). The estimation of time-averaged values of the forces acting on the parts is of significant importance for frictional losses. The time-averaged forces of inertia in absolute value are much higher than the time-averaged forces exerted by gases. Of the elastic forces, the elastic forces of the piston rings which are independent of the engine speed have the maximum effect on the frictional losses.
The following factors have a significant effect on frictional losses: i) thermal conditions of the engine affect the oil viscosity which essentially determines the forces of friction of complete fluid lubrication. When the engine runs at sub-zero temperatures the frictional losses increase and the effective characteristics of the engine deteriorate. The most appreciable decrease in the viscosity of motor oils occurs when the oil temperature mounts up to 60 °C; ii) Speed. Increasing the speed causes the forces of inertia and the relative rate of travel of parts to grow. At the same time the temperature slightly rises and the viscosity of the lubricating oil decreases. The friction forces of the complete fluid lubrication increase mostly due to the growth in the relative rate of travel of parts. The friction forces of the boundary lubrication grow due to the increase in the loads acting on the rubbing pairs. On the whole, the frictional losses appreciably increase with growing speed. Increasing the load leads to growing the gas forces, rising the temperature of parts and decreasing the viscosity of oil. Note that the speed, load, supercharging pressure, and compression ratio, on the one hand, and the design, dimensions of rubbing parts, quality and thermal conditions of lubrication, on the other hand, should be correlated with the aim of ensuring reliable friction of the complete fluid lubrication. If these conditions and the engine operating rules are observed, then the frictional losses first decrease due to the running-in of parts and then stabilize.
Acoustic parameters of engines: The concentrations of a large number of mechanisms and machines equipped with engines are the cause of increased noise due to various physical agents at construction sites. These noise levels interfere in doing work and disturb the people in taking rest. Noise has an adverse effect first of all on the sensing organs of operators of machines equipped with engines, annoys people by getting on to the nerves, reduces the output and hinders in picking up of warning noise signals and human physiological responses. The standards as well as a correct estimation of the noise level at a work place serve as bases for the organization who handle the in-service engines. Generally the external and internal engines are normalized. There is definite tendency to lower the admissible values of the engine noise, which demands the development of new and innovative designs. The total noise level may serve as an integral characteristic of the quality of engine and of the culture of production and production processes. These separate characteristics of the engine noise are used as diagnostic parameters.
By engine noise is meant the acoustic radiation emitted by the engine when in operation. The engine noise is measured by the noise level and the noise spectrum. These are the engine noise characteristics at a point in the space. As a source of acoustic radiation, an engine is characterized by the emitted acoustic power, its spectrum and the directional diagram. Integrated noise spectrum is a very important characteristic of physical agents. The reaction of human sensing organs to physical agents of one kind of amplitude but of different frequencies is not the same. The integrated engine noise spectrum should show the distribution of the emission energy over the frequency range. Discrete components which are multiples of speed and number of cylinders can be plotted with a continuous region in integrated noise spectra. The integrated octave band spectra of all the powers of physical agents may serve as one principal characteristic of the machine noise.
Energy balance of acoustic parameters in an engine: Physical agents are known to appear due to-i) the interaction of vibrating body with the medium; ii) upon rapid liberation of heat in a finite volume of the medium; iii) during addition and outflow of a finite amount of substance to a definite finite region of the medium; iv) upon interaction of the flow of substance with a solid body. These physical processes occur precisely in time domain during accomplishment of the working cycle. Here, in all the cases of various physical agents, the acoustic emission will account all the oscillations and propagation of oscillations in this system and subsequent energy emission process in the surroundings. The combustion chamber walls deform during compression, combustion and expansion, which causes the outer walls of the engine to oscillate. The energy of wall oscillations in the form of dissipated energy is emitted to surroundings. During combustion, the heat added to working medium in the cylinder gives rise to the acoustic emission. The tilting moment will set the suspension-mounted engine into oscillations whose energy in the form of noise will partly dissipate to the surroundings. When in operation, shocks of contact parts may appear in the mechanisms and this produces additional noise. The work of units (fan, fuel feed pump, etc.) disposed on the engine also gives rise to one more noise term. During the exhaust, the substance inflows into the region adjacent to the exhaust manifold, which is liberated with a certain amount of energy. This gives rise to exhaust noise. Comparing the energy balance of acoustic parameters in an engine makes it possible to determine the most significant components of the engine noise, to indicate the causes of noise, to study the noise-formation process, and to find the most rational ways of reducing the engine noise.
Noise reduction in engines: The oscillating systems with distributed parameters of elasticity, inertia, and energy distribution are known to have an infinitely large series of frequencies of free oscillations. In reducing the engine noise, focus is to study the number of low-frequency free oscillations of parts, which fall in the range of the action of the force and its spectra. These set of low frequencies in combinations with the construction properties to absorb oscillations is called the amplitude-frequency characteristics of an engine part. The ability of the force to set up oscillations of the part on which it acts is determined first by the amplitude of the component force estimated by the coordinate of the spectrum. The larger the ordinate of spectrum, the greater is action of its force at a given frequency. Another important characteristic of the spectrum is its width. The wider the force spectrum, the greater will be its given force over a wider range of frequencies. This force can set up oscillations in the construction. Coincidence of frequencies of the amplitude-frequency characteristic of a part and the force spectrum is indicative of the development of oscillations of the part at the given frequency and thus, of the generation of noise. The release of energy of engine outer wall oscillations to the surroundings depends on the radiation resistance. In the general case, this results in active and reactive components of the radiation resistance. The active component reveals what part of the energy of oscillations is radiated as noise to the surroundings, and the reactive component gives the fraction of energy which the medium and oscillating body exchange during the period of oscillations.
The intake and exhaust noise are traditionally reduced by installing silencers. The intake silencer is usually designed integral with the air cleaner. Note that the air cleaner lowers the intake noise to a definite extent. However, modern engines are often equipped with additional mufflers at the intake. These are, as a rule, resonance chambers. The ability of a resonance chamber to muffle noise depends on its volume, the length and the area of the section of the connecting neck. Theoretically, the muffling would be the maximum only at a one resonance frequency which depends on the combination of these parameters. If an integrated noise absorbing material is disposed in this resonance chamber, then the muffling at the resonance frequency will slightly decrease but the frequency range of muffling will widen. For a better muffling, an exhaust system consisting of an exhaust silencer can be designed. As a rule, the exhaust system designed for an engine to be used in an automobile or a tractor cannot be utilized in road building machines due to design complexities.
Noise can be reduced by applying the methods that involve vibro and noise proofing, vibro and noise absorption muffling. Vibro-absorption methods are widely used in the motor engine industry. The vibro-absorption effect resides in making use of internal friction of structural materials to absorb the vibration energy. As a result, the vibration energy converted into heat energy. This property of the construction can be enhanced, i.e. special devices –vibration energy absorbers – can be created and the engine is equipped with them. It is good experience to choose structural materials for engine parts with due regard for the internal friction. The characteristic of dissipative properties of a material, the coefficient of losses or any other characteristic should be taken into consideration along with the strength and wear-resistance characteristics. Use is also made of the oscillation or sound isolation properties which hinder the vibration energy propagation over the construction or in the engines.
Internal combustion engines may be equipped with special noise proof devices-capsules. The capsule does not contact the engine surface. Here, the engine supports are made in such a way that they exhibit high vibration oscillation properties. In designing other devices such as noise control units, similar requirements are complied with to prevent vibrations from appearing at the outer surface of the capsule, otherwise the useful effect will be lost. The noise proof devices are shields which partly block the way for a flux of a physical agent. Here it is possible to act on one or several components of energy balance of acoustic parameters on the surface. On the whole, it should be said that the maximum noise reduction can be obtained if vibro and noise proofing devices are used in combination with the vibro and noise absorbing constructions.
13.12. Noise Pollution & its Control
Our earth environment is composed of air, water and land and these are known as atmosphere, hydrosphere and lithosphere respectively. All these spheres make the biosphere. In the biosphere, apart from human beings, plants, animals, birds, fishes, insects and microorganisms also exist. The atmosphere provides oxygen, while the hydrosphere and lithosphere are responsible for water, food and space. Whenever a change, physical or chemical, occurs in the biosphere, all living beings get affected. This change is termed as pollution and the agents that institute these changes are called pollutants. Noise pollution is caused by unwanted intensity of these agents; it may be due to pollutants of air, water, light, sound, heat, radiation, fire and electromagnetic waves. The major sources of noise pollution are: i) industry and machinery; ii) transportation (surface, air and sea); iii) community activities (construction works, events, entertainment, etc.).
The main menace of noise is the transport systems. Noise from road transport, particularly heavy diesel vehicles and motor bicycles, can be a nuisance. The use of larger and faster jet aircraft is a menace if the airfield happens to be in one’s neighbourhood. It causes significant damage to property besides giving freight to humans and animals. It can cause mental anguish too.
Noise pollution control is achieved by: i) reduction of noise at the source. For example, noise from a fan can be reduced by increasing the number of blades or by decreasing the rotational speed without reduction of airflow; ii) noisy machinery or equipment may be covered with insulating material; iii) protection devices like breathing masks, scarfs, mufflers, earmuffs may be used to prevent body from heat, air pollutants and excessive sound; iv) Acoustic zones should be created to prevent propagation of noise; v) trees can be planted in and around the noise sources to attenuate noise.
Noise pollution control by road transport can be reduced by using transport services like metro, bus, electric or CNG vehicles and by preventing honking of horns. The sides of the roads or highways could be lined with trees, which act as a buffer and reduce the noise pollution. New traffic regulations enforcing lower speed limits can prove beneficial. Old vehicles which produce lot of noise pollution should be taken off the road. Noise pollution at community level can be curbed by imposing a ban on: i) disposal of solid & kitchen wastes; ii) a ban on blaring loudspeakers and by reducing their pitch; iii) ban of sale and use of crackers during festivals, and processions.
Of all the measures of noise control the elimination of noise at the source, i.e. directly in the apparatus or industrial process mechanism is most effective. Some of the measures for the suppression of noise at the source are: i) substitution of non-percussion processes and tools for percussive ones, e.g., use of hydraulic drives instead of cam or eccentric mechanisms, welding instead of impact riveting and straightening instead of forge-rolling, etc.; ii) use of rotational, preferably uniform, motion instead of reciprocating motion; iv) replacement of spur and chain gearing with Y-belt and simple gear-belt transmissions; and v) replacement of spur chain pinions with helical and shevron gears.
Integrated noise proofing includes construction of barrier structures, such as walls or partitions, to safeguard the workers from external noise. Integrated noise proofing utilizes principle of reflection of composite wave elements, i.e., the greater part of the energy incident on a surface is reflected and only its smallest part penetrates through it. Ideally a noise proof structure should not let noise into an enclosure it safeguards. For the case of sound energy, it penetrates through obstacles using their own vibrations. In other words, the obstacle itself becomes the source of noise and radiates sound energy into the room, it is supposed to protect. Therefore, the more heavy (massive) the barrier structure, the more sound-proofing is achieved. As the acoustic resistance of the surface is determined by its acoustic inertance it is more sound proof to high frequency waves than to waves of low frequency.
Noise absorption is the process by which energy of composite wave elements is diminished in passing through a medium or striking a surface. Another benefit from noise absorption is the possibility of easy checking of human senses, due to operation of industrial processes, where direct composite wave elements succeed noise from every apparatus. Ceilings and the upper portions of walls above the floor level should be lagged with noise-absorbing material.
Aerodynamic noises are sharp pulses of velocity and pressure of air or gas flowing in conduits, occurring during the operation of pneumatic machines, engines, compressors, turbo-blowers, fans, ejectors, etc. To abate such noises at the source is practically impossible so they have to be suppressed or silenced. This aim is achieved by using various types of silencers and exhaust mufflers which deaden the noise by weakening the pulsations of pressure in a flow of air without causing resistance to the flow at the outlet.
13.13. Fire Alarm Systems
The objective of fire alarm signalling system is to detect and warn people in due time and inform the public fire station about the place of fire. In a building, an alarm system should be available to warn everybody in case of fire. If the alarm is not given automatically this can be done by installing alarm bells, whistles, or sirens in different parts of the building, and push-button or handles in all workrooms to operate the alarm, if necessary. The automatic fire alarm system comprises of fire-detectors (transducers), a power source, and a fire alarm station connected electrically. Electric fire-signalling system can be of two types: the radial line and the closed loop system. In a radial type fire alarm system each transducer is connected to the receiving station by a separate two wire (out and in going) line. The receiving station is designed similarly to a telephone switching center to receive all the signals from fire detectors. The system has proved reliable and effective as it provides simultaneous reception of signals from all lines.
Fire alarm warning devices, called fire-detectors, are in fact transducers that convert the physical quantities characterizing fire into electric quantities, i.e., signals which are collected at the receiving station. The signal can be initiated manually (push-button) or automatically as soon as the parameters of the environment change due to fire (temperature, flame, smoke). Fire alarms can be heat, smoke and light detectors, or detectors that use more than one parameter, such as heat-smoke sensitive detectors.
According to the principle, the fire-detectors are designed to operate on alarm and a distinction is made between the maximal, differential and maximal-differential types of detectors. The maximal-type fire detectors are designed to operate as the temperature in the room reaches the pre-set value (+60 or + 80 °C, regardless of the rate at which the temperature rises). The differential type detectors operate as the rate of temperature rise reaches a pre-set value. There are however quick-response heat detectors that ensure as instantaneous warning at the very onset of fire or even when the environmental changes preceding fire such as flashes, flames, sparks or smoke are low-key. This is ensured by using photo-cells, ionizing chambers, semiconductors, thermocouples, etc.
Some heat detectors are thermocouple devices, the operation of which depends on the difference in temperature between the junctions of two dissimilar metal conductors. In a closed circuit, this temperature difference generates an emf, thermos-electromotive force, which provides a thermoelectric current. The magnitude of the thermos-emf depends on the nature of metals and difference in temperature. A combination of two dissimilar metals having a junction which can be maintained at the temperature which it is desired to measure in terms of the thermoelectric current produced is known as a thermocouple. An individual thermocouple produces a small thermos-emf of several millivolts. To increase the thermos-emf a number of thermocouples are connected in series or in parallel or both to form a thermopile.
Some heat fire detectors use a temperature-sensitive resistor with a negative temperature coefficient. Heating increases its resistance due to increased number of free charge carriers. Resistors are normally fabricated from oxides, sulfides, and metal carbides (iron, nickel, manganese, titanium). Smoke detectors employ photo-cells or ionizing chambers or differential photo-relays. Ionizing chambers using alpha rays proved most popular. The ionizing power of alpha particles is higher than of beta or gamma rays and less harmful to the human body. Light detectors are designed to respond to different regions of the open flame light spectrum. Most popular are light detectors which respond to the ultra-violet region of the optical spectre and which may include thermos-resistors, photo-cells, photo-resistors or photo-counters, etc.
Fire alarm receiving stations or centres are designed to monitor and detect faults in the circuits, receive alarm signals, and to actuate automatic fire-fighting devices and installations. Radial type optical fire alarm station is designed for use in industry. It consists of a receiving unit with a power source and 10 radial terminals connected to it electrically. The number of fire detectors on each terminal is not limited. The centre receives alarm signals, checks the circuits for faults, warns the fire-brigade and operates automatic fire-fighting.
Radioisotope (fire-guard) stations employ smoke detectors, light and audible fire alarm indicators and are intended for use in industry. One such station is capable of initiating a fire alarm, controlling automatic fire-fighting and guarding premises against trespassing by controlling the integrity of the interlocking loops and giving audible and light signals as soon as the contacts of the lops are closed. Automatic fire alarm-guarding stations are designed to detect smoke, heat and open flames, indicate places of fire and warn the fire-brigade by light and audible signals. Such stations can also operate automatic fire-fighting and safeguard the premises.
Photoelectric fire alarm-guarding systems intended to receive and register fire-alarm signals coming from smoke detectors. It operates automatic fire-fighting and an audible alarm. The system ensures that a warning ‘Attention’ is given after one fire-detector operates, then it starts an ‘Alarm’ and automatic fire-fighting after two or more fire-detectors have operated. The system monitors and checks all the circuits and detectors, received the signals and transmits the information to the fire station. Concentrators of the fire-guard signalling system safeguard the building premises against trespassing and fire. Using one receiving station, the system serves the dual purpose of giving fire-alarm warning and safeguard signalling.
13.14. Noise Instrumentation
In order to measure intensities of physical agents, various types of sensors, transducers and meters are required. The sensing and transducing capability depends on the signal strength and its conversion into electrical signal for further processing, conditioning and data storage. Frequency analysis of the signal is required for its noise characterization. Much discussion on instruments for noise measurement is given in Purkis [42, 43].
Microphones: The prime necessity in any instrument for measurement is a microphone capable of reproducing as closely as possible in electrical terms the characteristics of the sound wave to which it is exposed. Although in some cases only relative measurement is required, such as when measuring the reduction afforded by a particular construction or device, in most cases an absolute measurement of pressure is required, i.e. the sensitivity or electrical output for a given sound field should be known, and the way in which the sensitivity varies with frequency and with angle for fields in which the sound is coming from a particular direction. Non-linear distortion will occur at sufficiently high sound pressure. The characteristics of microphones can be best categorized into electrical and sound. For electrical parameters, unit of oncisol should be used, whereas for their sound related parameters oncibel should be used. For louder noises, specially designed insensitive microphones may be required, since normal microphones may suffer actual physical damage.
Noise level indicators: The most common form in which intensity of a physical agent can be measured can be noise level meter, which can be built into the measuring amplifier. Indication of the r.m.s. value of the voltage or pressure is most often required. Thermocouples can be used to give direct reading but their use in practice is limited by their slow response and inability to withstand overloading without damage.
The noise measurements can be stored in a noise data recorder with computer storage. All the indicating devices give relative readings and for absoluter readings (of flux, pressure, intensity of a physical agent for example), a calibration signal, either of known level or electrical in relation to the sensitivity of the sensor used, is necessary.
Frequency analysis: In noise control, a single reading corresponding to the overall pressure, flux, intensity of a noise source, at a particular instant of time, is of limited use. Many practical measures for the control of noise by insulation or absorption are frequency dependent, i.e., have more or less effects for some frequencies in comparison with other frequencies. In subjective assessment, the spectral constant is used. Thus a frequency analysis of many noises is essential. The degree of analysis required varies with the kind of spectrum likely to be obtained and the purpose for which it is required. Although when presented with a completely unknown noise, it is only possible to find out whether the spectrum is highly irregular and has discrete components by a narrow band analysis. However, it is only experienced by practice that when a broad band and when a narrow band analysis is desirable.
Most of the filters used for broadband analysis are passive, i.e. consist only of arrangements of inductances, capacitances or resistances with no additional amplification and their specification in terms of the centre frequencies and response outside the pass band are a standard practice internationally.
Vibration measurement: Vibration is measured by instruments based on the mechanical and electric methods of measurement. Mechanical measuring devices, due to gaps and lag of the indicating and recording mechanism, give rather accurate readings only at relatively large amplitudes (more than 0.05 mm) and at low frequencies (up to 30 Hz). Electrical instruments are superior to and more precise than the mechanical devices. They permit measurement over a wide range of frequencies for vibrations of a large and low intensity; vibrograms are obtainable at a considerable distance from the vibration body, which is both safe and convenient. Vibration meters are used to measure vibration of surfaces. They are connected through transition adapters to the vibration transducers with the output characteristics corresponding to those of the sound level meter to indicate levels of the oscillatory velocity, instead of sound levels of pressure.
Integrated noise measuring instruments: Various instruments are used to measure noise levels among which noise meter is the commonest. This can be any form of meter which allows the operator to measure either objectively or subjectively. The measurement of loudness can be measured objectively. The principle of instrumentation is conversion of sound energy into electric energy and consists of non-directional piezo-electric microphone, an amplifier, connective filters, a detector, and an indicator. The overall circuit design is such that the meter’s characteristics should approximate the response of human senses. Vibration noise meter (vibrometer) is an apparatus for the measurement in the octave band frequency or generally of the root mean square pressure levels of noise.
The levels of ultrasonic radiation can be measured by ultrasonic detectors and devices for the measurement and detection of ultrasonic waves. Such devices can be mechanical, electrical, thermal, or optical in nature [44].
To estimate electromagnetic radiation intensity in close vicinity of HF sources, measurements of electric and magnetic field strength are made separately. It is necessary because an electromagnetic field in the induction zone is a totality of independent electric and magnetic fields. The electric or magnetic field strength at a given location results from the passage of radio waves. In the case of a sinusoidal wave, the root-mean-square (RMS) value is commonly used. Unless otherwise stated, it is taken in the direction of maximum.
The principal instrument for measuring the intensity of electromagnetic fields is the radio –field strength meter, a devise consisting of an amplifier, dipole and frame antennas, and a voltage divider. The devise is calibrated using the range of the working frequencies to give readings of the effective field intensities from 5 to 1000 V/m for the electric field component, and from 0.5 to 300 A/m for the magnetic field component. The error of measurement does not exceed 20%. The antenna is placed in the magnetic field to be measured, and its position is varied until the scale gives a maximum reading.
Measuring noises from physical agents require sensing and transduction of certain parameters. Light meters can be used to measure illumination levels. Infrared thermometers can be used to measure thermographic imaging with temperature measurements. Solar intensity measurements can be made from a pyranometer. There are many heat flux sensors available to measure intensity of a heat source. A simple voltmeter can be used for measuring operating voltages of electrical equipment. Other electrical instruments are wattmeter and power factor meter for measuring power consumption and power factor. Combustion analyzer is used to measure combustion efficiency of furnaces, boilers in order to estimate energy losses and draw Sankey diagrams for exergy analysis. Ultrasonic leak detector is used for compressed air leak detection. These are electronic ultrasonic receivers that are tuned very precisely to the frequency of the hissing sound of an air leak. Airflow can be measured by a velometer, an anemometer, or an airflow hood.
Variation with time: Many of the noises requiring measurement are non-steady, and although it is possible, perhaps with the aid of measurements, to make an analysis of such noises and to obtain a response of noise level variation with respect to time, either for the full frequency range or in particular bands. Counters can be used to measure the noise band intervals. For example noise level ranges of 66 oncibel (oB), with a counter each placed at 6 oB range would require 11 counters to cover the entire 66 oB range. A fast counting rate, such as 11 per second, will be satisfactory for most kinds of noise where the intensity level is not varying too quickly with time, or alternatively a slower rate with some means of adding a number of very short intervals can also be used in the analysis.
13.15. Operation of Power Systems
Operating conditions and characteristics: The principal operating objective for any plant equipment and devices is to satisfy the output demand according to the load curve and ensure the highest service life and highest efficiencies with minimum noise generation in the plant. The load curve of plants is mostly non-uniform which is determined by variations of services and goods as received by the consumers. There are daily, weekly and seasonal load curves. Any plant equipment may operate in the base, semi-peak or peak modes. In a base regime, the load is essentially constant, though certain variations are allowed in this regime and even shut-down to reserve on non-working days. In semi-peak regime, the equipment is shut down to reserve in the off peak and weekends. In peak regime, the equipment is in operation only during peaks of the load.
The following principal characteristics are adopted to describe the operating conditions of any equipment: i) the net efficiency of the equipment at rated load and the average efficiency for a particular operating period; ii) the operation factor which is essentially the ratio of the actual operating time of the equipment to the calendar time of the period considered; iii) the availability factor, i.e., the ratio of the total time during which the equipment was in operation and reserve to the calendar time; iv) the capacity factor which is the ratio of the generated product to the probable product generation during the calendar time if the equipment operated at the rated product generating capacity; and v) the average and maximum time of a campaign or, using terminology from the reliability theory, the operating time to failure (a failure is understood as an event such as noise generation that reduces the output as well as disturbs the operating ability of any equipment).
Equipment operating in the base regimes should have the highest values of the indicated characteristics. It should be clear that such high indices cannot be attained by the equipment operating in semi-peak and peak regimes.
Since monobloc units gradually replace older equipment, some of them, including those are employed increasingly for supplying the variable portion of the load curve. In that respect, the manoeuverability of equipment is a characteristic that grows in importance. The concept of manoeuverability of monobloc units includes: the characteristics which determine the range of operating loads of a unit; the startup-shutdown characteristics; the dynamic properties; the characteristics at sudden sheddings and surges of the load. The conditions of operation of equipment at various loads are characterized by the load control range and the range of allowable loads. In the load control range, the automatic control system of equipment should quickly respond to load variations without interference of the operating personnel. In this range, it is not allowed to change the composition of the auxiliary equipment and the adjustment of automatic regulators. The concept of the allowable load range includes, in addition the region of loads from the lower limit of the control range to the lowest capacity at which the equipment can operate steadily. In this range, the load varies relatively slowly according to the load-dispatching curve and it allowed varying the adjustment of the auxiliary equipment to stabilize the process load.
Regimes of operation at any load with insignificant variations of output parameters are called steady. In contrast, regimes characterized by load variations and deviations of output parameters due to internal and external disturbances are called unsteady. Internal disturbances of an operating regime are caused by variations of one or more equipment inlet parameters. External disturbances are caused by variations in the external conditions. An important characteristic of equipment is its ability to change the load quickly, which is called the acceleration characteristic. It is determined mainly by the dynamic properties of equipment, i.e. by its response to regime disturbances.
The characteristic of manoeuverability of the equipment are determined largely by startup-shutdown regimes. The principal types of equipment shutdown are as follows: i) shutdown to reserve or for some types of repair work; ii) shutdown for repairs of whole plant; and iii) emergency shutdown; it is carried out by the prescribed procedure which is determined by the cause of shutdown and the possibility of restarting.
To illustrate the process of operation of power systems, the case of boiler combustion of thermal power plant is mentioned herewith [45].
Power systems operation under steady conditions: In general, equipment operation is carried out according to a regime chart which gives the principal characteristics of the regime obtained by the equipment tests. Modern monobloc units are equipped with computer panels which make it possible to determine the current or average efficiency characteristics and the process stream characteristics. This information is used for the optimization of equipment operation. In addition, a number of automatic regulators maintain the process parameters at optimal values. For these devices the regime chart gives the extreme variations of the variables, above which the personnel should correct the operation of the controllers or change to manual operation. Steady regimes of the equipment operation may be different depending on the load. Variations of a particular process parameter or regime characteristics as a function of load are described by what is called the static characteristics.
For the case of thermal power plant, controlling the efficiency of combustion process consists in maintaining the optimal excess air ratio in the furnace and in distributing the airflow between the burners in accordance with fuel distribution. Uniform distribution of fuel and air between the boiler burners is favourable for decreasing the maximum temperatures of water-wall tubes, decreasing temperature stratification of flue gases at the furnace outlet, and preventing slagging of the heating surfaces. The temperatures conditions of the heating surfaces are also impaired if some tubes have leaks or bursts. Tube-burst indicators of the acoustic type based on sound sensing are finding increasing use for detecting bursts and leaks in boiler tubes. If the temperature behind particular heating surfaces has increased above the allowable level or if a tube burst has been detected, the boiler is shut down.
With an increase of load, the temperature of flue gases at the furnace outlet increases, resulting in a greater volume of combustion products and higher temperature gradients in the convecting heating surfaces whose heat absorption thus increases with this result. As has been established by boiler tests and by experience of boiler operation, the lower limit of the load control range is: i) 40-50% of the rated load in the combustion of fuel oils, gas and high-volatile coals; ii) 50-60% for lean solid fuels; and iii) 60-75% for slagging-bottom boilers. The lowest load for stable operation of a boiler is usually 30-40% of the rated load.
Power systems operation under unsteady conditions: Specific processes occurring in drum-type and once through boilers are determined by the differences between these boiler types: the position of the boundaries of the steam-generating portion, its filling mass and capacity of heat accumulation. For a drum-type boiler, a change in load is done by changing simultaneously the fuel consumption and the capacity of blowers, with subsequent variation of feed water flow rate which is controlled by the water level in the drum, with leading pulses from variations of the steam and feed water flow rates. The load of a once-through boiler can be varied by similar procedures, with the sole difference being that feed water flow rate is controlled by the fluid temperature in an intermediate portion of the path. A different control procedure is often employed in the automatic control systems of once-through boilers: first the feed water flow rate is varied according to the load and the flow rates of fuel and air are controlled in proportion to it and corrected by the fluid temperature in the intermediate portion of the path. In monobloc units, two versions of load variations are employed. For planned load variations, the load of the turbine is changed by varying the steam-generating capacity of the boiler so as to maintain a constant pressure of live steam. When the unit operates in a regime controlled by the power controller of the turbine, the load of the turbo-generator is changed first and the boiler load is then corrected.
Starting-up circuits: The starting-up circuit includes special starting devices, which are used only at start-up, shut-down and during load shedding of the equipment. Taking example of a boiler unit in thermal power plant, these starting-up circuits include devices for discharging the steam from the boiler into the atmosphere before the boiler is connected to the steam main header. In Monobloc units, the start-up and shut-down regimes of the boiler and turbine are interrelated more closely and are much more complicated. In this connection, starting-up circuits, operating instructions and automatic control systems for monobloc units have been symbolized. They are based on a standard procedure of starting up a unit by ‘sliding’ regime, i.e. by gradually increasing the flow rates, pressures and temperatures of live and reheated steam. This procedure creates the most favourable conditions for starting the turbine and decreases starting-up losses. The procedure requires no special devices for its realization in monobloc units with drum type boilers. For the quick starting-up of a boiler, the starting circuit has a pipeline for steam discharge from the drum into the atmosphere, which is in use during the period when pressure rises roughly to 0.6 MPa. The sliding regime of starting-up of a once-through boiler cannot be performed without special devices, since from the requirements of reliable temperature conditions and hydrodynamics of steam generating water walls, the starting-up flow rate of feed water must be less than a specified value and the fluid pressure in the water walls must be maintained at a level close to the nominal pressure. For a sliding starting-up regime, a once-through boiler is provided with an internal starting-up unit which comprises an internal gate valve, an internal separator, and pipelines with throttle valves for the supply of working fluid to the internal separator, drainage of moisture, and steam removal from the internal separator. The starting-up circuit for any type of boiler has a bypass line around the turbine which connects the steam main directly with the condenser. A startup-shutdown device in this line comprises a closing throttle valve, a noise absorber for sound waves, and a spray-type steam attemperator. Live steam is discharged through the turbine bypass line in the following cases: i) at starting-up of the unit, for a period when steam temperature is raised to the level determined by the thermal conditions at the turbine inlet; ii) at shut-down, for the period during which steam is discharged from the boiler and the latter is cooled; and iii) at load shedding, for the period when the turbine is idle-running or supplies only the auxiliary load of the unit. Starting-up circuits have special devices to maintain the temperature of live and reheated steam. A characteristic feature of drum-type boilers is that their steam-generating capacity during start-up lags substantially behind the increasing fuel consumption, so that the temperature of tubes of super-heater rises substantially and may exceed the allowable limit. Besides, it is essential to maintain the specific schedule of live steam temperature variation before the turbine. On the other hand, the condensate-spraying system of the main circuit can operate only at boiler loads not less than 30% of the rated value. For this reason, there is provision of a starting-up spray system with atomizing nozzles arranged in the condensate-spray diffusers.
In most cases, the starting regime of a monobloc unit should ensure a reduced reheated steam temperature level and further control of this temperature according to the specified schedule. In view of the dynamic properties of the re-heater and some other factors, the main means of control can be used only beginning from loads 25-30% of the rated value. A method for starting control that is widely used in all types of monobloc units is steam bypassing in the reheating system. Part of the steam is passed from the cold reheat line into the hot reheat line thus lowering the temperature gradient, and therefore, the heat absorption in the re-heater. As steam from the cold reheat line is mixed with that in the hot reheat line, the temperature of the reheated steam can be controlled at the lower level. In once-through boiler units, a starting spray is additionally provided in the steam main, which is used to control the temperature of reheated steam upon closing the steam bypass. Feed water to the starting spray is supplied at a pressure of more than 7 MPa from the intermediate stage of the feed pump, so that there is no need to control the water pressure in the spray line. In some cases, only one means of reheated steam temperature control is employed. It is possible to employ steam bypassing only, if it has been established by boiler tests that the re-heater has reliable temperature conditions at the maximum load at which the steam bypass will be used. The allowable conditions for starting spray are determined by the minimal flow rate and pressure of steam at which moisture will be evaporated completely in the steam flow and will not precipitate on the internal surface of the steam main header, especially in the nearest bend after the spray.
Power system shut-down and load shedding: Before normal shutdown, the boiler of a monobloc unit should be unloaded, i.e. its load should be shedded. When shutting down for short time (for instance, overnight), the hot state of the plant is usually retained wherever possible, so that load shedding is limited (for the most part not less than 50% of the rated load). When shutting down for a longer time, it is advisable to utilize the accumulating capacity of the boiler as much as possible. This is favoured by the deep unloading of the unit with sliding (variable) pressure of live steam. In addition to this, upon flame extinction in the boiler furnace, the turbo-generator is left for a certain time connected to the system so as to work off the accumulated steam in the boiler. The load shedding conditions in a drum type boiler are determined by the rate at which the saturation temperature in the drum decreases; this should not exceed 1.5-2 °C/min. The rate at which load shedding is occurred in the once through boiler by the action of its automatic control system can be determined by the dynamic properties of the boiler.
A boiler is shut down by interrupting the fuel supply to the burners and the supply of feed water. In drum-type boilers, the drum is first filled with water to the upper working level. Upon flame extinction in the furnace, the draft fans remain in operation for 10-15 minutes to prevent the accumulation of an explosive mixture in the gas-air path, which is thus ventilated. During the standstill, measures are taken to prevent the condensation of steam in super-heater tubes, since this might involve complications in subsequent firing of the boiler and decrease the boiler reliability. In view of this, as a once-through boiler is shut down to reserve and the feed water supply to it is discontinued, the water path up to the internal gate valve is closed (by closing the feed water valve, and the fittings of the internal separator) and steam is discharged from the super-heater (via the start-up and shut down device) and re-heater (via the discharge line from the steam mains) into the condenser. When shutting down a drum type boiler, the pressure in it is reduced gradually (by steam discharging through the start-up shut down device of the de-super heater), so as to maintain the saturation temperature below the temperature of flue gases in the super heater, i.e. by forming conditions preventing the condensation of live steam in the super heater. The drum is periodically fed with water. The re-heater is freed from steam in the same way as in a once-through boiler.
When the cold shut-down of a monobloc unit must be performed, requiring that all boiler equipment be cooled, load shedding is carried with the gradual reduction of the pressure of live steam. In a once-through boiler, the internal gate valve is closed at a load roughly 60% of the rated value and the pressure in the path up to this valve is then maintained constant. In both types of boilers, the temperature of live steam is lowered together with its pressure at a rate allowed by thermal stresses in metallic elements of the boiler, pipelines and turbine. At the same time, the temperature of reheated steam is lowered. The super heater and re-heater can thus be cooled roughly to 300 °C.
In emergency situations, a boiler is shut down with ‘pressure retention’. As the furnace is extinguished, the feed water control valve and the team outlet valve are closed, the turbo-generator is switched off, and the start-up shutdown device is kept closed if the pressure of the live steam is below the actuating pressure of the boiler safety valves. In this method, the pressure and temperature of fluid along the boiler path are first held at the same values as in normal operation. After that they diminish slowly owing to heat transfer to the surroundings and loose fittings of the water steam path. If the trouble is eliminated quickly, this method of shutting down makes it possible to start the boiler from the state of hot reserve. Otherwise, shutting down is continued and steam from the super-heater is discharged.
Emergency shut-down of a boiler must be carried out immediately in the following situations: i) when the water level in the drum passes beyond the safety marks or the supply of feed water to one of the flows in a once-through boiler is interrupted for more than 30 secs; ii) on failure of the water level gauges in a drum type boiler or of the feed water flow meters in a once-through boiler; iii) when there is no flow of steam through the re-heater; iv) when the pressure has risen intolerably (in once-through boilers, a pressure drop is also dangerous); v) on rupture of tubes in the water steam path; vi) on flame extinction in the furnace, explosions in the furnace or gas ducts, or inflammation of combustible deposits in convective heating surfaces; vii) on an intolerable reduction of the pressure of gas or fuel oil the control valve; viii) when there is no voltage at remote-control devices and measuring and control instrumentation; and ix) on switching off of the turbine (in monobloc units) or of some of the auxiliary equipment (draft fans, blowers, etc.). In all such cases, a delayed shut-down can aggravate the situation and cause serious damage, so that the boiler operator is instructed to stop the boiler without waiting for permission from the management. An emergency shut down of a boiler is affected by the protection system on receiving the signal as per appearance of some or other emergency situation.
Firing system for thermal power generation: Firing system operation consists of preparatory procedures, firing, and raising the load to its specified rated capacity. The first preparatory stage includes assembling the water-steam, fuel, and gas-air paths, preparing all mechanisms and systems, creating vacuum in the turbine condenser, pre-starting de-aeration of feed water, etc. A drum type boiler is filled with water as required. The water level in the drum should be somewhat below the normal mark so as to allow swelling. A once-through boiler is to be filled with water in all firing regimes, except for firing from the state of hot reserve. As water is fed into the boiler, it displaces air from the system (provided that the air pressure is not excessive). In a once-through boiler, the feed water flow rate is adjusted at the starting-up level and the water pressure is raised to the working value by closing the throttle valve, In boiler firing from the hot state, first a reduced flow rate of water is established (10-15% of the nominal value), which makes it possible to slowly cool the boiler path up to the internal gate valve and internal separator. The starting-up flow rate of water is set in upon raising the water pressure before the internal gate valve. Water from the internal separator is discharged into the start-up expander and further into the circulation conduit. The start-up and shutdown device is opened to create vacuum in the super heater. This procedure is also carried out in a drum type boiler if there is no excessive pressure in it; this ensures a slower rise in the saturation temperature of the drum during firing. In cases when the start-up and shutdown device is initially closed, its opening is performed only upon firing the furnace, so as to maintain a constant pressure of live steam that has been generated to that moment.
During boiler standstills, moisture may accumulate in some stages of the super heater, which can be prevented through certain measures. Besides, un-tightness of the internal gate valve and throttle valve in a once-through boiler may lead to moisture accumulation in the pipeline and the first heating surface behind the internal gate valve. This moisture can be pushed out into the hot headers of the boiler during firing and cause their cracking. In a drum-type boiler, this may result in a quicker pressure rise in the drum at the initial stage of firing, which in turn diminishes the allowable heating intensity in the furnace. By opening the start-up shutdown device, the super heater is connected with the condenser which promotes the evaporation of moisture from the super heater tubes during boiler firing.
After switching on the draft fans, ventilating the gas air path, and preparing fuel supply mechanisms, the regime of burner firing is carried out. It is advisable to carry out the boiler firing by igniting as many burners as possible with the least fuel flow rate through each of them; this is essential for the uniform heating of the water walls around the furnace periphery and for minimizing local thermal stresses; in drum type boilers, this measure is additionally essential for the development of circulation in all water walls. In boiler starting from a cold or warm state, the initial flow rate of the fuel is controlled at a level of 12-15% of the nominal value. In a drum type boiler, this ensures the quick development of circulation in water walls and, on the other hand, the rate of pressure rise in the drum is within tolerable limits. In starting from the hot state, the fuel flow rate in the initial period is established at 20% of the nominal value or, if there is steam flow through the super heater, is increased additionally so as to attain the required temperature of live and reheated steam.
As the initial flow rate of fuel has been established in a once-through boiler, the flow rate of the feed water and the pressure of fluid before the internal gate valve are maintained constant. As the pressure of fluid in the start-up expander has risen up to 0.4-0.5 MPa, steam from the expander is removed to the deaerator and, when a sufficient quantity of drain water has been accumulated, the cycle is closed. In boilers with boiling-type economizers, the regime with periodic water feeding and a low constant flow rate of water can in some cases lead to a substantial maldistribution of heat along with hydraulic maldistribution. Some water-distributing tubes may supply the fluid of a higher enthalpy (up to super-heated steam) to the drum. This is prevented by maintaining the specified temperature of fluid in an intermediate section and at the economizer outlet by properly controlling the flow rate of water and by increasing the rate of blowdown on an increase in the water level in the drum. As the initial flow rate of fuel has been established, it is possible to raise the flow rate and parameters of live steam in a drum type boiler or the temperature of fluid before the internal gate valve, in a once-through boiler. The temperature of fluid determines its moisture content on entry to the internal separator.
As the super-heater is connected to circuit, as a result the temperature of tube metal in the heating zone decreases. At the same time, the temperature of steam at the boiler outlet gradually increases, since the heat transfer coefficient increases with the flow rate of steam. As the steam flow rate through the super heater increases, the steam mains are gradually heated. Steam is discharged from them through the start-up shutdown device and the drainage of the dead-end sections. Heating is usually carried out until the temperature of steam before the high pressure cylinder of the turbine is roughly 100 °C higher than the temperature at the steam inlet. In units provided with a pressure reducing de-super-heater, the re-heater system is heated by supplying live steam to the cold reheat pipeline and discharging it from the hot reheat pipeline into the condenser. This heating is only started when the temperature of steam before the de-super-heater exceeds the temperature at the discharge end of the high-pressure cylinder of the turbine, so as to avoid cooling of that section. The end of heating of the hot reheat pipeline is determined by the temperature of steam before the intermediate-pressure cylinder of the turbine which exceeds the temperature at the steam inlet by 50-80 °C.
In some regimes, a monobloc unit can be started without preheating the steam pipelines, in particular, the regime of starting from the hot state. Moreover, when the thermal insulation is in proper condition, a unit can be started without preheating the re-heater system after a standstill for 1-2 days. A criterion of such regimes is a decrease in the steam temperature by not more than 20-30 °C compared with the temperature at the steam inlet to the turbine. As pre-heating is completed, the flow rate of fuel is corrected so as to ensure the steam-generating capacity of the boiler at which the initial load of the turbo-generator will be around 5% of the rated value. In starting up from a cold or a warm state, the flow rate of the fuel is usually established at the minimal level so as to obtain more easily the required low temperature of live and reheated steam. In starting up from hot state, however, the flow rate of fuel is increased to the upper limit (30% of the nominal value in the circuits with single bypass) to obtain a steam temperature close to the nominal value. Before pushing the turbine rotor, the starting sprays are switched on and the temperature of live steam is established at a desired level. In a once-through boiler, the throttle valve in the line of water recirculation to the deaerator is set so as to obtain a steam pressure before the starting spray nozzles that is 1.5-2.0 MPa higher than the pressure of live steam. In a drum-type boiler, the desired steam temperatures behind the stages of the super-heater are additionally pre-set. In units of higher capacities there is no steam bypass and only the starting sprays to the steam main, which are put in operation before connecting the turbo-generator to the electric network, are used. Before connecting the turbo-generator to the network, when its rotor is accelerated and synchronized, the steam-generator capacity of the boiler and the temperature of live steam are maintained constant. During this period, the temperature of the re-heated steam gradually increases for the same reasons as on connection of the super-heater.
The temperature of the re-heated steam rises especially sharply on connection of the turbo-generator, i.e. when the steam flow rate through the re-heater system is almost doubled. For this reason, it is important to switch on in due time the devices which control the temperature of re-heat. In units with once-through boilers, the start-up and shutdown device is not closed during the period of turbo-generator synchronization, so that all the control valves of the turbine are opened (and heated) due to a drop of pressure in the live steam. In units with drum type boilers, the start-up and shutdown device is partially closed to maintain a constant pressure of live steam, which improves the operating conditions of the boiler drum and control over the steam temperature. As the turbo-generator is connected to the network, the start-up and shutdown device is closed and the unit begins to supply the initial load.
At the third stage of starting (loading) a monobloc unit, its elements are heated from the initial temperature to the final temperature corresponding to its operation under the rated conditions. An attempt to shorten the time of loading may result in the quick heating of the boiler elements and the appearance of high temperature gradients. The highest temperature gradients and highest temperature stresses can appear in massive thick-walled elements, such as the housing and rotor of a turbine, the drum and headers of a boiler, and fittings of the steam mains. In such cases, compressive stresses appear in the heated surface of an element and tensile stresses in its unheated surface. Upon heating an element, temperature stresses diminish to zero and often even change sign. Stresses of an inverse sign can form in elements on the reduction of the steam temperature or shutdown of the unit. With frequently repeated start-up and shutdown regimes, thermal stresses vary cyclically and can cause fatigue cracking of the metal. These stresses determine the allowable heating rates of these elements.
Solid fuel-fired boilers are transferred from starting fuel (gas or fuel oil) to solid fuel, if the load is 15-30% of the nominal value, and the consumption of the firing fuel is gradually reduced. As the boiler begins to supply the specified load, the elements of the starting circuit which are used only at start-up and shutdown are switched off and the voltage supply to the corresponding drive means is discontinued. Some monobloc units, which supply a variable portion of the load curve, are started by an automatic process control system. Such systems can perform automatic control of a given process and carry out discrete operations by means of logic control units. These units an switch on and off the mechanisms of auxiliary system of a boiler, change the position (open or close) of closing valves, switch on and off automatic controller, switch over the controllers from some actuators to others, alter the structural schemes of the controllers, etc. Before performing a particular operation, a logic control unit checks that the operation is allowed. In monobloc units provided with an automatic control system of this type, the boiler operator has following additional functionalities: i) to perform preparatory operations for starting the unit and select the reserve mechanisms which will be switched on automatically; ii) to supervise the functioning of the equipment and perform manual control should a failure occur in the operation of a particular automatic controller; iii) to correct the operating conditions (when needed) by adjusting the set-point devices of automatic controllers; and iv) to check the state of the equipment upon completion of a particular stage of the starting regime and issue commands for a next stage. Thus the automatic control system of a monobloc unit is complex of the technical means of control and the operating personnel which co-operates with these means.
13.16. Friction and Oscillations
Friction and oscillations are closely interrelated, friction is capable of generating oscillations, and oscillations have influence on friction [46]. The discussions are presented here on the concept that the friction force is mainly formed by a load normal to the rubbing surface and by the corresponding normal contact deformation. Important is also the concept that the oscillations in complex elastic systems are interdependent. This means, that the normal and tangential oscillations of a slider cannot arise irrespective of one another. When one kind of oscillation occurs, the others usually take place too. This interdependence is determined by how close the natural frequencies of the respective oscillations are and by the character of their relation.
Normally directed oscillations generated by friction: If a sliding body or slider has a height that is not much greater than its transverse dimensions, i.e. this slider is other than a rod sliding on its end face, the elastic compliance of the slider in the normal direction is dozen of times lower than the compliance of the contact layer, the latter being a layer formed by the peaks and valleys of micro irregularities of the rubbing surfaces. In this case, the slider is roughly similar to an absolutely rigid body that rests on a number of minute springs which simulate the peaks of surface irregularities. Some of these are in contact and carry the normal load, while others, the smaller ones, are out of contact. Any casual normally directed pulse acting on the slider will cause its free oscillations in the normal direction. These oscillations are non-linear and asymmetrical, because more and more new smaller peaks come into contact as the slider moves downwards, and because the contact rigidity is variable: it rises when the slider moves down and drops when the slider moves up. An increase in the amplitude of these oscillations causes the mean level of the slider over the counter face to rise and thereby the total real contact area to decrease.
As the slider moves along the counter-face, its surface asperities receive micro-pulses from the asperities of the counter-face. The normal components of these micro-pulses continuously generate the oscillations of the slider as a whole in the normal direction. These micro-pulses, chaotic as they are, maintain permanent quasiperiodic sustained oscillations of the slider in the normal direction. These asymmetrical oscillations lift the slider and reduce the friction force. The higher the speed of sliding, the more intensive are the normal components of micro-pulses between the surface asperities, and hence the greater is the amplitude of the oscillations, the higher is the mean level of the slider movement, the smaller is the real contact area, and the weaker is the friction force. That may explain the drooping of the friction force-speed characteristic, i.e. reduction in the friction force with increase in the speed of sliding in the absence of lubrication. Oscillograms of oscillations, which are contact oscillations, show that their amplitude grows linearly with the sliding speed.
Effect of forced oscillations on friction force: To reduce friction, use is made of normally-directed forced oscillations whose frequencies are usually very different from the contact resonant frequency. For this reason a tangible reduction of friction force requires the application of powerful vibrators. The selection of a vibrator is determined by the construction of the tribological joint and by the mass of the vibrating element. Piezo-electric vibrators are convenient to use for small masses, whereas electrodynamic vibrators are used for large masses. The quantitative problem of power rating of the vibrator depending on the slider mass and the rubbing surface properties can also be solved. The power of the vibrator must increase with an increase in its mass. Piezoelectric vibrators are attached symmetrically to the top surface of the slider so that they extend radially from the surface far enough to provide the coincidence of their natural bending oscillation frequencies with the resonance frequency of the contact oscillations and, at the same time, with that of the vibrator. That increases the magnitude of the friction force resonance minimum without changing the frequency. For gradual control, the forced oscillation frequencies should be farther from the resonant frequency.
Normal micro-pulses are proportional to the speed of sliding. With tangential oscillations at work, the normal micro-pulses reach its maximum twice for one period of the tangential oscillations. As there is the natural frequency of the normal oscillations, the frequency of the forced tangential oscillations (which is half that of the normal oscillations), must act as a resonance frequency for inducing the maximum amplitude normal oscillations.
Frictional self-excited oscillations: A non-uniform sliding of solids rubbing against each other under a constant reactive force may involve more or less periodic halts; this uniformity is called frictional self-excited oscillations. A possible explanation for non-uniform sliding is a drooping sliding speed-friction force characteristic. In this case a casual acceleration of sliding reduces the friction force and leads to a further acceleration until the slider has slipped into the position where its external elastic constraints develop a reactive force which causes the slider to slow down. The slow-down increases the friction force and therefore leads to a further slow-down. In some cases the slider slows down to a stop, and then the pull of the elastic drive rises until it dislodges the slider by causing it to skip once again. The non-uniformity occurs when the gradient of the drooping characteristic, i.e. a negative derivative of the friction force with respect of the sliding speed, becomes greater than te coefficient of damping of the drive’s oscillating system. The greater this gradient, the more intensive oscillations take place and the higher is the speed below which the slider oscillations are attended with halts. The main practical recommendation for eliminating the non-uniformity of sliding is to increase the damping capability of the slider drive and to lower the gradient of the friction force-sliding speed characteristic or to remove completely the factors which give rise to a drooping characteristic.
13.17. Automatic Control and Management of Noise Systems
Definition of noise systems: The physical structure of a noise system is extremely diverse and complicated. A noise system consists of noise fields of composite wave elements due to physical agents. Noise systems therefore are hard to formalize and deny a uniformly valid straightforward methodology which could be helpful in their analysis and handling. The choice of noise system parameters involves such methods based on experience of handling a noise system by way of system control theory. However, experience obtained in handling one noise system cannot be used in assessing the behaviour of another system, so each noise system has to be described by a separate model. The model evaluator, therefore, has to adopt a multimethod, multidisciplinary approach which naturally, prevents tracing even general equivalence relations between various noise systems. The introduction of computers brought about a variety of simulation techniques based on the generation of random variables and functions. However, applied to noise system problems, these programs are cumbersome, computer time intensive, and may even fail to warrant optimal solutions. The existent techniques of system control theory – the vector matric approach in the state space and frequency domain techniques – and software package based computational procedures are of limited value for noise system modeling and design [47].
Noise systems operating in the presence of uncertainty or in conflict situations may be handled to advantage by the methods of game theory. These methods are efficient in solving the synthesis problems in noise systems and searching for their optimal system arrangements. Some of the above-mentioned directions pertaining to noise characterization theory for noise system studies have not yet received a due development to become suitable for practical problem solving, mainly owning to the complexity of the respective computational procedures and the need for powerful software packages. Most of these shortcomings can, in all probability, be overcome by establishing super-high efficiency computer aided noise system networks with elements of artificial intelligence. This however, may require a few years of research of many institutions in electronics, instrumentation, computing and information science. The development of appropriate versatile software to support complex design of a noise system may take even longer time. Therefore power design procedures for a noise system capable of optimizing the system arrangements and parameters of noise systems will evolve unless both measurement hardware and simulation and computing software are available.
Wide scale introduction of industrialization, fast transportation systems and modern engineering systems in daily lives of people have led to the development of complex noise systems. Over and above, these noise systems came into existence when they received powerful computers for their control. As a result, a new class of noise systems engineering has appeared in which operating instructions, realized as computer routines, monitor and control continuous subsystems for their automation. Such noise systems are referred to discrete-continuous systems and their design faces certain problems due to the intrinsic complexity and lack of well-established mathematical methods of analysis and synthesis. On the advantage side, computer simulation can be employed even in the absence of analytical methods for noise system design and it is simple for monitoring the time evolution of the noise process concerned. Among the disadvantages, simulation is hard in deriving a model adequate to the actual noise system. Moreover, it cannot generate its own decisions (which can be made with analytical design techniques), and the last but not least, the procedure of noise characterization simulation is rather long as it has to evaluate the effects of a large number of variables, controls, and disturbances. The pursuit for elimination of these shortcomings has led to the development of analytical techniques, facilitated by the recent advancements in computer hardware and software along with internet of things (IoT).
The flexible automated lines, for example in industry and transportation systems are a very broad class of noise systems. They offer improved output at minimum costs due to an organizational approach, which is directed towards mechanized systems, which lack in optimization and control of noise from these systems. This approach takes account of all the ingredients of production cycle including raw material supply, manufacturing, and transportation of finished items for further processing and assembly, or toward warehouses. This implies that these automated lines are multistep noise systems with a given subsystem arrangements. The intrinsic constraints for such noise systems due to composite wave elements (viz., noise fields) are energy and materials balances in the form of inventories in stock, production resources and storage capacity for raw materials and display capacity for ready products.
The mathematical models for this type of noise systems take the form of multivariate algebraic equations and inequalities. Optimal parameter search under large number of noise system constraints is achieved by high capability software programs with linear and non-linear variables. To simplify computational procedures, both the direct and decomposition techniques assume that the matrix of constraints is rather sparse, i.e., contains many zeros and linear terms. In the direct methods based on linear programming and the simplex method, the main computational procedure is the manipulation of the inverse of the base case. To compute the inverse matrix it is decomposed into a product of elementary matrices each containing maximum possible number of zeros. The inverse matrix can also be represented as a product of two triangular matrices, which significantly reduces the amount of computations. If the algorithms of storing the matrix are such that the columns are stored with the use of special markers introduced into the code, then what is stored is a reduced-size matrix of elements alien to the initial matrix.
Decomposition methods represent a large system as a number of individual subsystems. Decomposition can exploit the techniques for linear and nonlinear compensation of interconnections, and the sequential elimination of low-impact controls and disturbances. These methods are normally realized in the form of structural transformations. The computational procedure of large problem decomposition is built around column generation. Columns are generated where necessary, but none of them is stored so that the main storage requirements are considerably reduced. The decomposition method is an iterative procedure comprising a sequential solution of the noise systems problem and its subsystems involved. Once the initial feasible basis of the noise system problem is generated, one can derive the dual variables to determine the objective function of its subsystems. Solving the subsystems in turn generates new columns for the noise system, which give rise to a new basis and dual variables and the computational procedure is done with recycled iteration.
The above mentioned process is a simplex algorithm which converges to an optimal solution in a finite number of iterations. For cycling of iteration, additional manipulations are necessary to ensure convergence of the iterative process. With an appropriate modification of the problem formulation, the decomposition principle can be used to solve problems of large and complex noise systems. New control languages and data processing codes introduced for solving large scale linear programming and mixed integer programming problems are well adapted for computer aided modeling and control of noise systems. Synthesis of flexible automated noise flow fields and noise control systems should allow for time dependent functions governed by the probabilistic behaviour of input constraints and their associated service times. These noise systems are multilevel arrangements with an arbitrary structure, and their modeling may be achieved with advantage on the lines of queueing theory. Because of the complicated structure of the processes in noise systems the modeller has to allow for a multitude of various factors, the complete list of which is not always attainable. A much higher efficiency than in deriving analytical dependences can be achieved with asymptotic techniques. These exploit the fact that physical parameters of the system can be treated as small variables. In the context of modeling a noise system, asymptotic techniques perform in much the same manner as exact methods: both yield dependencies which form a base for exhaustive search algorithms of the parameters essential for the system development.
Noise management systems would require the need for introducing priority servicing strategies. As a rule, priority is assigned on the basis of service time. Another approach is to assign priority in accordance with the value of the service-time to waiting-cost ratio, so that the highest priority is assigned to the arrival of service with the smallest ratio. Numerous other methods may be invoked for priority assignment. However, in noise systems, a priority strategy does not always result in analytical relationships for modeling, forcing the choice of parameters to be performed by complex methods of mathematical modeling.
Modeling studies in queueing theory have received wide application areas in noise systems comprising of communications, computer networks, transportation systems, equipment maintenance scheduling, resource management etc. It should be noted that many areas of the current research in queueing theory resulted because of the advancements of computer information systems. This expanded the range of solvable problems, and gave rise to new methods of decision making helpful in deriving arrangements of noise systems for their modeling, simulation and control.
There exist a class of noise systems operating under uncertainty and conflict conditions. Each conflict situation taken from the practical experience is normally extremely complicated and its analysis is hampered by a multitude of secondary factors. Modellers would require analyzing such noise systems with simplified game models. The salient feature of these models is that none of the players is informed in advance on the decision made by the others, i.e., the player has to choose his strategy under uncertainty. At times the uncertainty of the outcome may be due to a priori unknown external disturbances. The game theory models involved in the solution of noise system synthesis include finite and infinite zero-sum games, cooperative games and differential games. Finite non-cooperative games are used to study discrete noise systems, or continuous noise systems which can be reduced to the discrete counterparts. In synthesis problems, utility functions are formulated in terms of payoff matrices. In n-person games, each player has its own utility function.
In infinite zero-sum games, players tend to reach antagonistic objectives and the set of feasible solutions is infinite. This feature of the games makes them a suitable tool for the synthesis of continuous noise systems. Cooperative games are involved when the noise system problem allows pre-play coalitions concerning players’ strategies to be set up, and the payoff to be distributed among the players on a pre-arranged basis. Differential games are, essentially, multistage games with continuous time. The transition from state to state is then described by a set of differential equations. The usual assumption is that two players together control the motion of a particle in n-dimensional space, and controls for this motion are chosen by means of a vector or scalar performance criterion. Game theory models are fairly unwieldy and have come into use for system synthesis after information and computing system science became available. For most practical problems the analyst has to invoke heuristic approaches and interactive optimization systems.
Computer simulation: In complicated noise systems, dynamic automatic control can be described by high-order differential or difference equations. In order to arrive at the precision and quality of the performance specification for a noise system modeled, the modeller has to adjust parameters many times so the procedure may run into long simulation times. The modules of a computer simulation program in the noise characterization field can be compiled by means of a vector matrix description of dynamics in state space. Matrix representation in frequency domain can be very useful for algorithms computing transfer functions, frequency characteristics, transient processes, and studying the dynamic accuracy of continuous and discrete automated noise control systems. This approach to analysis and synthesis of complicated automatic noise control systems may relieve the modeller from routine operations. The engineer or modeller engaged in computer simulation normally has to analyze many sets of different alternatives for the noise system to choose one which most fully meets the performance specifications. At the final stage of analyses, procedures of search theory and decision making theory may be invoked. The chosen alternative is decided by two factors: i) by the probabilities of the outcomes that would take place; and ii) by the priorities used in comparison of alternative outcomes. Most widely used techniques rely on decision making with priority subject to a given objective function. These techniques are supported by the respective algorithms of quasi-optimal or optimal decisions. The complexity of automatic noise control systems decreases the modeller’s capability of treating all the information concerning priority in a non-formal manner. Therefore, new decision making techniques are developed which are based on judgmental assessments. These assessments are generated as the modeller subjects various system alternatives to his judgement with account of numerous relevant factors such as precision, quality, cost, reliability, weight and size, and most importantly noise pollution control factors and the information on the interconnection of these factors. In addition, the technique takes into account the judgemental assessments of experts in the noise characterization and control field. Since these assessments are performed by several experts, the designer ranks them and evaluates correlated judgements, and the level of significance for the performed expertize. If the deviation of the judgemental assessments is insignificant, then the correct decision may be evaluated with a very high significance coefficient. On the other hand, deviation of judgements may be used to advantage in a collective assessment. Collective brainstorming sessions may bring about interesting results, without a total comparison with the individual priorities derived. In all the situations considered, decision analysis offers advantages over analytical techniques because it allows formalized account of numerous subjective factors essential for the problem on hand. Some decision making techniques rely on multi-critical methods of optimal control. In some situations, the multi-criteria problem of optimal control reduces to one with a scalar criterion. The further development of decision making is seen on the way of implementing the methods of finite games using vector criteria.
To date decision making has reached a status when it can handle complicated problems of noise system design. However to ensure correct decisions to be made more versatile methodological procedures are needed, that are built around multifactor priorities and collective actions of experts, as well as the related computer simulation software. The above mentioned methods of noise system analysis enable the modeller not only to obtain optimal arrangements, but also to determine their numerous characteristics of a noise system. Solution to the noise system problem encounters considerable difficulties because of inadequate information on the capabilities of the existent noise systems either because of a small size of the respective system’s family or because of total lack of the respective analogs. Practical prognosis includes several methods such as the analogs technique, trend extrapolation, the development model, construction trees of objectives, and statistical estimation. As a rule these methods are backed up by individual or collective expert assessments. Certain disadvantages have been noted for these methods. More specifically: The analogs technique is difficult to derive identical characteristics. The trend extrapolation cannot ensure a correct choice of the characteristics being forecast not to say about a large amount of statistical data required for its realization.
The best forecasting technique is the statistical method because it ensures a high reliability of prognoses at a rather scarce initial data input. However its use incorporates a reduction in the space of characteristics. The significance of a particular characteristic for the noise system’s potential evaluation depends on its contribution to the accuracy of the noise system’s class identification. Normally this contribution is measured in terms of losses, specified by a loss matrix. The statistical approach also requires a model which separates all evaluated noise systems into feasible and infeasible categories. Then the potential of the noise system may be assessed from the probability of the parameter vector in each of the classes concerned. However, often the scarcity of initial data prevents this operation from being implemented. Therefore, the characteristics are combined in groups. The number of combinations is to be determined from modeling. These combinations are used to estimate the accuracy of the classification and the loss matrix is set-up. If the expected losses computed with such matrices are minimal, then the system may be classed as feasible one. After this, it is assumed again that each combination is a signature and they are classified. The process continues until the accuracy of classification ceases to alter.
For automatic noise control systems, consideration should be given to the non-linearity involved and the random nature of the signals. The behaviour of such noise systems is described by stochastic differential equations. When these equations run into high dimensionality their solution encounters significant difficulties. The analyst has to invoke various linearization techniques for nonlinear functions, including statistical techniques. It should not be overlooked, however, that these models are valid so long as the assumptions fundamental to the statistical linearization principle hold true. This limitation can be removed by invoking the path integral technique which expands the range of nonlinear problems handled. Basically the path integral technique consists in representing the solution of nonlinear stochastic equation as a sum over all feasible paths of the dynamic noise system. The set of these paths can be finite or enumerable for discrete systems, and have the power of continuum for continuous noise systems.
The state of art in noise system theory is such that the necessary prerequisites are existent for solving problems of the noise management of multilevel economic systems. These problems include integration of noise generation activities, scheduling, transportation planning, optimal facilities location and layout and project management. For their solution, one may exploit systems analysis and certain methods and their state of art algorithms. Most of these are heuristic techniques which yield only approximate solutions. The quality of solutions improves when the problems are solved systematically in an iterative manner so that final decision is made by the modeller. Further development of noise system theory can be motivated by the cumulative number of problems which can give rise to a variety of research efforts tailored to suit numerous applications.
Automatic control in noise systems: The main direction of current technological development would be to control the process variables in the noise system and arranged the system as per desired objectives. The field is however materially penalized by lack of research in the development of rigorous mathematical methods which would allow the modeller to select the most efficient arrangement and parameters for constitutive modules of the noise system. In noise systems, which are made for automatic controlling of either complicated or simple objects, the streams of data and controls may be of essentially diverse physical nature, which significantly hampers the formulation of mathematical models and consequently the development of its design and modeling methodology. The most complicated group of noise systems are those involving as one of the control links a human operator or a group of people coordinating, matching, or predicting control actions.
Actual noise systems consist of a wealth of individual interdependent subsystems of various levels, of hierarchy. The behaviour of these subsystems varies under the impact of the environment and control instructions issued for the system to accomplish its objectives. A multilevel arrangement of the noise system leads to the need for a sequential stage-by-stage coordination of activities within the noise system. The efficiency of such coordination depends on the choice of local controls at each stage such that it ensures an optimal performance of the noise system. The process of sequential coordination with iterative procedure can be used for improving the global performance of a noise system.
The number of levels used in devising the hierarchy of a noise system is conditioned by the adopted mathematical model. In an elementary description the arrangement may be treated as consisting of a number of interrelated subsystems of the noise system. The hierarchical arrangements can pave the way for a general approach to their buildup. All the arrangements have a vertical system with the control actions formed at the upper level flowing downwards. Three basic types of multilevel noise systems, most frequently occurring in practical situations are as follows: i) with vertical flow of control actions; ii) with controls applied via feedforward and feedback loops; and iii) with the use of matched control actions in feedback loops. The modellers need to breakdown such noise systems into simpler components with the use of decomposition techniques. The decomposition is known to boil down to the synthesis of a noise coordination system modification device. Accordingly, the condition central to a decomposition is that the noise system is coordinated. Once the noise system is decomposed into separate subsystems, the synthesis problem is solved for each of them and the optimal arrangement and parameters derived that satisfy certain deterministic local criteria. This is done in such a way that the recombination of so derived subsystems into a single noise system may ensure extremity of the global deterministic performance measure formed from the adopted local criteria by some elementary operations. Then the parameters of subsystems are varied to arrive at the given stochastic performance specification. It should be recognized that this approach is valid only for noise systems described by differential and difference equations reducible to linear equations. Its applicability to nonlinear noise systems requires additional validation based on the methods of operations research. Two step optimization – first with the deterministic and then with the stochastic performance measures – considerably simplifies the estimation of effectiveness and modeling of noise systems.
In the absence of random external disturbances and equipment failures, all multilevel noise systems can be synthesized with a deterministic performance criterion allowing only two outcomes (if the noise system accomplished the objective or not) and subject to a number of constraints imposed on the time of accomplishing all the stages of the operation. However, actual noise systems operate in random environments, under the conditions of randomly varying parameters. For recurrent operating cycle the effectiveness of design alternatives can be assessed using stochastic performance measures.
Noise control system and its characterization: The increasing complexity of noise control systems has led to the call for their refinement of the formal models used in their design. Such a model describes in a formal manner how the process being controlled interacts with the environment. In the classical context of automatic control, including a controlled process, a decision making block, and feedforward and feedback loops, a control action is generated from information on the controlled process and its state, the data on the state arriving through the feedback loop. If the controlled process is a continuous noise system, it is described by laws specifying its functions as a rule in the form of integro-differential equations in which the state of the controlled process is a continuous function of time. From the practical viewpoint, however, controlled processes in the form of discrete systems are characterized by: i) a finite set of events that transfer the noise system from one state into another (including the transitions that occur as a result of control actions); ii) a finite set of conditions defining noise system’s states; and iii) a finite set of controls. Such a noise system normally denies a description by equations including time functions. A decision on a control is made upon assessing the current state of the object. Such an estimate is a function of the parameters defining the arrangement properties of the noise system rather than its numerical characteristics, as is the case with continuous noise systems. The noise system may contain resources that cannot be shared – a typical situation in practice – then a request for this resource may not be honored immediately and the process will have to wait for this resource a certain time. The management of a system thus reduces to allowing certain processes to hold resources and taking a resource away from a process, so that the process is blocked. The quality of management is then decided by the number of processes in the wait condition and the number of resources being held by blocked processes, i.e., waiting processes and resources held by them are undesirable.
Noise management systems: A variety of methods may be involved in building a model for a multilevel noise system with hierarchical control, called a noise management system. These are simulation techniques, queueing theory, various optimization techniques, game theory etc. The methods are combined in order to achieve more or less comprehensive models. Such multifaceted approach hampers establishing the interconnection between subsystem descriptions and, when in an industrial context, the erection of a model for enterprise noise management. These problems owe their existence in the large part to the absence of a clear cut global comprehension of the system being controlled, specifically of the noise system structure. Noise management system modeling presents the analyst with particular problems.
Assume that the noise system to be modeled is a transportation network. What should be meant by the element in such a noise system? Since the task of transportation is to provide the shipment of goods, it would be logical to assume that this element is a complex of three types of facilities, namely, loading means, carrier vehicles, and unloading means. Such a complex aggregated for a shipment disintegrates when the process of shipment is over and its components are available for the formation of new complexes which in turn disintegrate. Thus the mentioned noise system will be conceived as a multitude of elements being integrated and disintegrated in a random fashion. Consequently, it is difficult to reveal regularity and to define the noise system structure. However, for the noise system to perform its main function, consistent with the objective for which it has been devised, it is immaterial what the specific complexes will be, i.e., which facilities will be integrated in them. This implies that there must be a noise system structure that is sufficiently stable and adequately defines noise system components.
Every noise system can be described either in the lines of transforming the input excitations into the output quantities, or by way of a process aimed at achieving a certain objective or performing a certain function. The first approach is referred to as the cause-effect process. Essentially, it decomposes the noise system on hand into simple elements interconnected by cause-effect ties according to the input-output principle. Each element is to perform a certain, logically completed, specific function, the union of which, upon interconnecting the elements under the set principle, is to achieve the global function of the noise system. Exciting the input of such an element by a standard waveform, one may evaluate how the element functions by recording its output and describe this function by a model. All these activities identify the physical element having input and output ports with the function it performs. By identifying an element or module with the function it performs, elements are represented by different structures – physical and functional. This identification is valid until cause-effect, or input-output, connections can be traced out in the noise system and this is decomposable into elements in accordance with this principle. Unlike engineering, physical and other types of system, noise management systems are never closed, therefore their evolution or purposeful development is an integral factor of their existence. Owing to this fact, the control of the development of such noise systems is the most important type of control as it defines not only the improvement of the management system but also the quality of its performance and its very existence.
13.18. Research Areas in Noise Characterization Theory
Human noise behaviour: a) Developing a slide rule for noise measurement; b) Acoustic/Noise Filters, built environment analysis, human comfort & health through selective acoustic/noise filter configurations; c) Physiology and epidemiology of human noise behaviour.
Integrated control of built environment parameters for comfort and wellness: Providing acceptable Indoor Environmental Quality is a critical function of built environment system through characterization and measurement (odors, dust, pollen, light, humidity, heat, sound, electricity, airflow, air temperature, fire etc.). With integrated environmental control, these environmental parameters are to be characterized and checked through sensation and perception of occupants for comfort and wellness and controlled through various environmental monitoring sensors. The effect of these human behavioural parameters is to be characterized and measured on a logarithmic noise scale.
Distributed/Noise generation characterization & modelling; health effects (+/-); comfort/discomfort indices: a) Aero-acoustics/wind-induced natural ventilation; b) Pedestrian comfort/discomfort/noise indices with wind-induced corner peak pressure on tall buildings; c) Solar & wind energy conversion acoustics on PV/T collectors; d) Hybrid wind and solar PV systems (off Grid) for serving remote city areas; e) Wind energy conversion acoustics/electromagnetic interference due to wind mills; f) Heat transfer, thermal compression oscillations, thermo-acoustics.
Energy conversion materials characterization and noise insulation: a) Novel solar energy conversion materials, their properties & characterization for selective configurations of solar photovoltaic, thermoelectric and solar thermal collectors; b) Integrated insulation materials properties; c) Heat transfer, energy, entropy & noise generation modelling.
Energy conversion materials and noise generation modeling: a) Solar energy conversion by biological & photosynthetic materials; b) Hydrogen production through solar energy conversion; c) Biomass/Waste-to-Energy Conversion; d) Energy, exergy, thermodynamic, entropy & noise generation modelling.
Energy conversion (materials, devices) and noise: a) Investigating solar energy acoustics by using/devising geothermal energy to supply power of a mega power size plasma torch for plasma gasification of waste; b) Investigation on their control system using wireless power transfer; c) Energy, combustion, exergy, thermodynamic, entropy & noise generation modelling.
Industrial energy conversion (materials, devices) and noise management: a) Industrial energy conversion, waste/biomass combustion/incineration and cogeneration for electric power and HVAC comfort requirements; b) Energy conversion in engines and noise reduction; c) Noise reduction in transportation systems; d) Noise systems modeling and control.
Instrumentation: a) Sensors & transducers for measurement, monitoring and control of noises (light, sound, heat, fluid, electricity, fire and the sun); b) Electromagnetic, thermoelectric and piezoelectric transducers for noise measurement.
Graduate teaching courses: a) Building Insulation; b) Sustainable Eco-Cities; c) Human Environmental Health; d) Noise Systems Engineering; e) Occupational Cellular Physiology; f) Solar Energy Acoustics; g) Measurement Systems and Units.
14. Conclusions
A study on acoustic signal processing and noise characterization theory via energy conversion in a PV solar wall device with ventilation through a room is performed. The noise interference and characterization as per speed of a composite wave is presented. The sources of noise waves (sun, light, sound, heat, electricity, fluid and fire) are described depending on their speed of noise interference. Noise measurement equations and their units are coined. The power systems are classified as per source signals of solar power, electric power, light power, sound power, heat power, fluid power and fire power. The noise filters for filtering noise from power systems are defined with examples.
Energy conversion is investigated in a PV solar wall by means of experiments and numerical model. The outdoor experiments were conducted on a PV solar wall installed on a wooden frame connected to a room with passive and active ventilation. Further, outdoor experiments were established under available operating conditions. The experiments conducted on a PV solar wall have taken into consideration the effect of heat capacity, thermal time constant, and thermal storage losses. The experimental results along with results of simulation model for noise filtering for a PV device are presented.
The electrical and thermal characteristics were established for a PV solar wall. The sensible heat storage capacities of a PV solar wall installed on a wooden frame were higher in comparison to a window glass or a stand-alone PV module. The electrical and thermal characteristics were function of both outdoor air temperature and thermal storage losses. Finally, production of heat and electricity was a nonlinear function of volume of electrical and thermal resistances developed across a PV solar wall similar to a loudspeaker. The active ventilation was deemed to be essential in order to avoid over-heating of a PV solar wall and to maintain adequate outdoor ventilation in a room under mild climate conditions.
Some noise unit examples for an air duct exposed to solar radiation are tabulated. A phenomenon of photovoltaic amplification for a pair of photovoltaic modules connected to a potentiometer is enlightened. The time plots of power function were used to support and devise noise measurement expressions and noise characterization in a power system as per speed of a wave.
A simple theory is outlined in this paper which gives an indication of the way in which noise due to physical agents are attenuated by a complex system or building elements. In practice due to complex elements, the noise transmission due to composite waves comes both via the common partition panel and the balance from the supporting structure. Theory and measurement applicable to panels can be extended to complex building systems, since it is the objective to devise the lightest and simplest panels with the highest values of insulation. It is the net effect of the panel partition with its associated structure which decides the insulation obtained in practice and which is difficult to predict.
Detailed discussions of noise characterization theory in various disciplines are presented through energy conversion model and experiments with emphasis on cities, acoustics, electrical, control, noise fields, energy conversion in engines, noise pollution & control, fire alarm systems, noise instrumentation, operation of power systems, friction & oscillations along with some discussions on automatic control & management of noise systems. The paper has also introduced theory and concept of solar energy acoustics. Description of sensors & transducers for a human brain with example of human comfort & health are also presented. Research areas in noise characterization theory along with its graduate teaching subjects are briefly outlined.
Appendix has presented some basic definitions to understand the noise characterization theory.
Acknowledgment
Part of the work was conducted by the author at Department of Building, Civil and Environmental Engineering, Concordia University, Montréal, Québec, Canada.
Appendix
Definitions
Energy Area: The definitions of noise sources are characterized by energy area stored in a wave with its speed and difference due to power intensities of two waves due to interference.
Noise of Sol: The difference of power intensities between two solar power systems causes noise of sol (S). The power storage on a unit area per unit time defines amplitude of a solar energy wave.
The storage of solar power is defined by a solar energy wave pack of unit cross sectional area and of length s, the velocity of light.
Noise of Therm: The difference of power intensities between two heat power systems causes noise of therm. The power storage on a unit area per unit time defines amplitude of a heat wave.
The storage of heat power is defined by heat energy wave pack of unit cross sectional area and of length s, the velocity of light.
Noise of Photons: The difference of power intensities between two lighting power systems causes noise of photons. The power storage on a unit area per unit time defines amplitude of a light beam.
The storage of light beam is defined by light beam packet of unit cross sectional area and of length s, the velocity of light.
Noise of Electrons: The difference of power intensities between two electrical power systems causes noise of electrons. The power storage on a unit area per unit time defines amplitude of an electricity wave.
The storage of electrical power is defined by an electricity wave pack of unit cross sectional area and of length s, the velocity of light.
Noise of Scattering: The difference of power intensities between two fluid power systems causes noise of scattering. The power storage on a unit area per unit time defines amplitude of a fluid wave.
The storage of fluid power is defined by fluid energy wave pack of unit cross sectional area and of length s, the velocity of fluid.
Noise of Scattering and Lightning: The difference of power intensities between two fire power systems causes noise of scattering and lightning. The power storage on a unit area per unit time defines amplitude of a fire flash.
The storage of fire power of light is defined by fire pack of unit cross sectional area and of length s, the velocity of light. The storage of fire power of fluid is defined by fire pack of unit cross sectional area and of length s, the velocity of fluid.
Noise of Elasticity: The difference of power intensities between two sound power systems causes noise of elasticity. The power storage on a unit area per unit time defines amplitude of a sound wave. The storage of sound power is defined by sound energy wave pack of unit cross sectional area and of length s, the velocity of sound.
Nomenclature
Tp Temperature of PV module
Tb Temperature of insulating panel
Ta Temperature of air
S Solar Intensity
Ep Electric power
V Air velocity
To Ambient air temperature
Ts Room air temperature
Hpv-T Heat capacity
ΔTv Temperature difference (y-ordinate)
ΔTH Temperature difference (x-ordinate)
ρn Density
Kd Thermal conductivity
Hd Film coefficients
T Thermal time constant
Qv Thermal storage capacity (y-ordinate)
QH Thermal storage capacity (x-ordinate)
Cn Specific heat
dn Thickness
dnρnCn Energy stored/m2/K
Isc Short circuit current
Voc Open circuit voltage
- H. Dehra, “A Paradigm for Characterization and Checking of a Human Noise Behavior”, WASET Proceedings of 19th International Conference on Psychological and Brain Sciences, pp. 658-666, May 11-12, 2017, Montréal, Canada.
- H. Dehra, “Electrical and Thermal Characteristics of a Photovoltaic Solar Wall with Passive and Active Ventilation through a Room”, WASET Proceedings of 19th International Conference on Sustainable and Renewable Energy Engineering, pp. 584-592, May 11-12, 2017, Montréal, Canada.
- H. Dehra, “A unified theory for stresses and oscillations”, Proc. Canadian Acoustical Association (CAA) Montréal 2007 Conf, Concordia University, Montréal, Québec, Canada , pp. 132-133, 2007.
- H. Dehra, “Power transfer and inductance in a star connected 3-phase RC circuit amplifier”, Proc. AIChE 2008 Spring Meeting, New Orleans, LA, USA, session 96a, 2008.
- H. Dehra, “The noise scales and their units”, Proc. Canadian Acoustical Association (CAA) Vancouver 2008 Conf, Vancouver, B.C., Canada, pp. 78-79, 2008.
- H. Dehra, “A benchmark solution for interference of noise waves”, Proc. AIChE 2009 Spring Meeting, Tampa, FL, USA, session 67c, 2009.
- H. Dehra, “A guide for signal processing of sensors and transducers”, Proc. AIChE 2009 Spring Meeting, Tampa, FL, USA, session 6b, 2009.
- H. Dehra, “Solar energy absorbers”, chapter 6 in Solar Collectors and Panels, Theory and Applications, edited by Reccab Manyala, InTech Publication, pp. 111-134, 2010.
- H. Dehra, “Acoustic filters”, chapter 5 in Ventilation: Types, Standards and Problems edited by Vincent A. Romano and Allison S. Duval, Nova Publishers, pp. 135-154, 2012.
- H. Dehra, “A theory of acoustics in solar energy”, Natural Resources, pp. 116-120, 4 (1A), 2013.
- H. Dehra, “A novel theory of psychoacoustics on noise sources, noise measurements and noise filters”, Proc. NoiseCon16, Providence, Rhode Island, pp. 933-942, 13-15 June, 2016, Publisher: Institute of Noise Control Engineering, USA, 2016.
- H. Dehra, “On Sources and Measurement Units of Noise”, Proc. International Conference on Innovation, Management and Industrial Engineering (IMIE 2016), Kurume, Fukuoka, Japan, 05-07 August 2016, 219-227, ISSN: 2412-0170, 2016.
- H. Dehra, “A Slide Rule for Noise Measurement”, 10th International Conference on Sustainable Energy Technologies (SET 2011), Istanbul, Turkey, September 4-7, 2011, 5 p.
- V. Del Toro, Electrical Engineering Fundamentals, 2nd ed., Prentice-Hall of India, New Delhi, India, 1986.
- Robert H. Randall, An Introduction to Acoustics, Dover Publications, USA, 1951.
- Ingo R. Titze, Principles of Voice Production, Prentice Hall, Englewood Cliffs, NJ, USA, 1994.
- J. C. Lucero, “Dynamics of the vocal fold oscillation”, TEMA Tend. Mat. Apl. Comput., 6, No. 1, pp. 11-20, 2005.
- J.L Threlkeld, Thermal Environmental Engineering, Englewood Cliffs, NJ, USA, 1962.
- H. Dehra, “A heat transmission model for a telephone line”, Proc. of 21st CANCAM, Department of Mechanical and Industrial Engineering, Ryerson University, Toronto, Ontario, Canada, June 3-7, 2007, pp. 356-357, 2007.
- H. Michael Newman. Direct Digital Control of Building Systems, John Wiley and Sons, New York, USA, 1994.
- H. Dehra, “Photovoltaic Solar Wall: 2-D Numerical Modeling and Experimental Testing under Fan induced Hybrid Ventilation”, proceedings of the IEEE International Conference on Energy Efficient Technologies for Sustainability, April 7-8, 2016, St. Xavier’s Catholic College of Engineering, Nagercoil, Kanyakumari District, Tamilnadu, India, IEEE Xplore, ISBN: 978-1-4673-9925-8, Page(s): 668-676.
- H. Dehra, “A Multi-Parametric PV Solar Wall Device”, in proceedings of IEEE International Conference on Power, Control, Signals and Instrumentation Engineering (ICPCSI-2017), 978-1-5386-0814-2/17/$31.00 ©2017 IEEE, Chennai, India on Sep 21-22, 2017, pp. 392-401.
- H. Dehra, “Characterization of Noise in Power Systems”, proceedings of IEEE International Conference on Power Energy, Environment & Intelligent Control (PEEIC2018), 978-1-5386-2341-1/18/$31.00 ©2018 IEEE, Greater Noida, India on April 13-14, 2018, pp. 321-330.
- H. Dehra, “A numerical and experimental study for generation of electric and thermal power with photovoltaic modules embedded in building façade,” submitted/un-published Ph.D. dissertation, Dept. Building, Civil and Environmental Engineering, Concordia University, Montréal, Québec, Canada. August 2004.
- H. Dehra, “Experiments on photovoltaic modules embedded in building façade,” AIChE Spring 2010, San Antonio, TX, USA, March 21-25, 2010.
- H. Dehra, “The effect of heat and thermal storage capacities of photovoltaic duct wall on co-generation of electric and thermal Power,” AIChE 2007 Spring Meeting, Houston, Texas, USA, April 22-26, 2007, session 36a.
- C. Muresan, C. Ménézo, R. Bennacer, R. Vaillon, “Numerical simulation of a vertical solar collector integrated in a building frame: radiation and turbulent natural convection coupling,” Heat Transf Eng, pp. 29-42, 27, 2006.
- J. H. Kim, J. T. Kim, “A simulation study of air-type building-integrated photovoltaic-thermal system,” Energy Procedia, pp. 1016-1024, 30, 2012.
- Y. Lin, C. Chiang, C. Lai, “Energy efficiency and ventilation performance of ventilated BIPV walls,” Eng Appl Comput Fluid Mech, pp. 479-486, 5, 2011.
- C. J. Ho, A. O. Tanuwijava, C. Lai, “Thermal and electrical performance of a BIPV integrated with a micro encapsulated phase change material layer,” Energy Build, pp. 331-338, 50, 2012.
- H. Dehra, “The effect of heat and thermal storage capacities of photovoltaic duct wall on co-generation of electric and thermal Power,” AIChE 2007 Spring Meeting, Houston, Texas, USA, April 22-26, 2007, session 36a, 9 pages.
- H. Dehra, “The Entropy Matrix Generated Exergy Model for a Photovoltaic Heat Exchanger under Critical Operating Conditions”, International Journal of Exergy, Vol. 5, Issue 2, pp. 132-149 (2008).
- H. Dehra, “A Two Dimensional Thermal Network Model for a Photovoltaic Solar Wall”, Solar Energy, 83 (11) 1933-1942 (2009).
- H. Dehra, “An investigation on energy performance assessment of a photovoltaic solar wall under buoyancy-induced and fan-assisted ventilation system”, Applied Energy, pp. 55-74, 191, 1 April 2017.
- H. Dehra, “A Combined Solar Photovoltaic Distributed Energy Source Appliance”, Natural Resources, June 2011, Issue 2, pp. 75-86.
- H. Dehra, “A Mathematical Model of a Solar Air Thermosyphon integrated with Building Envelope”, International Journal of Thermal Sciences, Vol. 102, April 2016, pp. 210-227.
- ASHRAE Handbook, Fundamentals Volume (1997), American Society for Heating, Refrigerating and Air-Conditioning Engineers, Inc., Atlanta, GA, USA, 1997.
- ANSI/ASHRAE Standard 55-2004. Thermal environmental conditions for human occupancy, American Society of Heating, Refrigerating and Air-Conditioning Engineers, Inc., Atlanta, GA, USA, 2004.
- Jerrold H. Krenz, Energy Conversion and Utilization, 2nd Edition, Allyn and Bacon, Inc,, Boston, USA, 1984.
- Larry Gay, The Complete Book of Insulating, The Stephen Greene Press, Vermont, USA, 1980.
- V. Lukanin, Internal Combustion Engines, Mir Publishers, Moscow, 1990.
- H.J. Purkis, Building physics: Acoustics, Oxford, New York: Pergamon, 1966.
- H J Purkis, “Instruments for noise measurement”, Journal of Scientific Instruments, Volume 41, Number 5, pp.284-289, 1964.
- M.K. Poltev, Occupational Health and Safety in Manufacturing Industries, Mir Publishers, Moscow, 1985.
- M. I. Reznikov and Yu. M. Lipov, Steam Boilers of Thermal Power Stations, Mir Publishers, Moscow, 1989.
- I.V. Kragelsky, Friction, Wear, Lubrication – Tribology Handbook, Vol. 2, Mir Publishers, Moscw, 1986.
- A. A. Voronov, Management and Control in Large Systems, Mir Publishers, Moscow, 1986.