Learning Personalization Based on Learning Style instruments

Adv. Sci. Technol. Eng. Syst. J. 3(3), 108–115 (2018);
 DOI: 10.25046/aj030315
Adaptive education systems (AES) are considered one of the most interesting research topics in technology-based learning strategies. Since students have different abilities, needs and learning styles, we should fit the curriculum and teaching activities to these different learning styles. This study investigates the impact of using LAES (Libyan Adaptive Education System) on the performance of students. An ALSI (Arabic Learning Style Instrument) was integrated into the LAES system to investigate learning preferences of students. The student models are constructed according to the results obtained using this instrument (ALSI). Three experimental studies were then conducted to investigate the impact of the LAES system on the performance of students. The results reveal the students who have learnt using the LAES system were more successful than others who learnt without, in terms of the knowledge gained.The objective was to review and add literature whether green tea is helpful for weight reduction. Reviewing the randomized, double-blind, placebo-controlled trials to compare green tea extracts for weight loss from various online sources including Ovid MEDLINE, PubMed, and Cochrane databases studies published in 2006, 2007 and 2008 in English language were considered. In each of the three studies, baseline measurements were taken and analyzed of the research participants. Measurements of total body weight, BMI with reference to age, hip and waist circumference were measured at the interval of 4 weeks i.e. 0 week (0 month), 4th week (1 month), 8th week (2 month), 12th week (3 month) were taken. All the research work analyzed and reviewed showed that a part of some minor changes no major changes were observed to prove the significance of green tea as a single agent for reducing weight. An increase in body energy expenditure was observed which leads to increase in appetite by the subjects but no adverse effects were noted. After detail review and analysis, the results showed that green tea have no significant effect on the weight reduction as a single agent.
1. Introduction
This paper is an extension of work originally presented in the 2nd International Conference on Knowledge Engineering and Applications ICKEA 2017 [1]. Research on education has indicated that students have different learning preferences, abilities and needs, and learn in different ways. For example, learners with visual learning preference tend to obtain more knowledge from instructional materials that depend on visual forms of information, whereas the content will be more beneficial for the students with verbal preferences if these materials are represented using text and audio. Moreover, some learners tend to learn more through ‘doing’, whereas the others prefer to think and reflect. These learning preferences are often called learning styles [2].
Although it is argued that matching of teaching styles with the preferred learning styles of students will be quite useful to improve learning outcomes [2-5], it is quite clear that many researchers also believe that learners should know more details about their learning styles because this will help them to be more engaged, motivated and attracted in educational sessions [4, 6-8]. This study investigates empirically the effect of using adaptive education systems on the performance of student learning.
This article is organised as follows: the next section discusses the related work, where the Alzain model and ALSI instrument were selected to be integrated into the proposed system in order to profile learners; the structure of the proposed adaptive system is discussed in section 3; section 4 describes the methodology of the experiments as well as the research hypothesis; the results of our research are presented in section 5 and the conclusions are discussed in the last section.
2. Related Work
2.1. Adaptive Education Systems
Although learners have different learning preferences, goals, experiences and knowledge, the traditional education systems provide the same instructional materials for all students [9]. Therefore, in considering the individual differences between students, adaptive systems have been harnessed in the education field. The educational generation of adaptive systems is called Adaptive Learning Environment (ALE) or Adaptive Educational Hypermedia System (AEHS). These systems have been defined as “technological component of joint human–machine systems that can change their behavior to meet the changing needs of their users, often without explicit instructions from their users” [10]. This generation of educational systems can provide learners with instructional materials that are adapted especially to their learning styles, goals, experiences or the previous knowledge of the subject [9, 11, 12]. In order to know how learners prefer to learn, learning style instruments have been developed and extensively used in adaptive education systems [13]; this situation lead us to discuss the next topic, which is learning style instruments.
2.2. Learning Style Instruments
The concept of learning styles has been harnessed in most AEHS for the purpose of building up a knowledge about students and how they prefer to learn [7, 14-16]. This knowledge is usually collected throughout psychometric questionnaires called learning style instruments, and then stored in student models with the purpose of achieving the adaptation process [12]. In the past decades, a number of learning style instruments were developed to assist learners to measure their preferred learning style and to help teachers to realize the characteristics of students [13]. Many issues concerning the integration of learning style instruments into adaptive education systems have attracted the attentions of researchers from the fields of education and computer science. The following subsection explains the learning style model and instrument that is harnessed in this study.
2.3. ALSI Instrument
The Arabic Learning Style Instrument (ALSI), was developed based on the Alzain learning style model [17] to assess student preferences on (visual, verbal, passive and active) learning styles. See figure 1.
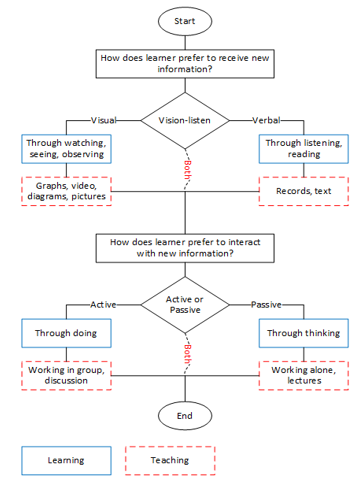 Figure 1. Alzain Learning Style Model
Based on the Alzain Learning Style Model, there are four types of combination of leaning styles. See Table 1.
Table 1. Combination of learning styles
| Combination of learning styles | |
| 1 | Visual / Active |
| 2 | Visual / Passive |
| 3 | Verbal / Active |
| 4 | Verbal / Passive |
These different types of combinations are considered by the use of the following elements, and the rules of each type are described below:
- Visual: get more from visual forms of information
- More figures, graphs, charts and pictures;
- Highlighting and colouring the important concepts;
- Multimedia and animated demonstrations.
- Active: doing very well in groups
- Providing discussion areas;
- More exercises;
- Fewer examples.
- Verbal: get more from verbal forms of information
- Heavy textual content;
- Audio records and files.
- Passive: thinking before doing
- Less detailed content (summarised);
- Giving time to think periodically;
- More examples;
- Fewer exercises.
The ALSI instrument consists of sixteen items, each of which has four choices, which correspond to the four learning styles. Respondents need to choose the answer(s) that best fits their preference(s) by determining the priority levels from least important (0) to most important (3), for the respective choices. The respondents are also allowed to give the same priority level for different choices at the same time.
3. LAES System
The adaptive system that employed in this study called LAES (Libyan Adaptive Education System), it is a Web-based education system. The LAES tackles the problems arising from individual differences by presenting the most suitable educational materials and activities for students. Figure 2 shows the LAES architecture, which includes four main domains:
- Content Model;
- Student Model;
- Teaching Strategies Model;
- Pedagogical Model: this model involves three components:
- Preferences Detection Component;
- Adaptation Component;
- Revision Component.
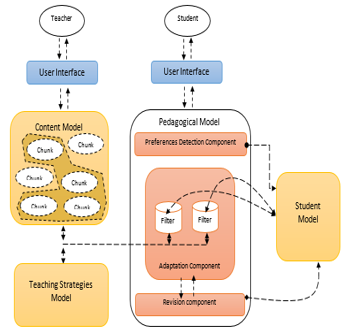 Figure 2. LAES system architecture.
3.1. Content Model
A content model includes the educational content. Typically, each course can be depicted as a tree, which consists of a set of weeks, and each week involves a number of lectures that involve a set of educational units called chunks (see Figure 3). Each unit starts with outlines and then presents the content and concludes with the summary.
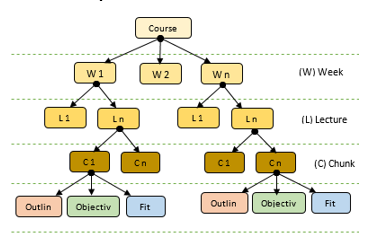 Figure 3. Content model _ LAES system
The educational materials employed in this research were designed based on the ideas of two well-known educational theories, namely Elaboration Theory and Component Display Theory (CDT) [18].
3.2. Student Model
A student model keeps the student details and their learning preferences. Accordingly, based on these details, the instructional materials and teaching strategies can be adapted to fit the learning style of the students. The student model represents a student profile, which stores all user-relevant details. These details can be divided into two main parts. While the first part summarises the learning style of students, as detected by the ALSI instrument, the second part holds the personal details of students including student name, age, email, etc. Figure 4 shows the structure of this model.
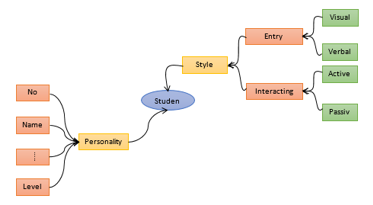 Figure 4. Student model _ LAES system
3.3. Teaching Strategies Model
This model contains a description of different teaching strategies that can be used to teach the different types of learners. Typically, each teaching strategy involves a set of activities. In this sense, the teaching strategy model can be presented as a tree (see Figure 5).
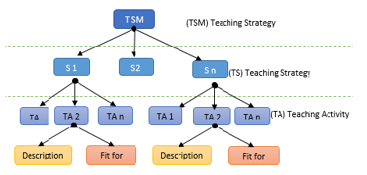 Figure 5. Teaching strategies model _ LAES system
3.4. Pedagogical Model
The pedagogical model aims to provide each individual student with the most suitable content and teaching activities. To this end, if the student is a new user, the system will direct them to fill out the learning style instrument (ALSI) to detect the student learning style, which will be stored in a student model. The learning session starts when the student is logged in. Accordingly, the LAES system recommends the most suitable content and teaching activities based on the preferred learning style of the student who is logged in.
To determine the preferred learning style of students, the procedure is as follows:
- The ALSI instrument consists of 16 questions;
- Each question has 4 choices;
- Participants need to give a priority level from 0 (least important) to 3 (most important) for each choice;
- Each choice corresponds to one preference;
- The highest score possible is 48 for each preference;
- Visual Preferences (VP) =;
- Verbal Preferences (EP) =;
- Active Preferences (AP) =;
- Passive Preferences (PP) =
- Preferred Style of Receiving new information (PSR) = VP – EP;
- If PSR > 0 then student has a Visual preference;
- If PSR < 0 then student has a Verbal preference;
- If PSR = 0 then student has equal preferences;
- Preferred Style of Interacting new information (PSI)= AP-PP;
- If PSI > 0 then student has an Active preference;
- If PSI < 0 then student has a Passive preference;
- If PSI = 0 then student has equal
4. Experiment Design
The LAES system can adapt the content based on the preferred learning style of students. In order to evaluate the impact of using the LAES system on student performance, an experimental evaluation approach was used. This approach is recommended by several researchers in this field [19].
According to Alshammari [8], conducting only one experiment will not be sufficient to evaluate the adaptive system, because the number of participants and time of learning will be limited. Therefore, three different experiments were conducted, each with a different module, subject and participants. Each experiment was carried out in three sessions, and each session lasted for about 120 minutes.
In each experiment, the participants were first taught without using the LAES system, and they were asked to complete a pre-test and a post-test to know the learning outcomes. The learning outcomes were also tested in the next experimental session, in which the participants were taught using the LAES system, and the learning outcomes of two experimental sessions were compared.
4.1. Research Hypothesis
The key issue that was considered in the following three experiments was the learning outcomes, and to investigate if students who learnt using the LAES system were better off than others who learnt without the system, in terms of the knowledge gained. In the following three experiments, the following hypotheses were investigated using a paired t-test and Pearson Correlation test:
- H1: there will be no significant difference in terms of the knowledge gained between students who learnt using the LAES system and students who learnt without it.
- H2: there will be no significant correlation between the dimensions on learning styles.
- H3: there will be no significant correlation between learning styles and years of computer use.
Moreover, the effect size was also tested in each experiment. The effect size is a statistical technique used with quantitative data for exploring the difference between two groups. According to Cohen [20], the effect size (Cohen’s d) can lie between 0 to1, (and some, formulae yield an effect size that is larger than 1):
- From 0 to 0.20 = weak effect;
- From 0.21 to 0.50 = modest effect;
- From 0.51 to 1.00 = moderate effect;
- > 1.00 = strong effect.
5. Results
5.1. Experiment I
This experiment was conducted by the researcher with a number of undergraduate students (n = 10) studying for a (Formal Languages and Automata Theory) module.
In the experiment, the mean age of participants was 21, the minimum age was 20 and the maximum age was 23. The participants were found to be more visual and active than verbal and passive, and the majority of the participants had moderate learning preferences. Figure 6 shows the number of participants in each sub-category.
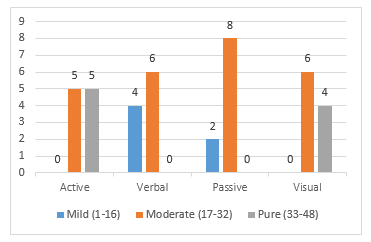 Figure 6. Participants distribution based on their learning styles _ experiment I.
In this experiment, the learning outcomes were measured. Generally, the mean participant scores when they learnt using the adaptive system (Mean = 9.60) is higher than the mean participant scores when they learnt without it (Mean = 5.30).
A dependent sample t-test was also conducted, and the results of a paired t-test showed that there was a statistically significant difference between the mean scores of the participants when they learnt using the LAES system and the mean participant scores when they learnt without it. t (10) = -2.294, p = 0.047. Therefore, it can be inferred that the students who learnt using this system were better off than others who learnt without it in terms of the knowledge gained. In this experiment, the effect size was also measured for each individual scale using Cohen’s d test. The results revealed that the highest effect size (d = 1.31) was in visual style followed by the active style (d = 0.89).
Regarding the second hypothesis, which are concerned with the correlation between dimensions of learning style, the results of Pearson Correlation test showed that there was a positive significant correlation between visual and active style, r (10) = 0.71, p = 0.02. See table 2.
Table 2. Results of Pearson correlation test _ experiment I
| Correlations | ||||||
| Active | Verbal | Passive | Visual | Years Of
Computer Use |
||
| Active | Pearson Correlation | 1 | 0.08 | 0.52 | .71* | 0.12 |
| Sig. (2-tailed) | 0.82 | 0.12 | 0.02 | 0.72 | ||
| N | 10 | 10 | 10 | 10 | 10 | |
| Verbal | Pearson Correlation | 0.08 | 1 | -0.21 | -0.23 | 0.44 |
| Sig. (2-tailed) | 0.82 | 0.54 | 0.52 | 0.19 | ||
| N | 10 | 10 | 10 | 10 | 10 | |
| Passive | Pearson Correlation | 0.52 | -0.21 | 1 | 0.35 | -0.24 |
| Sig. (2-tailed) | 0.12 | 0.54 | 0.31 | 0.50 | ||
| N | 10 | 10 | 10 | 10 | 10 | |
| Visual | Pearson Correlation | .71* | -0.23 | 0.35 | 1 | -0.37 |
| Sig. (2-tailed) | 0.02 | 0.52 | 0.31 | 0.28 | ||
| N | 10 | 10 | 10 | 10 | 10 | |
| Years Of
Computer Use |
Pearson Correlation | 0.12 | 0.44 | -0.24 | -0.37 | 1 |
| Sig. (2-tailed) | 0.72 | 0.19 | 0.50 | 0.28 | ||
| N | 10 | 10 | 10 | 10 | 10 | |
| *. Correlation is significant at the 0.05 level (2-tailed). | ||||||
5.1. Experiment II
This experiment was conducted with a number of undergraduate students (n = 16) studying for a (Computer Basics) module.
In the experiment, the mean participant age was 20, the maximum age was 23 and the minimum was 18. The participants were found to be more active and visual than passive and verbal, and the majority of the participants had pure or moderate learning preferences. Figure 7 shows the number of participants in each sub-category.
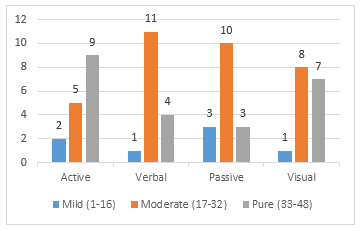 Figure 7. Participants distribution based on their learning styles _ experiment II.
In this experiment, the mean participant score when they learnt without using the LAES system (Mean = 9.94) was less than the mean participant scores when they learnt using it (Mean = 16.13). In order to investigate if there is any significant difference between the two, a dependent sample t-test was conducted. The findings showed that there was a statistically significant difference between the mean scores of the participants when they learnt using the LAES system and the mean participant scores when they learnt without it. t (16) = -2.289, p = 0.037. Therefore, it can be inferred that the students who learnt using this system were better off than others who learnt without it in terms of the knowledge gained.
The effect size was also measured for each individual scale. The results of this test revealed that the highest effect size (d = 0.77) was in the visual style followed by the verbal style (d = 0.32).
Regarding the second hypothesis, which is concerned with the correlation between dimensions of learning style, the results of Pearson Correlation test showed that there was a statistically positive significant correlation between passive and active style, r (16) = 0.79, p = 0.00, there was also positive significant correlation between passive and verbal style, r (16) = 0.76, p = 0.00. See table 3.
The results also showed that there was no significant correlation between the years of computer use and different learning styles (Table 3).
5.1. Experiment III
This experiment was conducted with a number of undergraduate students (n = 14) studying for a (Programming Languages) module.
Table 3. Results of Pearson correlation test _ experiment II
| Correlations | ||||||
| Active | Verbal | Passive | Visual | Years Of
Computer Use |
||
| Active | Pearson Correlation | 1 | 0.467 | .79** | 0.44 | 0.12 |
| Sig. (2-tailed) | 0.06 | 0.00 | 0.08 | 0.64 | ||
| N | 16 | 16 | 16 | 16 | 16 | |
| Verbal | Pearson Correlation | 0.46 | 1 | .76** | -0.11 | 0.12 |
| Sig. (2-tailed) | 0.06 | 0.00 | 0.67 | 0.65 | ||
| N | 16 | 16 | 16 | 16 | 16 | |
| Passive | Pearson Correlation | .79** | .76** | 1 | 0.17 | 0.13 |
| Sig. (2-tailed) | 0.00 | 0.00 | 0.52 | 0.61 | ||
| N | 16 | 16 | 16 | 16 | 16 | |
| Visual | Pearson Correlation | 0.44 | -0.11 | 0.17 | 1 | 0.12 |
| Sig. (2-tailed) | 0.08 | 0.67 | 0.52 | 0.64 | ||
| N | 16 | 16 | 16 | 16 | 16 | |
| Years Of
Computer Use |
Pearson Correlation | 0.12 | 0.12 | 0.13 | 0.12 | 1 |
| Sig. (2-tailed) | 0.64 | 0.65 | 0.61 | 0.64 | ||
| N | 16 | 16 | 16 | 16 | 16 | |
| **. Correlation is significant at the 0.01 level (2-tailed). | ||||||
In the experiment, the mean age was 21, the minimum age was 19 and the maximum age was 34. The participants were found to be more active and visual than passive and verbal, and the majority of the participants had pure or moderate learning preferences. Figure 8 shows the number of participants in each sub-category.
The learning outcomes were measured. Generally, the mean participant score when they learnt using the LAES system (Mean = 22.14) was higher than the mean participant scores when they learnt without using this system (Mean = 14.29).
A dependent sample t-test was also conducted, and the results of this test showed that there was a statistically significant difference between the mean score of the participant when they learnt using the LAES system and the mean participant scores when they learnt without it. t (14) = -1.724, p = 0.048. Therefore, it can be inferred that the students who learnt using this system were better off than others who learnt without it in terms of the knowledge gained.
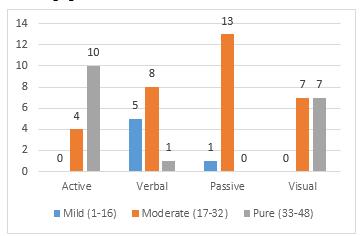 Figure 8. Participants distribution based on their learning styles _ experiment III.
The effect size was also measured for each individual scale, and the results of Cohen’s d test revealed that the highest effect size (d = 0.56) was in active scale followed by the visual scale (d = 0.55).
Table 4 shows the results Pearson Correlation test, which is concerned with the correlation between dimensions of learning style, the results showed that there was a statistically positive significant correlation between visual and active style, r (10) = 0.61, p = 0.02, there was also positive significant correlation between visual style and years of computer use, r (10) = 0.58, p = 0.02.
Conclusion
This study investigated empirically the implications of using the LAES system, and the impact of that on the performance of students. It also investigated the effect size of each individual scale to identify the most affected students.
To increase the efficiency of results, three experiments were conducted. The experiments were carried out with different modules, teachers and students.
Generally, the findings indicate that using LAES system to teach students (in a matched way), based on their preferred learning style, has a positive influence on the performance of the students. The results also revealed that the visual and active students were the greatest beneficiaries from the adaptation process. A possible explanation for this result is that the existing curricula and teaching approaches are more suitable for students who are more verbal and passive than visual and active.
Regarding the first hypothesis, which is concerned with the differences in terms of the knowledge gained between students who learnt using the LAES system and students who learnt without it. In the first experiment, the results showed that the mean student scores increased from (Mean = 5.30) to (Mean = 9.60) when they learn using the LAES system. Moreover, the results of a paired t-test revealed that there was a statistically significant difference between the mean scores of the participants when they learnt using this system and the mean participant scores when they learnt
Table 4. Results of Pearson correlation test _ experiment III
| Correlations | ||||||
| Active | Verbal | Passive | Visual | Years Of
Computer Use |
||
| Active | Pearson Correlation | 1 | -0.05 | 0.12 | .61* | 0.38 |
| Sig. (2-tailed) | 0.86 | 0.67 | 0.02 | 0.18 | ||
| N | 14 | 14 | 14 | 14 | 14 | |
| Verbal | Pearson Correlation | -0.05 | 1 | 0.33 | -0.25 | 0.03 |
| Sig. (2-tailed) | 0.86 | 0.24 | 0.37 | 0.90 | ||
| N | 14 | 14 | 14 | 14 | 14 | |
| Passive | Pearson Correlation | 0.12 | 0.33 | 1 | -0.02 | 0.09 |
| Sig. (2-tailed) | 0.67 | 0.24 | 0.93 | 0.74 | ||
| N | 14 | 14 | 14 | 14 | 14 | |
| Visual | Pearson Correlation | .61* | -0.25 | -0.02 | 1 | .58* |
| Sig. (2-tailed) | 0.02 | 0.37 | 0.93 | 0.02 | ||
| N | 14 | 14 | 14 | 14 | 14 | |
| Years Of
Computer Use |
Pearson Correlation | 0.38 | 0.035 | 0.09 | .58* | 1 |
| Sig. (2-tailed) | 0.18 | 0.90 | 0.74 | 0.02 | ||
| N | 14 | 14 | 14 | 14 | 14 | |
| *. Correlation is significant at the 0.05 level (2-tailed). | ||||||
without it (t (10) = 2.294, p = 0.047). That was also enhanced by the results of the second experiment, which revealed that the mean student scores increased from (Mean = 9.94) to (Mean = 16.13) when they learn using the LAES system. Moreover, the results of a paired t-test revealed that there was a statistically significant difference between the mean scores of the participants when they learnt using the LAES and the mean participant scores when they learnt without it (t (16) = 2.289, p = 0.037).
More encouraging results emerged from the third experiment where the findings showed that the mean student scores increased from (Mean = 14.29) to (Mean = 22.14) when they learn using the LAES system. Moreover, the results of a paired t-test revealed that there was a statistically significant difference between the mean scores of the participants when they learnt using the system and the mean participant scores when they learnt without it
(t (14) = -1.724, p = 0.048).
In general, the results revealed that the students had significantly higher learning outcomes when they used the LAES system to learn in a matched way. In addition, the (Cohen’s d) effect size was medium (from 0.51 to 1.00) [20].
These results reject the first hypothesis (H1), and prove that students who learnt using the ALSI system had significantly higher learning outcomes.
With reference to the second hypothesis, which is concerned with the correlation between dimensions of learning styles, the results were varied. While the first experiment revealed that there was a statistically positive significant correlation between visual and active styles, r (10) = 0.71, p = 0.02, the second experiment revealed that there was also a statistically positive significant correlation between passive and verbal styles, r (16) = 0.76, p = 0.00. Importantly, the results revealed that there was a statistically positive significant correlation between passive and active styles, r (16) = 0.79, p = 0.00. These results confirm that the dimensions of learning styles must not be treated as dichotomies (either/or options).
The results were also varied in terms of the third hypothesis, which is concerned with the correlation between the years of computer use and dimensions of learning styles. While the first two experiments revealed that there was no significant correlation between years of computer use and different learning styles, the third experiment revealed that there was a positive significant correlation between years of computer use and a visual learning style, r (14) = 0.58, p = 0.02.
- A. M. Alzain, S. Clark, G. Ireson and A. Jwaid, “LAES: An adaptive education system based on learners’ learning styles.” in The 2nd International Conference on Knowledge Engineering and Applications, 2017, pp. 107.
- A. Franzoni-Velázquez, F. Cervantes-Pérez and S. Assar, “A Quantitative Analysis of Student Learning Styles and Teacher Teachings Strategies in a Mexican Higher Education Institution,” Journal of Applied Research and Technology, vol. 10, pp. 289-308, 2012.
- A. M. Alzain, S. Clark and G. Ireson, “Libyan higher education system, challenges and achievements,” in Engineering Education (ICEED), 2014 IEEE 6th Conference On, 2014, pp. 67-72.
- Richard M. Felder And Joni Spurlin, “Reliability and Validity of the Index of Learning Styles: a Meta-analysis,” International Journal of Engineering Education, vol. 21, pp. 103 – 112, 2005.
- A. L. Franzoni, S. Assar, B. Defude and J. Rojas, “Student learning styles adaptation method based on teaching strategies and electronic media,” in Advanced Learning Technologies, 2008. ICALT’08. Eighth IEEE International Conference On, 2008, pp. 778-782.
- Z. A. Akasah and M. Alias, “Emphasizing learning of the affective domain for the realization of the engineering learning outcomes,” Cognition, vol. 7, pp. 9, 2010.
- H. M. Truong, “Integrating learning styles and adaptive e-learning system: current developments, problems and opportunities,” Comput. Hum. Behav., vol. 55, pp. 1185-1193, 2016.
- M. T. Alshammari, “Adaptation Based On Learning Style And Knowledge Level In E-Learning Systems, Ph.D thesis,” 2016.
- P. Brusilovsky, “Adaptive hypermedia. User Modeling and User Adapted Interaction,” Ten Year Anniversary Issue (Alfred Kobsa, Ed.), vol. 11, pp. 87 – 110, 2001.
- K. M. Feigh, M. C. Dorneich and C. C. Hayes, “Toward a characterization of adaptive systems: a framework for researchers and system designers,” Hum. Factors, vol. 54, pp. 1008-1024, Dec, 2012.
- P. Brusilovsky, “Methods and techniques of adaptive hypermedia,” in Adaptive Hypertext and HypermediaAnonymous Springer, 1998, pp. 1-43.
- N. Stash, “Incorporating cognitive/learning styles in a general-purpose adaptive hypermedia system,” Dissertation Abstracts International, vol. 68, 2007.
- A. M. Alzain, G. Ireson, S. Clark and A. Jwaid, “Learning style instruments and impact of content: A qualitative study,” in Sustainable Technologies (WCST), 2016 World Congress On, 2016, pp. 109-114.
- Ö Özyurt and H. Özyurt, “Learning style based individualized adaptive e-learning environments: Content analysis of the articles published from 2005 to 2014,” Comput. Hum. Behav., vol. 52, pp. 349-358, 2015.
- S. Graf, T. Liu, N. Chen and S. J. Yang, “Learning styles and cognitive traits–Their relationship and its benefits in web-based educational systems,” Comput. Hum. Behav., vol. 25, pp. 1280-1289, 2009.
- J. O. Liegle and T. N. Janicki, “The effect of learning styles on the navigation needs of Web-based learners,” Comput. Hum. Behav., vol. 22, pp. 885-898, 2006.
- A. M. Alzain, S. Clark, G. Ireson and A. Jwaid, “A study of the reliability and validity of the first arabic learning styles instrument (ALSI),” in Sustainable Technologies (WCST), 2016 World Congress On, 2016, pp. 29-34.
- N. Al-Jojo, “Teacher assisting and subject adaptive material system: an Arabic adaptive learning environment, Ph.D. thesis,” Teacher Assisting and Subject Adaptive Material System: An Arabic Adaptive Learning Environment, 2012.
- C. Mulwa, S. Lawless, M. Sharp and V. Wade, “The evaluation of adaptive and personalised information retrieval systems: a review,” International Journal of Knowledge and Web Intelligence, vol. 2, pp. 138-156, 2011.
- L. Cohen, L. Manion and K. Morrison, Research Methods in Education. Routledge, 2013.