An Overview of Data Center Metrics and a Novel Approach for a New Family of Metrics

Adv. Sci. Technol. Eng. Syst. J. 3(2), 238–251 (2018);
 DOI: 10.25046/aj030228
Data centers’ mission critical nature, significant power consumption, and increasing reliance on them for digital information, have created an urgent need to monitor and adequately manage these facilities. Metrics are a key part of this effort as their indicators raise flags that lead to optimization of resource utilization. A thorough review of existing data center metrics presented in this paper shows that while existing metrics are valuable, they overlook important aspects. New metrics should enable a holistic understanding of the data center behavior. This paper proposes a novel framework using a multidimensional approach for a new family of data center metrics. Performance is examined across four different sub-dimensions: productivity, efficiency, sustainability, and operations. Risk associated with each of those sub-dimensions is contemplated. External risks are introduced, namely site risk, as another dimension of the metrics, and makes reference to a methodology that explains how it is calculated. Results from metrics across all sub-dimensions can be normalized to the same scale and incorporated in one graph, which simplifies visualization and reporting. The new family of data center metrics can help to standardize a process that evolves into a best practice to help evaluate data centers, to compare them to each other, and to improve the decision-making process.
1. Introduction
The ongoing significant and increasing reliance on digital information has led data centers to play a key role in guaranteeing that information is constantly available for users, and adequately stored. A novel framework for data center metrics using a multidimensional approach was introduced in a paper originally presented at the 15th LACCEI International Multi-Conference for Engineering, Education, and Technology: Global Partnerships for Development and Engineering Education in 2017 [1], for which this work is an extension.
Data centers are energy intensive complexes, and this sector is expected to grow substantially. These circumstances have prompted the desire and need to make data centers more efficient and sustainable, while at the same time ensuring reliability and availability. Efforts undertaken to pursue this goal include new legislation, the development of standards and best practices to follow when designing, building and operating a data center, and metrics to monitor performance and find areas of improvement.
Being that data centers are a growing field subject to new and evolving technologies, current practices ignore important pieces of information. Existing data center metrics are very specific, and fail to take into consideration the holistic performance of the data center. In addition, there is an imminent need for metrics to incorporate an assessment of the risk to which the data center is exposed.
The proposed concept addresses concerns from the recent United States Data Center Usage Report (June 2016) [2], which communicates the need to expand research on data center performance metrics that better capture efficiency, in order to identify and understand areas of improvement. The main motivation of this paper is to consolidate existing metrics and current practices, explain areas of improvement, and finally propose a novel multidimensional approach for data center metrics incorporating productivity, efficiency, sustainability, and operations, as well as measurements of all the different risks associated to the data center. This paper adds technical and scientific support to existing theoretical and practical work that has mostly been carried out from outside academia. The ultimate goal of this work is to help standardize a process that eventually becomes a best practice to rate data centers.
2. Background
A data center can be defined as a dedicated facility with all the resources required for storage, processing and sharing digital information, and its support areas. Data centers comprise the required infrastructure (e.g., power distribution, environmental control systems, telecommunications, security, fire protection, and automation) and information technology (IT) equipment (including servers, storage and network/communication equipment). Data centers are very dynamic; equipment can be upgraded frequently, new equipment may be added, obsolete equipment may be removed, and old and new systems may be in use simultaneously. Several threats can cause failures in a data center, including technical issues and human errors. The cost of downtime depends on the industry, and could reach thousands of dollars per minute. Recent reports show that the average cost associated with data center downtime for an unplanned outage is approximately $ 9,000 per minute, an increase of about 60% from 2010 to 2016 [3].
According to standards, best practices, and user requirements, the infrastructure of data centers must comply with stringent technical requirements that guarantee reliability, availability, and security, as they highly correlate with cost and efficiency. An infrastructure with high reliability and availability must have system redundancy, which makes it more expensive, and probably less efficient [4]. In this context, reliability is the ability of the system to perform its functions under stated conditions for a specified period of time, whereas availability refers to the degree to which a system is operational when it is required for use. Redundancy is the multiplication of data center components used to enhance reliability, since they may malfunction at a certain point due to maintenance, upgrade, replacement, or failure [5].
Data centers can consume 40 times more energy than conventional office buildings. IT equipment by itself can consume 1100 W/m2 [6], and its high concentration in a data center results in higher power densities, compared to conventional office buildings, where energy consumption ranges between 30 and 110 W/m2. In addition, the energy consumption profile of data centers is very different from conventional office buildings, since IT equipment power consumption represents more than 50% of the total consumption in data centers. Figure 1 shows an example of energy consumption breakdown [7].
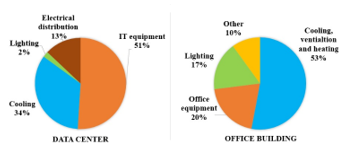 Figure 1: Energy consumption profile in a data center and office building
The United States is home to approximately 3 million data centers, representing one data center for every 100 people [8]. Data center electricity consumption increased approximately 24% from 2005-2010, 4% from 2010-2014, and is expected to grow 4% from 2014-2020 [2]. In 2014, data centers in the United States consumed around 70 billion kWh, which is 1.8% of total electricity consumption, and are predicted to consume around 73 billion kWh in 2020 [2]. Emerging technologies and energy management strategies may decrease the projected energy consumption.
Environmental impact of data centers varies depending on the energy sources used and the total heat generated. The differences between the lowest and the highest greenhouse gas (GHG) emissions associated with each energy source is approximately a factor of 200 [9]. For the period from 2002 to 2020, the emissions associated with the IT sector and the data center sector are estimated to grow by 180% and 240% respectively, considering business as usual [10]. This growth rate is much faster compared to the 30% increase in total emissions from all sources, again considering business as usual. Conversely, the IT sector has contributed to a reduction in emissions in other sectors, since IT is an enabling infrastructure for the global economy. For 1 kWh consumed by the IT sector in the United States, other 10 kWh are saved in other sectors due to the increase in economic productivity and energy efficiency [11]. The growing ubiquity of IT driven technologies has revolutionized and optimized the relation between efficiency and productivity, and energy consumption across every sector of the economy.
The deregulation of telecommunications in the United States through the Telecommunications Act of 1996 promoted the creation of a number of standards and best practices related to telecommunications, and more recently to data centers. Standards provide the most complete and reliable guidance to design or assess a data center, from national/ local codes (required) to performance standards (optional). Due to their mission critical tasks and elevated costs, data centers must be designed, built and operated in compliance with those standards to ensure basic performance and efficiency. Standards, however, do not translate into best practices when the objective is attaining the highest possible reliability and availability, under the best performance. Optional standards and best practices have contributed to achieving this goal.
Data centers standards and best practices evolve continually adapting to emerging needs, and addressing new issues and challenges. The ASHRAE Technical Committee 9.9 has created a set of guidelines regarding the optimal and allowable range of temperature and humidity set points for data centers [12] [13] [14]. The ANSI/ASHRAE standard 90.4 (Energy Standard for Data Centers) establishes the minimum threshold for data center energy efficient design, construction, operation maintenance, and utilization of renewable energy resources [15]. The Singapore Standard SS 564 (Green Data Centers) addresses planning, building, operation and metrics of green data centers [16]. Standards contribute to classify data centers based on their reliability and infrastructure redundancy, such as the ANSI/BICSI-002 (class F0 to F4) [5], the ANSI/TIA-942 (rating 1 to 4) [17] and the Data Center Site Infrastructure Standard from Uptime Institute (tier levels 1 to 4) [18] [19].
Likewise, there is significant concern among legislators about how efficiently an IT facility uses energy. Governments have also imposed regulations on data centers depending on the nature of the business The Energy Efficiency Improvement Act of 2014 (H.R. 2126) demands federal data centers to implement energy efficiency standards. This is motivated by the fact that federal data centers energy consumption represents 10% of all data centers in the United States. This bill encourages federal data centers to improve energy efficiency and develop best practices to reduce energy consumption [20]. According to the Data Center Optimization Initiative (DCOI), federal data centers must reduce their power usage efficiency below a specified threshold, unless they are scheduled to be shutdown, as part of the Federal Data Center Consolidation Initiative (FDCCI). In addition, federal data centers must replace manual collection and reporting with automated infrastructure management tools by the end of 2018, and must address different metric targets including energy metering, power usage effectiveness, virtualization, server utilization and facility monitoring [21].
Organizations that have contributed to the creation of standards, white papers, best practices and other documents related to the Data Center industry are: the International Organization for Standardization (ISO), the National Institute of Standards and Technology (NIST), the Institute of Electrical and Electronics Engineers (IEEE), the International Electrotechnical Commission (IEC), the National Fire Protection Association (NFPA), the American Society of Heating, Refrigerating and Air-Conditioning Engineers (ASHRAE), the U.S. Department of Energy (DOE), the U.S. Environmental Protection Agency (EPA), the U.S. Green Building Council (USBGC), the Telecommunication Industry Association (TIA), the Building Industry Consulting Service International (BICSI), the Uptime Institute, The Green Grid (TGG), the Association for Computer Operations Management (AFCOM), the International Computer Room Expert Association (ICREA), the International Data Center Authority (IDCA), the European Commission (EU Code of Conduct for Data Centres), the British Computer Society (BCS), the Japan’s Green IT Promotion Council (GIPC), the Japan Data Center Council (JDCC), and the Singapore Standards Council among others.
3. Overview of Data Center Metrics
Metrics are measures of quantitative assessment that allow comparisons or tracking of performance, efficiency, productivity, progress or other parameters over time. Through different metrics data centers can be evaluated in comparison to goals established, or to similar data centers. Variations or inconsistencies in measurements can produce a false result for a metric, which is why it is very important to standardize metrics. Much of the current metrics, standards and legislation on data centers is focused towards energy efficiency, as this has proven to be a challenge given the rapid growth of the sector and its energy intensive nature.
One of the most widely used energy efficiency metrics is Power Usage Effectiveness (PUE), introduced in 2007 [22]. Figure 2 shows the energy flow in a data center. PUE is calculated as the ratio of energy used in a facility to energy delivered to IT equipment [23]. Similarly, Data Center infrastructure Efficiency (DCiE) is defined as the reciprocal of PUE [24] with a value ranging between 0 and 1 to make the metric easier to understand in terms of efficiency. Organizations such as the EPA have selected PUE as the metric to analyze energy performance in data centers, and define Source PUE as the ratio of total facility energy used to UPS energy [25], [26]. The main limitation of PUE is that it only measures the efficiency of the building infrastructure supporting a given data center, but it indicates nothing about the efficiency of IT equipment, or operational efficiency, or risk involved [2] [27] [28].
Multiple metrics have been developed to measure other aspects of efficiency. Data Center Size metric (e.g., ‘mini’, ‘small’, ‘medium’, ‘large’, ‘massive’, and ‘mega’ data centers) is based on the number of racks and the physical compute area of the data center [29]. Other classifications based on the size of the data center have been proposed such as ‘hyperscale’, ‘service provider’, ‘internal’, ‘server room’, and ‘server closet’ [2]. The rack Density metric (e.g., low, medium, extreme, and high) considers the measured peak power consumption on every rack (density for rack) and across the compute space [29]. Data Center Density (DCD) is defined as the total power consumption of all equipment divided by the area. Compute Power Efficiency (CPE) is estimated as the IT equipment utilization multiplied by the IT equipment power consumption and divided by the total facility power consumption [30].
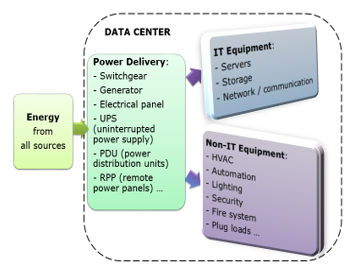 Figure 2: Data center energy flow diagram
Metrics have been proposed to measure server efficiency and performance for computer servers and storage. The metric FLOPS (floating-point operations per second) per Watt measures performance per unit of power [31], and is used to rank the most energy efficient supercomputers’ speed. Standard Performance Evaluation Corporation (SPEC) has contributed with proposals such as SPEC Power and Performance Benchmark Methodology, which are techniques recommended for integrating performance and energy measures in a single benchmark; SPECpower_ssj2008, a general-purpose computer server energy-efficiency measure, or power versus utilization; SPECvirt_sc2013 for consolidation and virtualization; SPEComp2012 for highly parallel complex computer calculations; SPECweb2009 for web applications [32]. The Transaction Processing Performance Council (TPC) uses benchmarks with workloads that are specific to database and data management such as: TPC-Energy, which focuses on energy benchmarks (e.g. TPC-C and TPC-E for online transaction processing, TPC-H and TPC-DS for business intelligence or data warehouse applications, TPC-VMS for virtualized environment) [32]. VMWare proposed VMmark to measure energy consumption, performance and scalability of virtualization platforms [32]. The Storage Networking Industry Association (SNIA) Emerald Program and the Storage Performance Council (SPC) have contributed to establishing measurements for storage performance and the power consumption associated with the workloads [32]. The Space Wattage and Performance metric (SWaP = Performance/ (Space x Power)) [33] incorporates the height in rack units (space), the power consumption (measured during actual benchmark runs or taken from technical documentation), and the performance (measured by industry standard benchmarks such as SPEC).
For cooling and ventilation system efficiency, metrics have also been proposed. HVAC effectiveness is measured through the ratio of IT equipment energy consumption to HVAC system energy consumption. Airflow Efficiency shows the total fan power needed by unit of airflow (total fan power in Watts / total fan airflow in cfm). Cooling System Efficiency is calculated as the ratio of average cooling system power consumption divided by the average data center cooling load [26]. Cooling System Sizing Factor shows the ratio between the installed cooling capacity and the peak cooling load. Air Economizer Utilization Factor and Water Economizer Utilization Factor measure usage at full capacity over a year in percentage terms. Air temperature metric measures the difference between the supply and return air temperature in the data center. Relative humidity metric measures the difference between the return and supply air humidity in the data center [2]. The Rack Cooling Index (RCI) gauges cooling efficiency for IT equipment cabinets compared to the IT equipment intake temperature [34]. The Return Temperature Index (RTI) gauges the performance of air management systems [35].
The Coefficient of Performance of the Ensemble (COP) gauges the ratio of the total heat load to power consumption of the cooling system [36]. The Cooling Capacity Factor (CCF) estimates the utilization of the cooling capacity, by dividing total rated cooling capacity by the UPS output multiplied by 110% [37]. The Energy Efficiency Ratio (EER) is the ratio of the cooling capacity to power input at 95 oF, and the Seasonal Energy Efficiency Ratio (EER) is the ratio of the total heat removed during the annual cooling season by total energy consumed in the same season [38]. The Sensible Coefficient of Performance (SCOP) is defined as the ratio of net sensible cooling capacity divided by total power required to produce that cooling (excluding reheat and humidifier) n consistent units [39] [40]. This metric was chosen to computer room air conditioner due to the unique nature and operation of data center facilities.
For electrical equipment different metrics have been proposed [2]. UPS load factor gauges the relation between the peak value and the nominal capacity. UPS system efficiency shows the relation of the output power and the input power. Lighting density shows the lighting power consumption per area.
Data center sustainability metrics have also been introduced. The Green Energy Coefficient (GEC) measures the percentage of total energy sourced from alternative energy sources, such as solar, wind, or geothermal plants, and encourages the use of renewable energy [41]. Carbon Usage Effectiveness (CUE) measures total CO2 emissions in relation to IT equipment energy consumption [42]. Water Usage Effectiveness (WUE) measures total water usage in relation to IT equipment energy consumption [43]. Energy Reuse Effectiveness (ERE) gauges how energy is reused outside of the data center. It is calculated as the total energy minus reuse energy divided by IT equipment energy, or the Energy Reuse Factor (ERF) calculated as the reuse energy divided by the total energy [44]. The Electronic Disposal Efficiency (EDE) measures how responsible the discarded electronic and electrical equipment are managed, as the ratio of equipment disposed of through known responsible entities and the total of equipment disposed [45].
Other metrics quantify energy consumption related to environmental sustainability. The following categories of metrics are defined: IT strategy, IT hardware asset utilization, IT energy and power efficient hardware deployment, and site physical infrastructure overhead [46]. For those metrics different factors are defined, such as, the Site-Infrastructure Power Overhead Multiplier (SI-POM) estimated as the power consumption at the utility meter divided by the total power consumption at the plug of all IT equipment; the IT Hardware Power Overhead Multiplier (H-POM), estimated as the ratio of the AC hardware load at the plug and the DC hardware compute load, showing the IT equipment efficiency; the Deployed Hardware Utilization Ratio (DH-UR), estimated as the number of servers running live applications divided by the total servers deployed, or as the ratio of terabytes of storage holding data and the total of terabytes of storage deployed; the Deployed Hardware Utilization Efficiency (DH-UE) measured as the ratio of minimum number of servers required for peak compute load and the total number of servers deployed, which shows the possibilities of virtualization; and free cooling [46]. The Free Cooling metric estimates potential savings using outside air; and the Energy Save metric calculates the amount of money, energy, or carbon emission savings that accrue if IT equipment hibernates while it is not in use [46].
After recognizing the need for performance metrics that better capture the efficiency of a given data center, different entities have proposed metrics that measure the functionality of the data center (e.g. amount of computations it performs) and relate that to energy utilization. An example of these are metrics to track useful work produced at a data center compared to power or energy consumed producing it. “Useful work” is defined as the tasks executed in a period of time, each one having a specific weight related to its importance.
Different productivity metrics have also been proposed. Although they are often specific to each user’s activity, these metrics provide a framework for comparison. The Data Center Performance Efficiency metric is the ratio of useful work to total facility power [30]. The Data Center Energy Productivity (DCeP) metric is defined as the amount of useful work produced, divided by the total data center energy consumed producing it [47]; The Data Center Compute Efficiency (DCcE) metric gauges the efficiency of compute resources, intended to find areas of improvement [48]; The Data Center Storage Productivity (DCsP) metric expresses the ratio of useful storage system work to energy consumed [49].
Fixed and proportional overhead metrics help analysts and managers understand how energy and cost influences the use of IT equipment. The fixed portion of energy consumption considers use when all IT equipment are unused. The variable part takes into account IT equipment load [50]. The Data Center Fixed to Variable Energy Ratio (DC-FVER) metric, defined as the fixed energy divided by the variable energy plus one (1 + fixed energy / variable energy). It shows the inefficiencies through the wasted energy not delivering ‘useful work’. The metric reflects the proportion of energy consumption that is variable, considering IT equipment, software and infrastructure [51]. Metrics related to energy-proportional computing, based on computing systems consuming energy in proportion to the work performed have been proposed. The Idle-to-Peak power Ratio (IPR) metric is defined as the ratio system’s idle consumption with no utilization over the full utilization power consumption [52]. The Linear Deviation Ratio (LDR) metric, shows how linear power is, compared to utilization curve [52].
Other metrics have been also proposed. The Digital Service Efficiency (DSE) metric shows the productivity and efficiency of the infrastructure through performance, cost, environmental impact, and revenue. Performance is measured by transactions (buy or sell) per energy, per user, per server and per time. Cost is measured by amount of money per energy, per transaction and per server. Environmental impact is estimated in metric tons of carbon dioxide per energy and per transaction. Revenue is estimated per transaction and per user [53]. The Availability, Capacity and Efficiency (ACE) performance assessment factors in the availability of IT equipment during failures, the physical capacity available, and how efficient the cool air delivery to IT equipment is [54].
Metrics that combine measurements of efficiency and productivity have been also proposed. The Corporate Average Datacenter Efficiency (CADE), estimated as the IT equipment efficiency factored by the facility efficiency (CADE = IT equipment efficiency × facility efficiency = IT equipment asset utilization × IT equipment energy efficiency × Site asset utilization × Site energy utilization) [55]. The Data Center Energy Efficiency and Productivity (DC-EEP) index results from multiplying the IT Productivity per Embedded Watt (IT-PEW) and the Site Infrastructure Energy Efficiency ratio (SI-EER) [56].The IT organization is mainly responsible for the IT-PEW. The SI-EER is measured dividing the power required for the whole data center by the conditioned power delivered to the IT equipment.
The Datacenter Performance per Energy (DPPE) considers four sub-metrics: IT Equipment Utilization (ITEU), IT Equipment Energy Efficiency (ITEE), Power Usage Effectiveness (PUE) and Green Energy Coefficient (GEC). ITEU is the ratio of total measured power of IT equipment to total rated power of IT equipment. ITEE is the ratio of total rated capacity of IT equipment and total rated energy consumption of IT equipment. PUE is the total energy consumption of the data center divided by the total energy consumption of IT equipment, which promotes energy saving of facilities. GEC is the green energy divided by the total energy consumption of the data center, which promotes the use of green energy. Then the metric is defined as DPPE = ITEU × ITEE × 1/PUE × 1/ (1-GEC) [57].
The Performance Indicator (PI) metric was introduced to visualize the data center cooling performance in terms of the balance of the following metrics: thermal conformance, thermal resilience and energy efficiency [58] [59]. IT thermal conformance indicates the proportion of IT equipment operating within recommended inlet air temperatures ranges during normal operation. IT thermal resilience shows if there is any equipment at risk of overheating in case redundant cooling units are not operating due to a failure or planned maintenance. Energy efficiency is measured through the PUE ratio, and it indicates how the facility is operated compared to pre-established energy efficiency ratings.
Different measurements for operational performance have been proposed recently. The methodology Engineering Operations Ratio [60] shows the systems operational performance related to its design, as the operational effectiveness for each component (e.g., designed PUE related to actual PUE). The Data Center Performance Index [61], takes into account three categories: availability, efficiency and environmental. Availability is measured through the number of incidents or the time of loss of service; performance is gauged through Power Usage Effectiveness (PUE) and Water Usage Effectiveness (WUE); and environmental is assessed using the Greenhouse Gas (GHG) emissions. Possible indexes are A, B, C, D or not qualifying.
In addition, there have been different proposals to incorporate probability and risk to data center key indicators. The Class metric indicates the probability of failure of a data center in the next 12 months, and the associated risk is the Class multiplied by the consequences [62]. It is based on the standard IEEE-3006.7 [63], where Class (also called unreliability) is defined as one minus reliability. The Data Center Risk Index ranks different countries related to the probability of the factors that affect operations of the facility. Those factors include energy (cost and security), telecommunications (bandwidth), sustainability (alternative energy), water availability, natural disasters, ease of doing business, taxes, political stability, and GDP per capita [64]. The index is mainly designed to contribute on decisions based on the risk profile of the country, although it does not take into account specific business requirements or the fact that some risks can be mitigated.
The authors of this paper have previously proposed a Data Center Site Risk metric [65], to help evaluate data center sites and compare them to each other, or to compare different scenarios where the data center operates. The methodology for the Data Center Site Risk metric of a specific location is simplified in four steps: the first one is to identify threats and vulnerabilities; the second is to quantify the probability of occurrence of the events; the third one is to estimate potential consequences or impact of the events; and the last one to calculate the total risk level considering weights.
Existing data center metrics reviewed in this paper are listed in Table A.1 (Appendix A), classified by type and main promoter. Each metric listed uses its own definition for terms such as efficiency, productivity, performance, risk, among others, which must be taken into account when doing comparisons. In addition, there has been academic research in specific data center metrics and risk, such as a modified PUE metric using power demand [66], PUE for a CCHP Natural gas or Biogas Fuelled Architecture [67], PUE for application layers [68], performance metrics for communication systems [69], load dependent energy efficiency metrics [70], workload power efficiency metric [71], airflow and temperature risk [72], power distribution systems risk [73], quality of service and resource provisioning in cloud computing [74][75][76], life cycle cost using a risk analysis model [77], risk for cloud data center overbooking [78], risk management for virtual machines consolidation [79], risk management under smart grid environment [80], and risk for data center operations in deregulated electricity markets [81].
These joint efforts have significantly improved efficiency on the data center infrastructure so that energy consumption has started to flatten out over time [2].
4. Multidimensional Approach for New Family of Data Center Metrics
Existing metrics fail to incorporate important aspects such as the risk involved in processes and operations, for a holistic understanding of the data center behavior. This being the case, comparisons between data center scores with the purpose of evaluating areas of improvement is not an easy task. Furthermore, currently there is no metric that examines performance and risk simultaneously. A data center may have high performance indicators, with a high risk of failure. Research must therefore be refocused to incorporate risks, management and performance. Having this information may work as an early warning system so that mitigation strategies and actions are undertaken on such mission critical facilities.
A new family of metrics can help understand the performance of new and existing data centers, including their associated risk. The proposed novel data center multidimensional scorecard effectively combines performance and risk. Performance is inspected across four different sub-dimensions: productivity, efficiency, sustainability and operations. Risk associated with each of those sub-dimensions is contemplated. External risks are also considered independently of performance, namely site risk.
Figure 3 shows a diagram of the proposed data center multidimensional metric. It is important to highlight that correlation can exist between the different elements of the scorecard; however, for the sake of the explanation this proposal has been simplified by assuming there is no correlation between different performance sub-dimensions. Measurements through different mechanisms are explained below.
4.1 Productivity
Productivity gives a sense of work accomplished and can be estimated through different indicators, such as the ratio of useful work completed to energy usage, or useful work completed to the cost of the data center.
Useful work can be understood as the sum of weighted tasks carried out in a period, such as transactions, amount of information processed, or units of production. The weight of each task is allocated depending on its importance. A normalization factor should be considered to allow the addition of different tasks.
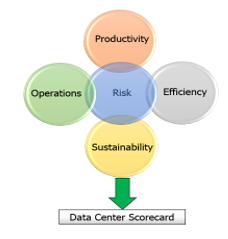 Figure 3: Data center multidimensional metric
Table 1 presents general concepts for these productivity measurements.
Table 1. Productivity measurements
| Productivity | Concept |
| Useful work | – Sum of weighted tasks carried out in a period.
– Useful work per energy consumption. – Useful work per physical space. – Useful work to cost of the data center. |
| Downtime | – Actual downtime, in terms of length, frequency, and recovery time.
– A separate measurement within this category will calculate the impact of downtime on productivity, measured as the ‘useful work’ that was not carried out as well as other indirect tangible and intangible costs due to this failure. To obtain the data a process needs to be established where downtime data (date, time and duration) is sent to this system. To calculate the impact on productivity a scale could be defined based on previous reports of data center outages costs [3]. |
| Quality of service | Quality of service measurements compared to pre-established values. These measurements can include variables in the time domain (e.g., maximum or average waiting time, congestion detection, latency), or scheduling and availability of resources. |
Obtaining data to estimate these metrics requires a process for measuring ‘useful work’, and costs for the specific data center. Cost includes capital expenditures (fixed assets and infrastructure equipment) and operating expenses (energy, human resources, maintenance, insurance, taxes, among other). When including monetary values, and comparing these metrics across time, all future values of money need to be brought to present value so the comparison is consistent. Once processes are in place, calculations of these metrics can be performed in real-time automatically.
4.2 Efficiency
Efficiency has been given substantial attention due to the high energy consumption of the data center sector. Many initiatives have emerged to measure efficiency. Key indicators show how energy efficient site infrastructure, IT equipment, environmental control systems, and other systems are. Power consumption and utilization data can be directly collected from various equipment elements. It can be measured through different energy efficiency measurements briefly explained in Table 2.
Table 2. Efficiency measurements
| Efficiency | Concept |
| Site infrastructure | The ratio of the energy delivered to IT equipment total to total energy used by the data center
The value becomes higher if is more efficient. Promotes energy management in facility. |
| IT equipment utilization | The ratio of total measured power of IT equipment to total rated power of IT equipment.
The value becomes higher if is more efficient. The lowest value if all IT equipment are unused. Promotes efficient operation of IT equipment. |
| IT equipment efficiency | The ratio of the total potential capacity of IT equipment and the total energy consumption of IT equipment.
The value becomes higher with more efficient IT equipment. Promotes the procurement of efficient IT equipment, with higher processing capacity per energy. |
| Physical space utilization | Physical space used divided by total physical space.
Energy consumption of all equipment divided by total physical space. It can also be measured in each cabinet (rack unit or area). Promotes efficient planning of physical space. |
4.3 Sustainability
Sustainability can be defined as development that addresses current needs without jeopardizing future generations’ capabilities to satisfy their own needs [82].
The sustainability of a data center can be measured in different ways, such as calculating the ratio of green energy sources to total energy, estimating the carbon footprint, or the water usage. In addition, an evaluation may be conducted on how environmentally friendly the associated processes, materials, and components are. Table 3 presents general concepts for these sustainability measurements.
Table 3. Sustainability measurements
| Sustainability | Concept |
| Carbon footprint | Each energy source can be assigned a different value of carbon footprint.
Use of existing and widely known methods to evaluate the greenhouse gas emissions (e.g., carbon dioxide, methane, nitrous oxide, fluorinated gases). This estimation can be automated. |
| Green energy sources | The ratio of green energy consumption to total energy consumption.
The data can be obtained automatically from real-time measurements. |
| Water usage | The ratio of total water used to energy consumption of IT equipment.
The data can be obtained automatically from real-time measurements. |
| Environmentally friendly | How environmentally friendly processes, materials and components are.
The information is collected by conducting an analysis or audit of processes. It must be updated if a process changes. |
4.4 Operations
Operations measurements gauge how well managed a data center is. This must include an analysis of operations, including site infrastructure, IT equipment, maintenance, human resources training, and security systems, among other factors. Audits of systems and processes are necessary to gather the required data. This data should include factors such as documentation, planning, human resources activities and training, status and quality of maintenance, service level agreement, and security. Table 4 shows general concepts for the operations measurements recommended.
Table 4. Operations measurements
| Operations | Concept |
| Documentation | Procedures and policies for data center should be formally documented.
All information should be available in digital format. |
| Planning | Effective planning is desired to reduce downtime.
Planning for maintenance, new components, relocations, upgrades, replacements, and life cycle evaluations are needed. |
| Organization and human resources. | Organizations with an integrated approach are desired, including interactions between different departments and reporting chain.
Personnel with the required qualifications and technical training is needed to properly operate the facility. |
| Maintenance | Preventive, reactive and deferred maintenance programs are required. Consider the equipment manufacturer or vendor recommendations.
Predictive maintenance and failure analysis programs should be included. Maintenance management systems are desired to track the status, frequency and quality of the related activities. |
| Service level agreement | The commitment that prevails with the service provider, including the quality, availability and responsibilities for the service. |
| Security | Electronic and physical security. Evaluated and assessed against pre-established scales. |
Different organizations have recognized the importance to standardize the operation and management of data centers, and have contributed to standards addressing this issue. They can be used as guidelines for quantifying the relatively subjective variables that comprise this sub-dimension. The “Data Center Site Infrastructure Tier Standard: Operational Sustainability” from Uptime Institute [83] includes management and operations. The “Data Centre Operations Standard” from EPI addresses operations and maintenance requirements [84]. BICSI is currently developing the new Data Center Operations standard (BICSI-009) to be used as a reference for operations and maintenance after a data center is built.
4.5 Risk
Data center performance cannot be completely evaluated if the risks that may impact it are not considered. Optimization must involve risk, defined as potential threats that, if materialized, could negatively impact the performance of the data center.
The new family of data center metrics intends not only to measure performance for each process area, but also to associate it with its level of risk. That way, the user may implement actions to achieve the optimum performance and later adjust that performance to a tolerable level of risk, which may again deviate the metrics from their optimum performance. In the long term, if variables remain unchanged, this model will lead to a stable equilibrium.
Risk of these sub-dimensions of performance, as well as the external risk which is independent of performance, are also measured through the use of metrics. They can be described as a causal system, where output depends on present and past inputs. An important strategy to reduce probability of failure is redundancy of resources, but this component may affect performance and costs [4].
4.5.1 Risk associated to performance
Table 5 presents general concepts for estimating the risk of the four identified sub-dimensions of performance.
Table 5. Risk related to performance
| Risk | Concept |
| Productivity risk | Assessed as the downtime probability of occurrence times its impact. The probability is estimated using present and past data of downtime.
Impact of downtime on productivity is calculated (e.g., the work that was not carried out with the required quality of service, as well as other indirect tangible and intangible costs associated with a failure). The impact would consider the cost of downtime [3]. |
| Efficiency risk | Estimated with the ratio of processing utilization, IT equipment, physical space utilization, and IT equipment energy utilization, to their respective total capacities.
Considers projected growth. When utilization is close to or at capacity, there is no room for growth, which means the risk that future projections will not be met is high. This directly influences performance. |
| Sustainability risk
|
Considers historic behavior of the different green energy sources, the percentage composition of each source, and their probability of failure. |
| Operations risk
|
Assessed by the operational risk, including documentation, planning, organization and human resources, maintenance, service level of agreement, and security.
Analysis of historical data in order to estimate probability of failure due to improper operation in the areas identified, and its impact on performance. |
4.5.2 External risk
Performance risks are not the only risks involved in the data center. There are other major risk factors that are external to the actual operation of the data center that must be considered in this analysis, namely site risk.
The authors of this paper have previously proposed a data center site risk metric [65] [85], which is a component of the comprehensive family of new data center metrics proposed in this paper. The methodology of the site risk metric helps identify potential threats and vulnerabilities that are divided into four main categories: ‘utilities’, ‘natural hazards and environment’, ‘transportation and adjacent properties’, and ‘other’. The allocation of weights among each category is based on the significance of the impact of these factors on the data center operation [85].
The methodology quantifies the probability of occurrence of the events according to five pre-established levels of likelihood, and estimates potential consequences of each event using five pre-established levels of impact. It calculates the total risk level associated to the data center location by multiplying the probability of occurrence by the consequences or impact of each threat. That product is then multiplied by the respective weight.
Through this analysis, the different threats and vulnerabilities can be prioritized depending on the values of the probability of occurrence, impact, and the assigned weight. Understanding risk concentration by category can add value when analyzing mitigation strategies. This methodology provides a good sense of what the different risks and potential threats and vulnerabilities are for a data center site.
The site risk metric score is summarized into a time dependent function for a specific time instant [85]:
Data Center Site Risk Score =
Where:
i: Threat categories (i = 1,…,t)
tc: Total number of threat categories (tc = 4)
(i=1: Services, i=2: Natural disasters, i=3: Transportation and adjacent properties, i=4: Other).
j: Specific threat (j=1,… ki).
: Number of threats for each category
(e.g., k1=5, k2=10, k3=10, k4=6).
: Risk level for the specific threat.
: Adjusted weight for the specific threat.
The risk level (RL):
Where:
: Probability of occurrence of the specific threat.
: Impact of the specific threat.
The adjusted weight (W2) for the threat:
Where:
: Weight of the specific category.
: Weight of the specific subcategory.
The data center site risk metric varies from 1 to 25, where 1 is the lowest level and 25 is the highest level of risk achievable for a specific site. The user must determine an acceptable level of risk, so that if the final score lies above that level, that particular location is not recommended.
4.6 New family of Data Center Metrics
The proposed new family of data center metrics can be summarized into a time dependent function, to be further developed. For a specific time instant, regardless of the correlation between different parameters, the data center score can be defined as a function of different metrics, risks and weights:
Data Center Score =
= f (P1, P2, P3, P4, R1, R2, R3, R4, RE, W1, W2, W3, W4)
= f (Pi, Ri, RE, Wi) with i=1,…,4
Where: Pi: Performance.
Ri: Risk of process.
RE: External risk.
Wi: Weight of each category.
And sub-indexes: 1: Productivity.
2: Efficiency.
3: Sustainability.
4: Operations.
To the best possible extent, each value and weight assigned to each key indicator must be backed with enough support such as research or facts that lead to such conclusions. The outcome is a scorecard that assists in finding areas of improvement, which should be strategically addressed. The quality of information used before assigning each value is very important. Equally weighted data center scores are desired, since a data center must be productive, efficient, well managed and sustainable.
The new family of data center metrics scorecard can be taken as a decision-making trigger. It involves both technical and non-technical aspects, as failures and risks may not only be due to technical issues but also to non-technical ones such as human error. The metrics should measure parameters and processes. Given some premises, a data center may be ideal at a certain point in time, but when conditions change, that same data center may not be optimal. Depending on the final score calculated with the value of the dimensions, the scorecard would rank each data center on a scale to be defined, which allows for tangible comparisons between different data centers, or ‘before and after’ on the same data center. The multidimensional metric can also be transformed through different operators as a composite metric with just one value. Furthermore, the proposed metric has the possibility to incorporate new performance and risk measurements in the future, preventing it from becoming outdated.
4.7 Visualization tool
To confirm cross-comparability all the different indicators can be normalized. Each key indicator for performance can be presented in a scale interpreted in such a way that a higher value implies a more positive outcome, so minimum and maximum values correspond to the worst and best possible expected outcomes. Conversely, each risk value can be presented in a scale interpreted as a higher value implies a higher level of risk, and a more undesirable scenario. Figure 4 shows an example with indicators selected arbitrarily for illustrative purposes.
The graph (Figure 4) shows that the data center has a high productivity level, followed by efficiency, but its operations and sustainability indicators show greater room for improvement. Levels of risk associated to each category and site risk are low. Risk tolerance depends on the user, but working with this example, if we hypothetically set a maximum tolerable risk of 25%, actions would need to be implemented to reduce the risk related to productivity.
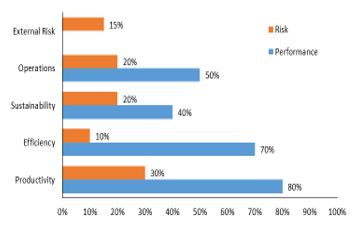 Figure 4: Data center multidimensional metric
Spider graphs can be generated to allow straightforward visual comparisons and trade-off analysis between different scenarios. This is very helpful when simulating or forecasting different strategies. It also enables clear reporting to stakeholders. Figure 5 shows an example with two different data centers, at different times that can involve specific strategies implemented.
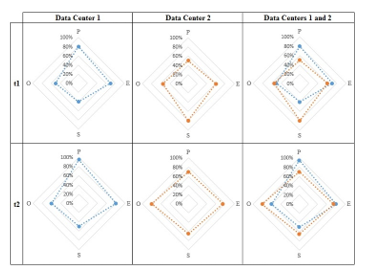 Figure 5: Data center multidimensional performance metric comparison (P: Productivity, E: Efficiency, O: Operations, S: Sustainability)
Edges of diamonds show measurement of the four dimensions of performance: productivity (P), efficiency (E), sustainability (S) and operations (O). The larger the diamond, the better the performance. It can be intuitively seen that in the scenario of time 1 (t1), data center 1 is more productive and efficient, but less sustainable and not so well operated, compared to data center 2. Over time (from t1 to t2), data center 1 has improved all its performance components, but data center 2 has worsened the sustainability indicator and improved all other values. Risk can be analyzed in a similar spider graph, but for simplicity, it was not included in Figure 5.
4.8 Automation
Equipment needs permanent monitoring and maintenance to assure proper and efficient performance. Measurements should be automatic when possible as the automated metrics receive information directly from the different systems that quantify parameters. Real-time collection of relevant data is required for reliable metrics. Obtaining it is not a trivial task, especially in existing data centers that lack adequate instrumentation to collect the data [22], or if the related process cannot be easily automated. This underscores the need for new approaches to data center monitoring and management systems [86] [87]. Gathering the right data and understanding its nature is more important than simply collecting more data [88].
Real-time data can be gathered and updated automatically through a monitoring and management system [87] for parameters such as power consumption, temperature, humidity, air flow, differential air pressure, closure, motion, vibration, and IT equipment resource utilization. Improvements by some equipment manufacturers include the ability to directly access measurements of power, temperature, airflow, and resource utilization for each device. These measurements may include parameters such as the air inlet temperature, airflow, outlet temperature, power utilization, CPU utilization, memory utilization, and I/O utilization. Platform level telemetry can transform data center infrastructure management, allowing direct data access from the equipment processor [89]. Other parameters, such as some aspects of sustainability, operations and external risks, are more difficult to automate, since they require audits, human observation, evaluation, analysis, and the need to be periodically updated. All required data must be entered, automatically or manually, into a system in order to estimate all metrics and to visualize results clearly for decision-makers to undertake adequate actions.
5. Conclusions
The novel family of data center metrics as described in the paper provides a comprehensive view of the data center, using a multidimensional approach to combine performance (including productivity, efficiency, sustainability and operations) and risks (associated to performance and site risk). Using this approach, areas of improvement around which to create a strategy can be detected.
Given the mission critical nature of data centers, metrics must provide a holistic, yet quantitative, understanding of the data center behavior, in order to improve the utilization of all the resources involved. When issues identified by the metrics are addressed, processes can be optimized or moved closer to their desired point based on the vision for the data center.
Actions undertaken will impact the metric results in real time. When variables are re-measured, the result of the metrics should improve. As a result, new strategies may lead to modification of the overall metric as related to performance and risk values. This does not mean attempting to achieve the optimal performance. It is different from existing metrics in that it does not limit itself to measuring a value whose optimization can be automated, instead, this is only part of its scope. It aggregates measurements from multiple aspects to provide a global and objective vision to decide the extent to which optimization is desired. To recognize trends or predict future behavior, tools such as predictive analysis and machine learning are required. Machine learning considers algorithms that can learn from and make predictions on data.
The new family of data center metrics may contribute to standardize a process that eventually becomes a best practice. It may help to assess data centers, to compare them to each other, to make comparisons between different scenarios, and to provide a ranking of how the data center behaves. The outcome is a scorecard that will constitute a strong basis for decision-making.
6. Future Research
Further research needs to be conducted to assess and validate the new family of data center metrics proposed, based on a multidimensional approach and including performance and risk, in order to understand which parameters are most reasonable to use for each specific purpose.
Studying the correlation between the different metric scores and their associated parameters and risks, simulations of different scenarios can help to visualize how a change in parameters impacts risk, and likewise, how a change in risk factors affects metric results. Since there are currently no solutions available that include all proposed factors, new dynamic models and simulation tools are needed to validate and calibrate the metric. This would assist in implementing numerous data center strategies to improve metrics, for which a theoretical approach must be conducted. By tracking the proposed metric, the data center stakeholders will better understand data center performance and risk in a multidimensional view.
- Levy and D. Raviv, “A Novel Framework for Data Center Metrics using a Multidimensional Approach,” 15th LACCEI International Multi-Conference for Engineering, Education, and Technology: Global Partnerships for Development and Engineering Education. Boca Raton, FL, 2017.
- Ernest Orlando Lawrence Berkeley National Laboratory, “United States Data Center Energy Usage Report. LBNL-1005775,” 2016.
- Ponemon Institute LLC, “Cost of Data Center Outages. Data Center Performance Benchmark Series,” 2016.
- Minas and B. Ellison, Energy Efficiency for Information Technology: How to Reduce Power Consumption in Servers and Data Centers. Intel Press, 2009.
- “Data Center Design and Implementation Best Practices,” ANSI/BICSI 002, 2014.
- Greenberg, E. Mills, and B. Tschudi, “Best Practices for Data Centers: Lessons Learned from Benchmarking 22 Data Centers,” 2006 ACEEE Summer Study on Energy Efficiency in Buildings. Pacific Grove, CA, pp. 76–87, 2006.
- Bouley, “Estimating a Data Center’s Electrical Carbon Footprint. White paper #66,” APC by Schneider Electric. 2012.
- S. Department of Energy. Office of Energy Efficiency & Renewable Energy, “10 Facts to Know About Data Centers,” 2014. [Online]. Available: http://energy.gov/eere/articles/10-facts-know-about-data-centers.
- Ahmad and S. Ranka, “Chapter 43: Overview of Data Centers Energy Efficiency Evolution,” in Handbook of Energy-Aware and Green Computing, vol. 2, CRC Press, 2012, pp. 983–1027.
- The Climate Group – Global eSustainability Initiative (GeSI), “SMART 2020: Enabling the low carbon economy in the information age,” 2008.
- A. Laitner and K. Ehrhardt-Martinez, “Information and Communication Technologies: The Power of Productivity,” American Council for an Energy-Efficient Economy, Washington, DC, 2008.
- ASHRAE Technical Committee 9.9, “2011 Thermal Guidelines for Data Processing Environments – Expanded Data Center Classes and Usage Guidance,” 2011.
- ASHRAE Technical Committee 9.9, “Data Center Networking Equipment – Issues and Best Practices,” 2012.
- ASHRAE Technical Committee 9.9, “Data Center Storage Equipment – Thermal Guidelines , Issues , and Best Practices,” pp. 1–85, 2015.
- “Energy Standard for Data Centers,” ANSI/ASHRAE 90.4, 2016.
- “Green data centres – Part 1: Energy and environmental management systems,” Singapore Standards SS 564, 2013.
- “Telecommunications Infrastructure Standard for Data Centers,” ANSI/TIA-942-B, 2017.
- Turner, J. H. Seader, V. Renaud, and K. G. Brill, “Tier Classifications Define Site Infrastructure Performance,” Uptime Institute, 2006.
- “Data Center Site Infrastructure Tier Standard: Topology,” Uptime Institute, 2018.
- Howard, “H.R. 2126: The Energy Efficiency Improvement Act,” 2014. [Online]. Available: http://www.usgbc.org/articles/hr-2126-energy-efficiency-improvement-act.
- Scott, “Data Center Optimization Initiative (DCOI). Memorandum,” 2016.
- The Green Grid, “PUETM: A Comprehensive Examination of the Metric. White paper # 49,” 2012.
- The Green Grid, “Green Grid Metrics: Describing Data Center Power Efficiency. Technical Committee White Paper,” 2007.
- The Green Grid, “Green Grid Data Center Power Efficiency Metrics: PUE and DCIE. White paper # 6,” 2008.
- S. Environmental Protection Agency, “Energy Star for Data Centers Scheduled Portfolio Manager Release on June 7 , 2010,” 2010.
- Lintner, B. Tschudi, and O. VanGeet, “Best Practices Guide for Energy-Efficient Data Center Design,” U.S. Department of Energy, 2011.
- Horner and I. Azevedo, “Power usage effectiveness in data centers: overloaded and underachieving,” The Electricity Journal, vol. 29, no. 4. Elsevier Inc., pp. 61–69, 2016.
- Avelar, D. Azevedo, and A. French, PUETM: A Comprehensive Examination of the Metric. Atlanta, GA: ASHRAE Datacom Series, 2012.
- Andrea, “Data Center Standards. Data Center Size and Density. White paper DCISE-001.” The Strategic Directions Group Pty Ltd, 2014.
- P. Ray, “The green grid saga – a green initiative to data centers: a review,” Indian J. Comput. Sci. Eng., vol. 1, no. 4, pp. 333–339, 2010.
- Sharma, C. H. Hsu, and W. C. Feng, “Making a Case for a Green500 List,” 20th IEEE International Parallel & Distributed Processing Symposium (IPDPS) Workshop on High-Performance, Power-Aware Computing (HP-PAC). Rhodes Island, Greece, 2006.
- -D. Lange and K. Huppler, Server Efficiency: Metrics for Computer Servers and Storage. Atlanta, GA: ASHRAE Datacom Series, 2015.
- Sun Microsystems Inc, “Sun Sparc ® Enterprise T5120 and T5220 Server Architecture. White Paper,” 2007.
- K. Herrlin, “Rack Cooling Effectiveness in Data Centers and Telecom Central Offices: The Rack Cooling Index (RCI),” ASHRAE Trans., vol. 111, no. 2, pp. 725–731, 2005.
- K. Herrlin, “Airflow and Cooling Performance of Data Centers: Two Performance Metrics,” ASHRAE Trans., vol. 114, no. 2, pp. 182–187, 2008.
- D. Patel, R. K. Sharma, C. E. Bash, and M. Beitelmal, “Energy Flow in the Information Technology Stack: Coefficient of Performance of the Ensemble and its Impact on the Total Cost of Ownership.” Hewlett-Packard Development Company, 2006.
- G. Brill and L. Strong, “Cooling Capacity Factor (CCF) Reveals Stranded Capacity and Data Center Cost Savings. White paper.” Upsite Technologies, Inc., 2013.
- “2017 Standard for Performance Rating of Unitary Air-conditioning & Air-source Heat Pump Equipment,” Air Conditioning Heating and Refrigeration Institute AHRI 210/240, 2017.
- “2016 Standard for Performance Rating of Computer and Data Processing Room Air Conditioners,” Air Conditioning Heating and Refrigeration Institute AHRI 1360, 2016.
- “Method of Testing for Rating Computer and Data Processing Room Unitary Air Conditioners,” ANSI/ASHRAE Standard 127-2012, 2012.
- The Green Grid et al., “Harmonzing Global Metrics for Data Centers Energy Efficiency,” 2012.
- The Green Grid, “Carbon Usage Effectiveness (CUE): A Green Grid Data Center Sustainability Metric. White paper # 32,” 2010.
- The Green Grid, “Water Usage Effectiveness (WUE): A Green Grid Data Center Sustainability Metric. White paper # 35,” 2011.
- The Green Grid, “ERE: A Metric for Measuring the Benefit of Reuse Energy From a Data Center. White paper # 29,” 2010.
- The Green Grid, “Electronics disposal efficiency (EDE): an IT recycling metric for enterprises and data centers. White paper #53,” 2012.
- R. Stanley, K. G. Brill, and J. Koomey, “Four Metrics Define Data Center Greenness,” Uptime Institute, 2007.
- The Green Grid, “A framework for data center energy productivity. White paper # 13,” 2008.
- The Green Grid, “The green grid data center compute efficiency metric: DCcE. White paper # 34,” 2010.
- The Green Grid, “The Green Grid Data Center Storage Productivity Metrics (DCsP): Application of Storage System Productivity Operational Metrics. White paper #58,” 2014.
- Newcombe, “Data centre energy efficiency metrics: Existing and proposed metrics to provide effective understanding and reporting of data centre energy. White Paper,” BCS Data Centre Specialist Group, 2010.
- Newcombe, Z. Limbuwala, P. Latham, and V. Smith, “Data centre Fixed to Variable Energy Ratio metric DC – FVER: An alternative to useful work metrics which focuses operators on eliminating fixed energy consumption. White Paper,” BCS Data Centre Specialist Group, 2012.
- Ahmad and S. Ranka, “Chapter 44: Evaluating Performance, Power, and Cooling in High-Performance Computing (HPC) Data Centers,” in Handbook of Energy-Aware and Green Computing, vol. 2, CRC Press, 2012, pp. 1029–1049.
- eBay Inc, “Digital Service Efficiency – Solution Brief. White paper,” San Jose, CA, 2013.
- King and S. Davies, “ACE Performance Assessment – Empowering the Data Center Operator. White paper,” Future Facilities, 2014.
- Kaplan, W. Forrest, and N. Kindler, “Revolutionizing data center energy efficiency.” McKinsey & Company, pp. 1–13, 2008.
- G. Brill, “Data Center Energy Efficiency and Productivity,” Uptime Institute, 2007.
- Green IT Promotion Council, “Concept of New Metrics for Data Center Energy Efficiency – Introduction of Datacenter Performance per Energy [DPPE],” Japan, 2010.
- The Green Grid, “New Metric To Assess and Visualize Data Center Cooling,” 2016. [Online]. Available: http://www.thegreengrid.org/~/media/Press Releases/The Green Grid_Press Release_Performance Indicator New metric_vFINAL.pdf.
- The Green Grid, “The Performance Indicator Assessing and Visualizing Data Center Cooling Performance. White Paper,” 2016.
- Infrastructure Masons, “Engineering operations ratio. White paper.” 2016.
- Infrastructure Masons, “Data Center Performance Index. White paper.” 2017.
- Miller, “Class: New data center metric targets probability and risk,” 2015. [Online]. Available: http://datacenterfrontier.com/class-new-data-center-metric-targets-probability-of-failure/.
- “IEEE Recommended Practice for Determining the Reliability of 7×24 Continuous Power Systems in Industrial and Commercial Facilities,” IEEE Std 3006.7, 2013.
- Cushman & Wakefield, “Data Centre Risk Index,” 2016.
- Levy and D. Raviv, “A framework for data center site risk metric,” IEEE 8th Annual Ubiquitous Computing, Electronics and Mobile Communication Conference (UEMCON). New York City, NY, pp. 9–15, 2017.
- Jaureguialzo, “PUE: The Green Grid metric for evaluating the energy efficiency in DC (Data Center). Measurement method using the power demand,” 2011 IEEE 33rd International Telecommunications Energy Conference (INTELEC). Amsterdam, 2011.
- De Angelis and U. Grasselli, “The next generation green data center a modified power usage effectiveness metric proposal for a CCHP natural gas or biogas fuelled architecture,” 2015 IEEE 15th International Conference on Environment and Electrical Engineering, (EEEIC). Rome, pp. 907–911, 2015.
- Zhou, Y. Shi, and C. Zhu, “AxPUE: Application level metrics for power usage effectiveness in data centers,” 2013 IEEE International Conference on Big Data. Silicon Valley, CA, pp. 110–117, 2013.
- Fiandrino, D. Kliazovich, P. Bouvry, and A. Y. Zomaya, “Performance Metrics for Data Center Communication Systems,” 2015 IEEE 8th International Conference on Cloud Computing. New York, NY, pp. 98–105, 2015.
- Schlitt and W. Nebel, “Load dependent data center energy efficiency metric based on component models,” 2012 International Conference on Energy Aware Computing. Guzelyurt, Cyprus, 2012.
- Wilde et al., “DWPE, a new data center energy-efficiency metric bridging the gap between infrastructure and workload,” 2014 International Conference on High Performance Computing & Simulation (HPCS). Bologna, pp. 893–901, 2014.
- Seymour and S. Ikemoto, “Design and management of data center effectiveness, risks and costs,” Annual IEEE Semiconductor Thermal Measurement and Management Symposium. San Jose, CA, pp. 64–68, 2012.
- Wiboonrat, “Risk anatomy of data center power distribution systems,” 2008 IEEE International Conference on Sustainable Energy Technologies, ICSET 2008. Singapore, Singapore, pp. 674–679, 2008.
- Liu, Y. Zhang, Y. Zhou, D. Zhang, and H. Liu, “Aggressive resource provisioning for ensuring QoS in virtualized environments,” IEEE Transactions on Cloud Computing, vol. 3, no. 2. pp. 119–131, 2015.
- Parida, S. C. Nayak, and C. Tripathy, “Truthful Resource Allocation Detection Mechanism for Cloud Computing,” The Third International Symposium on Women in Computing and Informatics (WCI ’15). New York, NY, pp. 487–491, 2015.
- C. Nayak and C. Tripathy, “Deadline sensitive lease scheduling in cloud computing environment using AHP,” J. King Saud Univ. – Comput. Inf. Sci., 2016.
- Wiboonrat, “Life cycle cost analysis of data center project,” 2014 Ninth International Conference on Ecological Vehicles and Renewable Energies (EVER). Monte-Carlo, Monaco, 2014.
- Tomas and J. Tordsson, “An autonomic approach to risk-aware data center overbooking,” in IEEE Transactions on Cloud Computing, vol. 2, no. 3, 2014, pp. 292–305.
- Jin, F. Zhang, S. Hu, and Z. Liu, “Risk management for virtual machines consolidation in data centers,” 2013 IEEE Global Communications Conference (GLOBECOM). Atlanta, GA, pp. 2872–2878, 2013.
- Yu, T. Jiang, Y. Cao, S. Yang, and Z. Wang, “Risk management in internet data center operations under smart grid environment,” 2012 IEEE Third International Conference on Smart Grid Communications (SmartGridComm). Tainan, Taiwan, pp. 384–388, 2012.
- Yu, T. Jiang, S. Member, Y. Cao, and S. Member, “Risk-constrained operation for internet data centers in deregulated electricity markets,” in IEEE Transactions on Parallel and Distributed Systems, vol. 25, no. 5, 2014, pp. 1306–1316.
- United Nations, “Report of the World Commission on Environment and Development: Our Common Future,” 1987.
- “Data Center Site Infrastructure Tier Standard: Operational Sustainability,” Uptime Institute, 2014.
- “DCOS – Data Centre Operations Standard,” EPI, 2016.
- Levy, “Análisis de Riesgos y Selección de Localidad: Dos Pilares Imprescindibles [Risk analysis and site selection: two essential pillars],” Datacenter Dynamics Focus, pp. 32–34, 2014.
- Levy and J. O. Hallstrom, “A New Approach to Data Center Infrastructure Monitoring and Management (DCIMM),” IEEE CCWC 2017. The 7th IEEE Annual Computing and Communication Workshop and Conference. Las Vegas, NV, 2017.
- Levy and J. O. Hallstrom, “A Reliable, Non-Invasive Approach to Data Center Monitoring and Management,” Advances in Science, Technology and Engineering Systems Journal, vol. 2, no. 3. pp. 1577–1584, 2017.
- Koomey and J. Stanley, “The Science of Measurement: Improving Data Center Performance with Continuous Monitoring and Measurement of Site Infrastructure,” 2009.
- L. Vincent and J. Kuzma, “Using Platform Level Telemetry to Reduce Power Consumption in a Datacenter,” 2015 31st Thermal Measurement, Modeling & Management Symposium (SEMI-THERM). Folsom, CA, 2015.