An Aggregation Model for Energy Resources Management and Market Negotiations
An Aggregation Model for Energy Resources Management and Market Negotiations
Volume 3, Issue 2, Page No 231-237, 2018
Author’s Name: Omid Abrishambaf, Pedro Fariaa), João Spínola, Zita Vale
View Affiliations
GECAD – Research Group on Intelligent Engineering and Computing for Advanced Innovation and Development, Institute of Engineering – Polytechnic of Porto (ISEP/IPP), Rua Dr. António Bernardino de Almeida, 431, 4200-072 Porto, Portugal
a)Author to whom correspondence should be addressed. E-mail: pnsfaria@gmail.com
Adv. Sci. Technol. Eng. Syst. J. 3(2), 231-237 (2018); ![]() DOI: 10.25046/aj030227
DOI: 10.25046/aj030227
Keywords: Demand Response, Aggregator, Distributed Generation, Smart grid, K-Mean Clustering

Export Citations
Currently the use of distributed energy resources, especially renewable generation, and demand response programs are widely discussed in scientific contexts, since they are a reality in nowadays electricity markets and distribution networks. In order to benefit from these concepts, an efficient energy management system is needed to prevent energy wasting and increase profits. In this paper, an optimization based aggregation model is presented for distributed energy resources and demand response program management. This aggregation model allows different types of customers to participate in electricity market through several tariffs based demand response programs. The optimization algorithm is a mixed-integer linear problem, which focuses on minimizing operational costs of the aggregator. Moreover, the aggregation process has been done via K-Means clustering algorithm, which obtains the aggregated costs and energy of resources for remuneration. By this way, the aggregator is aware of energy available and minimum selling price in order to participate in the market with profit. A realistic low voltage distribution network has been proposed as a case study in order to test and validate the proposed methodology. This distribution network consists of 25 distributed generation units, including photovoltaic, wind and biomass generation, and 20 consumers, including residential, commercial, and industrial buildings.
Received: 04 December 2017, Accepted: 27 January 2018, Published Online: 06 March 2018
1. Introduction
The present paper is an extension of work originally proposed in 2017 IEEE Manchester PowerTech [1]. The generation variation in Distributed Renewable Energy Resources (DRER) is a topic of introduction in a lot of research works, since they have a key role in nowadays power system [2]. By appropriate management on the consumption in demand side, energy efficiency and optimal energy usage should be addressed. Curtailment Service Provider (CSP), Virtual Power Player (VPP), and aggregator are entities that can provide reliable solutions for the management of consumption and generation resources, since these can be aggregated and represented as a unique resource in electricity markets [3-5].
In this context, an aggregator is responsible to optimally manage a certain number of resources in a region, and aggregate them as one resource. This simplifies the process of energy negotiation in electricity markets [6]. Moreover, if other players, such as Balance Responsible Parties (BRPs), exist in the network, the role of aggregator would be more efficient and important [7].
Nowadays, there are several European countries that employ the aggregator concept for electricity consumers [8]. As an example, France is one of these countries that accepted aggregated loads in every ancillary service program, and BRPs and aggregators have been reorganized based on [9], [10]:
- Performing electricity market negotiations, to calculate compensation costs by aggregator for BRP;
- Aggregator has no direct interaction with BRP, however, it establishes contract with an electricity supplier in order to have flexibility services.
In fact, an aggregator is accountable not only for DRERs, but also is responsible for Demand Response (DR) programs [10]. According to the Federal Energy Regulatory Commission (FERC) [11], DR program is referred as “Changes in electric use by demand-side resources from their normal consumption patterns in response to changes in the price of electricity, or to
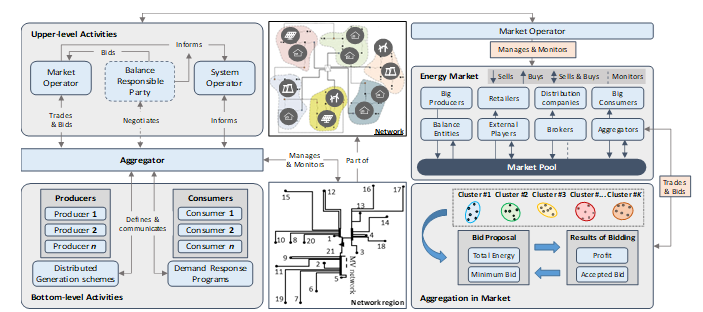 Figure 1. Overal architecture of the aggregation model.
incentive payments designed to induce lower electricity use at times of high wholesale market prices or when system reliability is jeopardized”. The role of an aggregator in terms of DR programs is to gather all electricity consumer who can participate in DR programs, and present them as one. Therefore, it can be considered as a flexible player [12]. For this purpose, the aggregator can establish bidirectional contracts with end-users for DR programs to manage consumption resources, and consequently, to have flexibility in electricity market negotiations. In order to manage the generation of end-users, which are considered as prosumer (a consumer who is able to produce electricity), the aggregator can play the role of VPP, as [13]-[14] demonstrated before. It is clear that the generation capacity of these prosumers is not significant, thus, the network management would be difficult for system operators. Therefore, the need of a third party, namely an aggregator, is evident to gather all these small-scale consumption and generation resources, and participate in electricity market.
This paper represents an optimization based aggregation model for DRERs and DR programs managements, which enables small and medium resources to have active participation in the electricity markets. The aggregator controls demand-side customers by providing them several tariffs based DR programs, which brings flexibility in the electricity market negotiations. Moreover, this aggregator model gathers energy of resources and aggregated costs to be aware of available energy and minimum selling cost for defining remunerations, and also participate in the market with profit.
The rest of the paper is organized as follow. Section 2 details the aggregator model architecture considered for the aggregation. Section 3 describes the mathematical formulation considered for the optimization problem and aggregation process. Section 4 explains a case study that will test and validate the proposed method, and its results are expressed in Section 5. Finally, main conclusions of the work are proposed in Section 6.
2. Aggregator Model Architecture
This section focuses on how the presented aggregation model performs scheduling, aggregating and remuneration. The overall view of the presented model is illustrated by Figure 1. In this aggregation model, the consumption and generation resources are classified in several groups, where the output of the aggregation process will be the energy and cost of each group. As one can see in Figure 1 and also proposed in [15], the functionality of the aggregator is categorized in two sections of upper-level and bottom-level. In the upper level, the aggregator negotiates with players, such as market operator, BRP, and system operator; however, in the bottom level, it deals with demand-side users, namely small and medium scale consumers and producers.
The aggregator performs the scheduling process relying on external suppliers, Distributed Generation (DG) especially renewable resources, and DR programs. The customers who can execute DR programs would be able to establish contract with aggregator in three programs: load shifting, load reduction, and load curtailment. The load shifting model has been adapted from [16], and in this aggregation model it is considered as a free DR program. Load reduction and curtailment are the programs that aggregator takes them into account for scheduling and participating in the market. The aggregator considers a linear cost function for all external suppliers, DGs, load reduction and load curtailment. In this model, the aggregation process is done by K-Means Clustering algorithm by respect to the scheduled energy and its costs. In the aggregation process, only the resources that have been selected form the scheduling, are considered, and the rest that have no interaction in scheduling process, will not be considered. The aggregator categorizes the resources in several groups, and specifies a remuneration for each group, which called group tariff. This means the remuneration process should be calculated after the aggregation. The resources that are classified in a group, will be remunerated with same price. For this reason, the maximum price available in each group will be selected for group tariff. Therefore, the cheapest resource in the group will be motivated to participate in aggregation, since the group tariff is greater than the price initially defined, and also the most expensive resource will be satisfied, since the group tariff is as same as the price that it proposed.
In this way, the aggregator is able to participate in the market with a bid for each group. In each bid, the aggregator deliberates the gathered energy from the resources and also the group tariff as the minimum rate. The energy in each group is related to the aggregation of scheduled resources of that related group, therefore, the aggregator can easily manage its activities. On the other hand, the aggregator will be able to have negotiation in the market by biding the available energy of each group with a certain price, where this price should be greater or equal to the group tariff for the aggregator to gain profits or at least obtain the amount expended for the resources.
3. Optimization problem
The mathematical formulation regarding the presented aggregation model, especially resource scheduling, will be presented in this section. The optimization problem developed for the aggregator scheduling contains several continuous and discrete variables, therefore, the problem is considered as a mixed-integer linear problem (MILP). The objective function considered for the aggregation model is to minimize its Operational Cost (OC) and is shown by (1). It should be noted that in this model it is supposed the technical verification of the network is the obligation of the network operator, and the aggregator is not responsible for this matter.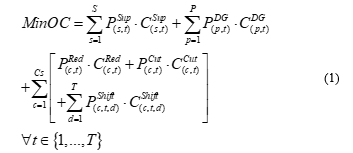
In this objective function, is purchased energy from external supplier, denotes the attained energy from DG, stands for DR load reduction, is for DR load curtailment, and represents DR load shifting.
There are several constraints that should be considered in the objective function. The first constraint stands for load balance, as (2) shows. In this equation, presents the required demand of consumers.
Also, the technical limitations of all resources available in the proposed methodology should be considered. Therefore, (3) represents the generation limitations of external supplier in term of minimum and maximum ( , ), and (4) considers DG limitations ( , ).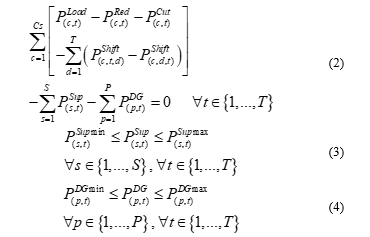
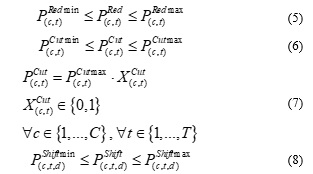
DR technical limitations, including load reduction, curtailment, shifting, are presented by (5)-(8).
 Although load shifting may not be pleasant for end-users, it is an appropriate and practical tool for aggregator. Load shifting process may limit consumers use of devices in a certain period, however, it enables the aggregator to manage the consumption based on the offered generation capacity. For this purpose, the limitations of maximum energy that will be shifted out from a period ( ), and enters to another period ( ) are proposed in (9) and (10).
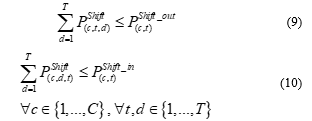 Moreover, (11) demonstrates the constraint regarding the groups tariff and their remuneration, which is the maximum price of group. The groups are separated based on the type of available resources (DG or DR).
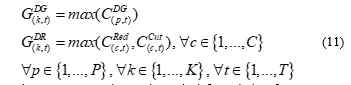
As a summary, the mathematical formulation for resources scheduling and their remuneration performed by the aggregator have been explained in this part. The methodology presented in this section will be employed in a case study in the next section.
4. Case Study
In order to examine the model represented in this paper, a case study is proposed. For this purpose, an low voltage distribution network of a university campus, in Porto, Portugal, is considered for the aggregator, which has been adapted from [17]. This distribution network is shown in the bottom of Figure 1 (Network region) and is considered as a part of main network. The network consists of underground electrical lines with 21 buses, where a MV/LV transformer in BUS #21, connects the campus network to the main network.
For this case study, we considered that there are 20 consumers, and 26 producers in the network. The consumers include 8 Residential (RE) buildings, 10 Commercial buildings in three scales of small (C-S), medium (C-M), and large (C-L), and 2 Industrial (IN) units, which are classified based on average daily consumption. Moreover, producers consist of renewable resources including 20 Photovoltaic (PV) units and 4 wind generators, 1 biomass, and external suppliers. The generation and consumption profiles of whole network considered for day-ahead scheduling in a winter day are shown on Figure 2.
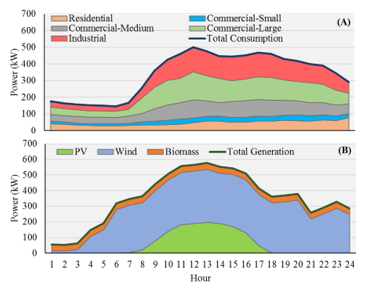 Figure 2. Day-ahead profiles of the network considered for case study: (A) Consumption, (B) Production.
As it can be seen in Figure 2 – (A), large commercial buildings and industrial units have occupied a huge part of consumption, and peak periods start from period #10 to #23. In this case study, it is presumed that the biomass production, and external suppliers have maximum capacity of 40 and 500 kW respectively. The external suppliers profile is not illustrated in Figure 2 – (B), since it is out of scope of figure and is a constant value during all periods. Moreover, it is considered that all producers would be able to contribute in the aggregation process, except external suppliers. Additionally, as you can see in Figure 2 – (B), since a winter day selected for the case study, PV producers have no significant generation, therefore, the aggregator should rely on wind, biomass, external suppliers and DR programs to prevent purchasing energy from the market. However, by comparing both parts of Figure 2, it is obvious that there are some periods that aggregator has more generation than consumption, therefore, it would be able to sell energy to the market and gain profits.
Regarding DR programs, Figure 3 demonstrates linear costs considered for each consumer based on its type. These costs are for load reduction and load curtailment, where 20% of the initial consumption is considered as maximum load reduction, and 15% for maximum load curtailment.
Furthermore, the linear costs considered for energy resources are shown on Figure 4. Each point in Figure 4 is the individual cost of each resource, where resource #1 to #20 are all PV, #21 to #24 are wind generators, #25 is biomass unit, and #26 illustrates external suppliers. It is should be mentioned that the costs demonstrated in Figure 4, are constant in all periods.
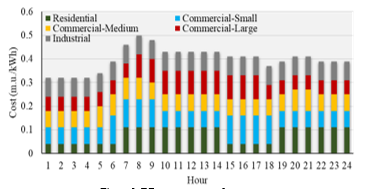 Figure 3. DR program costs for consumers.
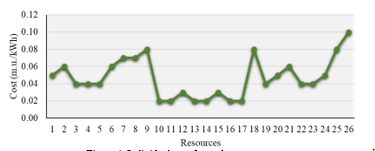 Figure 4. Individual cost for each energy resource.
Additionally, Figure 5 represents the day-ahead market prices considered for the aggregator in order to participate in market negotiations.
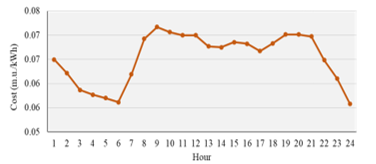 Figure 5. MIBEL market price for Portugues section in a winter day.
These prices are for a winter day in 2017 and have been adapted from Portuguese sector of Iberian Electricity Markets (MIBEL) [18]. In order to model the participation of the aggregator in the electricity markets, a market place should be taken into account, to guaranty its contribution in the competition. For this purpose, a market pool is an appropriate solution to ensure that third parties, such as aggregator, would be able to present energy bids.
5. Results
This section concerns the aggregation and scheduling results of the case study presented in the previous section. The optimization problem of aggregation and scheduling presented in this paper, has been solved through TOMLAB [19]. Additionally, the market negotiation results are represented, which shows how the aggregator utilizes these results for providing a bid. In the case study, we considered that the aggregator meets a drop from external suppliers in first four periods that can supply only 10% of their capacity. The reason of this lack of energy is considered as a fault or any other causes in the external suppliers. Figure 6 shows the network consumption before and after the scheduling of aggregator.
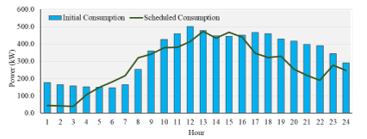 Figure 6. Total consumption of the network.
The scheduling results shown in Figure 6 are based on DG and available energy during each period. Additionally, there are several periods that scheduled consumption profile are greater or smaller than the initial profile. This is due to the utilization of DR programs by aggregator. With this in mind, Figure 7 illustrates more information regarding the generation and DR scheduling.
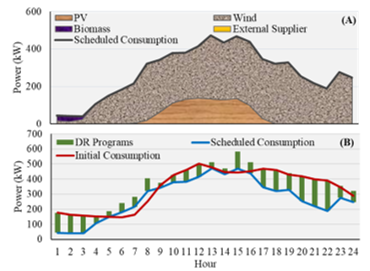 Figure 7. Detailed scheduling results of aggregator: (A) Generation scheduling, (B) DR scheduling.
As one can see in Figure 7 – (A), since the DG suppliers are considered as cheapest resources comparing with external suppliers, the aggregator utilizes the available DG energy, especially PV and wind, to supply the demand, and in the first four periods, it employs biomass generation to supply the loads. In other words, the aggregator reduced the consumption to the available DG energy in order to prevent purchasing energy from market for minimizing the costs. This means, in the periods that the DG generation is not adequate for the demand, aggregator applies DR programs to regulate the difference between the consumption and generation, as illustrated in Figure 7 – (B). The DR programs that aggregator employed to balance the network for each single period, are shown on Figure 8. The utilized DR programs include load reduction, load curtailment, and load shifting.
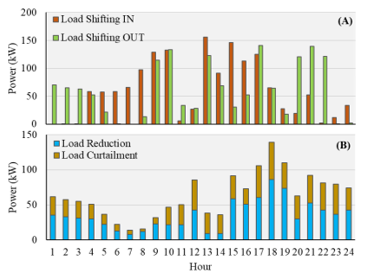 Figure 8. DR programs used by aggregator for network balancing: (A) Load shifting, (B) Load reduction and curtailment.
The incoming and outcoming consumption of each period during load shifting are shown on Figure 8 – (A), which occurred during low generation periods, and shifted to high generation periods. The load shifting enables the aggregator to manage the consumption and shift it to desired periods to prevent purchasing energy from the market, since it is more expensive comparing with DG resources.
Additionally, Table 1 shows the results of aggregation and remuneration processes for period number 12.
Table 1. Remuneration and aggregation results for a single period.
| Group | 1 | 2 | 3 | 4 | 5 | |
| DG | PV (kW) | 0 | 36.23 | 19.64 | 37.54 | 43.86 |
| Wind (kW) | 250.58 | 0 | 0 | 0 | 26.88 | |
| Biomass (kW) | 0 | 0 | 0 | 0 | 0 | |
| tariff (m.u./kWh) | 0.05 | 0.02 | 0.05 | 0.06 | 0.06 | |
| DR | Residential (kW) | 0 | 0 | 0 | 0 | 0 |
| Commercial Small (kW) | 0 | 0 | 0 | 0 | 10.09 | |
| Commercial Medium (kW) | 0 | 0 | 11.07 | 20.05 | 7.11 | |
| Commercial Large (kW) | 0 | 0 | 0 | 0 | 0 | |
| Industrial (kW) | 26.21 | 10.94 | 0 | 0 | 0 | |
| tariff (m.u./kWh) | 0.06 | 0.06 | 0.05 | 0.05 | 0.05 | |
| Total (kW) | 500.18 | |||||
In Table 1, the total energy as well as the number of resources in each group have been calculated by aggregation computation, however, the group tariff has been indicated by remuneration calculation. Moreover, in order to calculate the profit of the aggregator after paying all resources, including DG and incentives for DR participation, (12) is proposed. This profit is the monetary benefit that aggregator gained after its operations.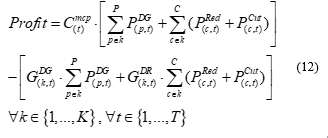
In (12), the denotes market clearing price, which is considered in this case study is equal to the market prices provided in Figure 5. The classification of the resources in the several groups enables the aggregator to provide lower group tariffs, comparing with the situation that all resources are in the same group. It is true that with classification of resources in several groups, high group tariff will be still remained, however, the chance of aggregator to reach some group tariff with lower rates will be increased. The financial profit gained by aggregator during period number 12, is shown on Table 2. In this single period, the aggregator has total energy of 500.18 kW, which has incoming of 35 monetary unit from the energy that sold to the market. However, it also paid 22.84 monetary unit for all resources, including DG units and DR incentives, and in total, 12.17 monetary unit will be the final profit of aggregator during period number 12.
Table 2. Gained profit by aggregator during market negotiations for one period.
| Parameter | Value |
| Costs paid to all resources (m.u.) | 22.84 |
| Market clearing price (m.u./kWh) | 0,0700 |
| Income from market sell (m.u.) | 35.00 |
| Total aggregator profit (m.u.) | 12.17 |
The profit of aggregator shown on Table 2, is for a single period (considered as one hour in a day in this case study), and even with a few number of consumers and generators, it could gain profit from market negotiations. This means that if the aggregator is responsible for a larger network He will be able to aggregate more energy capacity for clustering, and therefore, with great participation in market, which leads to obtain a satisfying amount of financial benefits. However, this profitability depends on the capabilities and offers of aggregator in market negotiations and existing competitions. Figure 9 demonstrates the financial results concerning the participation of aggregator in the electricity market for all periods of case study. These results are obtained after the scheduling and remuneration processes. It should be noted that only the resources that participated in these processes, are considered. The costs of each period in Figure 9 follows the same process represented in Table 2, which the gained profit is a subtract of costs paid to all resources and the income from market participation.
The last results of this section are related to a comparison that shows the impact of load shifting method for aggregator. For this purpose, it is considered that the aggregator is not capable to employ load shifting during scheduling process. The scheduling results, without load shifting, are illustrated in Figure 10. The results shown in Figure 10 (without load shifting) can be compared with the scheduling results demonstrated in Figure 7 (with load shifting).
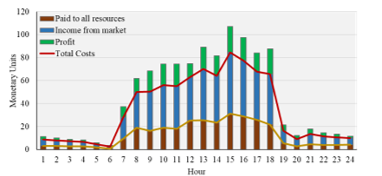 Figure 9. Detailed aggregator costs after scheduling and remuneration process for all periods.
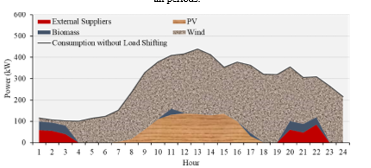 Figure 10. DG scheduling results without load shifting.
As one can see in Figure 10, in some periods the aggregator not only utilizes all available DG resources to supply the demand, but also, it is forced to use energy from external suppliers to feed all demand. By this way, since the electricity price of external suppliers are more expensive than the DG resources, the total costs of aggregator will be increased, and therefore, the gained profit will be decreased. However, as Figure 7 demonstrated, if the aggregator utilized load shifting scenario, and shift the load from the moments that there is no adequate DG energy, to the periods with high DG energy, its operational costs will be reduced, and obtained financial benefits will be increased.
6. Conclusions
This paper presented an aggregator model for distributed energy resource and demand response program management. The presented model considered the resources able to participate in electricity market negotiations through the aggregator. The aggregator has capability of demand-side flexibility by establishing several demand response contracts with consumers.
The main focus of the paper was given to a business model that aggregator utilized it to gather energy of resources and their costs, to define a fair remuneration tariff for all resources, as well as an affordable price for market participation. By this way, the aggregator guarantees that the small-scale resources, including distributed generation and demand response programs, will participate in the electricity market, and therefore, getting profits.
The results of case study demonstrate that the aggregator model is able to perform an optimal scheduling for distributed resources, in order to minimize the operational costs of the aggregator. This is done through implementing several DR programs. The final outcomes of aggregation and remuneration processes validated the proposed method, and proved that the aggregator can gain financial benefits from market negotiations, even by paying a fair tariff to all available resources.
Conflict of Interest
The authors declare no conflict of interest.
Acknowledgment
This work has received funding from the European Union’s Horizon 2020 research and innovation program under the Marie Sklodowska-Curie grant agreement No 641794 (project DREAM-GO). This work also received funding from the following projects: NETEFFICITY Project (ANI | P2020 – 18015); and from FEDER Funds through COMPETE program and from National Funds through FCT under the project UID/EEA/00760/2013.
- Spinola, P. Faria, Z. Vale, “Model for the integration of distributed energy resources in energy markets by an aggregator”, in 2017 IEEE Manchester PowerTech, Manchester UK, 2017. https://doi.org/10.1109/PTC.2017.7981234
- M. Nosratabadi, R.-A. Hooshmand, E. Gholipour, “A comprehensive review on microgrid and virtual power plant concepts employed for distributed energy resources scheduling in power systems,” Renew. Sustain. Energy Rev., 67, 341–363, 2017. https://doi.org/10.1016/j.rser.2016.09.025
- Battistelli, A. J. Conejo, “Optimal management of the automatic generation control service in smart user grids including electric vehicles and distributed resources,” Electr. Power Syst. Res., 111, 22–31, 2014. https://doi.org/10.1016/j.epsr.2014.01.008
- Roos, S. Ø. Ottesen, T. F. Bolkesjø, “Modeling Consumer Flexibility of an Aggregator Participating in the Wholesale Power Market and the Regulation Capacity Market,” Energy Procedia, 58, 79–86, 2014. https://doi.org/10.1016/j.egypro.2014.10.412
- Abrishambaf, P. Faria, L. Gomes, J. Spínola, Z. Vale J. Corchado, “Implementation of a Real-Time Microgrid Simulation Platform Based on Centralized and Distributed Management”, Energies, 10(6), 806-820, 2017. http://dx.doi.org/10.3390/en10060806
- J. Vergados, I. Mamounakis, P. Makris, E. Varvarigos, “Prosumer clustering into virtual microgrids for cost reduction in renewable energy trading markets,” Sustain. Energy, Grids Networks, 7, 90–103, 2016. https://doi.org/10.1016/j.segan.2016.06.002
- Rahnama, S. E. Shafiei, J. Stoustrup, H. Rasmussen, J. Bendtsen, “Evaluation of Aggregators for Integration of Large-scale Consumers in Smart Grid,” IFAC Proc. Vol., 47(3), 1879–1885, 2014. https://doi.org/10.3182/20140824-6-ZA-1003.00601
- EG3 Report – Smart Grid Task Force, “Regulatory Recommendations for the Deployment of Flexibility,” 2015.
- Smart Energy Demand Coalition, “Mapping Demand Response in Europe Today 2015,” 2015.
- Smart Energy Demand Coalition, “Enabling independent aggregation in the European electricity markets,” 2015.
- Federal Energy Regulatory Commission, “Assessment of Demand Response & Advanced Metering,” 2011.
- Smart Grid Task Force, “Regulatory Recommendations for the Deployment of Flexibility,” 2015.
- Rahmani-Dabbagh, M. K. Sheikh-El-Eslami, “A profit sharing scheme for distributed energy resources integrated into a virtual power plant,” Appl. Energy, 184, 313–328, 2016. https://doi.org/10.1016/j.apenergy.2016.10.022
- Faria, J. Spínola, Z. Vale, “Aggregation and Remuneration of Electricity Consumers and Producers for the Definition of Demand-Response Programs,” IEEE Trans. on Industrial Informatics, 12(3), 952–961, 2016. https://doi.org/10.1109/TII.2016.2541542
- Mahmoudi, E. Heydarian-Forushani, M. Shafie-khah, T. K. Saha, M. E. H. Golshan, P. Siano, “A bottom-up approach for demand response aggregators’ participation in electricity markets,” Electr. Power Syst. Res., 143, 121–129, 2017. https://doi.org/10.1016/j.epsr.2016.08.038
- Faria, Z. Vale, J. Baptista, “Constrained consumption shifting management in the distributed energy resources scheduling considering demand response,” Energy Convers. Manag., 93, 309–320, 2015. https://doi.org/10.1016/j.enconman.2015.01.028
- Silva, F. Fernandes, H. Morais, S. Ramos, Z. Vale, “Hour-ahead energy resource management in university campus microgrid,” 2015 IEEE Eindhoven PowerTech, Eindhoven Netherlands, 2015. https://doi.org/10.1109/PTC.2015.7232449.
- MIBEL Electricity Market. Available online: http://www.omip.pt (accessed on 30 Nov. 2017)
- TOMLAB Optimization. Available online: https://tomopt.com/tomlab/ (accessed on 30 Nov. 2017)