A decision-making-approach for the purchasing organizational structure in Moroccan health care system

Adv. Sci. Technol. Eng. Syst. J. 3(2), 195–205 (2018);
 DOI: 10.25046/aj030223
Excellence in hospitals supply management results in better quality, best prices, and good deliveries. One of the questions that come up as healthcare organization to capture the economies of scale in purchasing prices and process costs is whether their purchasing activities should be centralized or decentralized. In most cases, centralization strategy usually gives good supplier’s service with a lower cost, but the consideration of supplier’s cost in the hospital sector are mainly limited to visible ones. The high levels of hidden quality costs generated by suppliers and their unknown presence have serious consequences on the decisions made by the managers. However, the existence of this kind of costs has not been considered yet. Therefore, the main objective of this paper is to propose a decision-making-approach, integrating a new method of measuring supplier’s hidden quality costs, in order to help managers to choose the appropriate purchasing organizational structure in the hospital sector.
1. Introduction
In Morocco, the ministry of health has undertaken several actions to make medicines and medical devices available and accessible to the population. It has a national list of medicines and essential medical devices, according to the last revision which was carried out at the end of 2011. The pharmaceutical products covered by this list benefit from an annual budget allocated by the ministry of health, to ensure their availability at the level of public hospitals and basic health care facilities. This budget increased by 67% between 2002 and 2012, reaching the sum of 1.6 billion Dirham [1-3]. Despite efforts made by the ministry, the access to medicines and medical devices in hospitals remains insufficient [2] [4]. The main factor that reduces the availability of medicines is a failure to achieve a good supplier’s quality. Experiences have shown that it is possible to improve access to these products by making the best use of resources and streamlining management processes. Indeed, it is necessary to highlight the organizational purchasing structure, and improve the supplier’s quality [5-7]. In this perspective, it is mandatory to study the relationship that exists between non-quality, costs and organizational structure. In fact, a change in an organizational structure impacts the entire system including customers, suppliers, and competitors. In the healthcare system, the suppliers are considered as the main stakeholders contributing to the improvement of the hospital’s performance. The demand continues to support the growing supplies, which has changed the behavior of organizations to achieve good quality. This change includes both simple corrections and more complex changes for suppliers, at the level of their attitudes and their performances. The particularity of healthcare facilities is that the patient receives its service in real time. Though, the impact of the structure on the supplier’s performance affects the quality of care and purchaser’s satisfaction, this dissatisfaction could be estimated by a cost, which is considered as a hidden cost. Theses hidden quality costs may increase or decrease depending on the choice of the organizational structure.
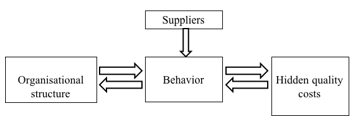 Figure 1. Relationship that exists between organizational structure and hidden costs
In light of the importance of hospital logistics, we propose in this paper to consider the supplier’s hidden quality costs as one of the
principle criteria to be based on for deciding the right purchasing strategy. This paper is an extension of a work originally presented in Logistiqua’17 conference [1]. It’s organized as follows: Section II presents some definitions of the hospital sector, followed by section III that describes the problematic, and section IV that provides a literature review. In section V a deciding-making-approach is proposed and validated through a practical case study in section VI. Finally, section VII concludes the paper and states future work.
2. Hospital pharmacy presentation
This section provides important definitions that describe hospital pharmacy services, as well as the requirements for providing pharmaceutical care.
2.1. The hospital, hospital pharmacy and SEGMA hospital definition
The hospital is a healthcare unit composed of specialized scientific equipment, and certified healthcare professionals, working as a team for the common purpose of providing medical services to the population. While the hospital pharmacy defined as a department in a hospital, which is responsible for the supply of medical products, and headed by professionally competent and qualified pharmacist who directly supervises and ensures compounding and distribution of medication to in and out patients [8].
The status SEGMA stands for “State service managed in an autonomous way” and is defined as the services of the state whose expenses operations are executed by a head of the department attached to the superior accountant of the kingdom. In 2004, there was 38.4% of the total number of services dedicated to hospital care with SEGMA status. Currently 63% of the number of hospitals obtains the SEGMA status [9].
2.2. Goals of hospital pharmacy
The hospital pharmacy aims to provide safe and effective pharmaceutical care and services to users and health care facilities, through a global professional and ethical standards. Pharmaceutical services components are responsible for three main missions. Firstly, it’s responsible for the procurement, distribution and control of pharmaceutical products, secondly, the evaluation and dissemination of comprehensive information about medical products and their use to the institution’s employees and patients. And finally, it’s responsible for the supplier’s monitoring, evaluation, and assurance of the quality of drugs [8].
2.3. Hospital’s pharmacy in Centralized and decentralized structure
Figure 2 shows the logistics flows for centralized and decentralized structure. The centralized structure aims to make orders for many hospitals independently when there is no grouping of commons orders. While decentralized structure is considered to refer to a practice model in which a pharmacist is responsible for orders purchasing and distribution services, including order validation and possibly order entry [5][8].
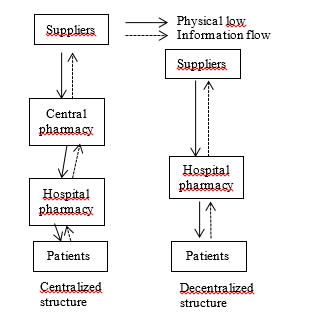 Figure 2. The information and physical flow in both structures
3. Problematic description
In 24 years, the Moroccan health care system switched many times between centralized and decentralized structure [9]. (See table 1)
In face of all these changes and developments of the organizational structure, Moroccan hospitals still suffer from inadequate quality, the insufficient availability of products and the increased costs [3].In decentralization structure, centers of storage and distribution cost up to one billion Dirhams per year, and operated by 200-250 people [1-4].Also, storage and distribution of medicines in Morocco cost the ministry of health over 30 million Dirhams per year. While in centralization structure, the rate of obsolescence of medicines decreased by 8% at the end of 2002, and the purchase prices of medicines through the centralized system in 2001 were lower than the prices paid in the decentralized system. This drop in prices allowed buying 50% more products. All these data show the supplier’s bad quality and the inappropriate choice of the organizational structure, which indicates the importance of estimating poor quality costs generated by suppliers, also called hidden costs. Therefore, in this paper we propose a decision-making-approach, integrating a new method of measuring supplier’s hidden quality costs, in order to help the managers to choose the appropriate purchasing organizational structure in the hospital sector.
4. Literature review
To discuss the literature related to this subject, this review will cover three principle topics, and we will start by a brief review of each of them:
4.1. Organizational structure
Decision-making can be performed in a centralized or a decentralized structure. In a centralized one, there exists a central responsibility for decision-making, whereas in a decentralized structure the individual entities can make their own decisions. In practice, each approach has its advantages and disadvantages. Most commonly, the strategic decisions are usually made centrally while operation decisions are decentralized. The performance of each approach depends on specific environment and particular decisions [9] [10]. Many researchers studied the effects of centralization and decentralization on the multi-item replenishment problem in a two-echelon supply chain. Chen et al. proposed both centralized and decentralized decision models and proved the optimal properties of both models to minimize costs [11] [12]. They found that it is beneficial to adopt centralized control and proposed a mechanism to coordinate the decentralized system so that each player in the chain benefit from it. Behdani et al. studied disruptions in a multi-plant company and considered alternative policies for coping with them. To model this complex system, they used an agent-based simulation model [13].
Table1. A brief history of the health care supply system
| 1980 | Decentralization | With many difficulties faced by the central pharmacy, there has been an introduction of direct delivery system |
|
1985-1986 |
Centralization |
Worsening problems due to the small size of premises and storage spaces, implies return to centralization. There was also a need of the implementation of a new unit, and the improvement of the central pharmacy program, followed by a progressive implementation of semi-autonomous management for the regional hospitals which directly procure themselves. |
| 1994 | Decentralization | Establishment of the procurement division, reporting directly to the general secretariat of the ministry. |
| 1995 | Centralization | Commissioning of the storage unit to centralize procurement for medicines. |
| 1997 | Decentralization | Decentralization purchasing for SEGMA hospitals |
| 2001 | Centralization | Centralized purchasing (procurement, storage, distribution) for SEGMA regional hospitals by the procurement division. |
| 2003 | Decentralization | In view of difficulties of regular supply, it is envisaged to decentralize the supply of SEGMA hospitals. |
However, no one has considered the hidden costs generated in each strategy. In our study, we will focus on this objective in a particular way.
Hidden quality cost:
In traditional systems, quality losses occur when the product deviates beyond the specification limits, and becomes unacceptable [14]. Taguchi proposed a narrower view of characteristic acceptability to indicate that any deviation from a characteristic’s target value results in a loss, and that a higher quality measurement results in minimal variation from the target value [21-22]. Other authors analyze different aspects related to hidden quality cost in the construction business, and highlight the following examples of hidden quality costs: schedule delays, litigation and claims, loss of reputation and the subsequent impact on future business opportunities, loss of schedule and productivity, low operational efficiency, work inactivity from waiting or idle time, etc. [15-19]. Taguchi loss functions have been recently used for non-manufacturing applications. They were implemented to evaluate product quality as an aid to the selection of suppliers, been based on quantitative quality characteristics. These products are used for evaluation, comparison, and ranking process. There are several methods for the estimation of hidden costs [23-25]. However, none of them considers the quantification of hidden costs associated to qualitative criteria that presents subjectivity and uncertainty. The question which arises while measuring the cost associated to qualitative criteria is how to determine the target value, and the particular value specification that characterize the performance of each element.
4.2. Multi attributes decision making technique
There are many techniques developed for the supplier evaluation problem. Some of these techniques are categorical method, weighted point method [26], matrix approach [27], vendor performance matrix approach [28], vendor profile analysis (VPA) [29], analytic hierarchy process (AHP) [30-31], analytic network process (ANP) [32], mathematical programming [33-34] and multiple objective programming (MOP) [35-37]. However, most of these methods are more adapted to precise data. They don’t have enough influence on factors such as imprecision preferences, qualitative criteria and incomplete information. The Technique for Order of Preference by Similarity to Ideal Solution (TOPSIS) is a multi-criteria decision analysis method based on the concept that the chosen alternative should have the shortest geometric distance from the positive ideal solution, and the longest geometric distance from the negative ideal solution [7]. Therefore, TOSPIS method is more appropriate to overcome problems in estimating hidden costs associated to qualitative characteristics. To sum up, the main contribution of this paper is the development of a method for the quantification of hidden quality costs based on Taguchi loss function and TOPSIS method, included in a decision-making-approach. We also compare the behavior of medicines suppliers under the centralized and decentralized strategies based on hidden quality costs. The suitability of the two strategies under two different scenarios is explored through a real case study in a Moroccan hospital.
5. The proposed deciding-making-approach
Based on the review of previous works and field interview with suppliers in Morocco, the organizational structure applied to purchase medical products for hospitals, helps to evolve the supplier’s chain performance to flourish and vice versa. As indicated in figure 3, the organizational structure in the healthcare supply system is a critical component for any supplier’s system improvement, and the decision to centralize or decentralize purchasing should be based on studies that focus on the actual supplier’s hidden quality costs for each structure.
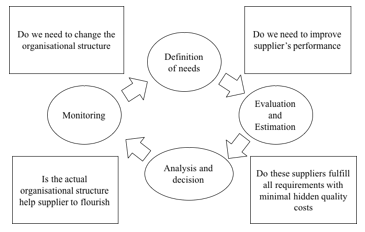 Figure 3. Deciding-making-approach lifecycle
5.1. Definition of needs
As indicated in the figure, targets of change include improving effectiveness at two principle levels: Supplier’s performance and organizational structure. There is a strong relationship between these two elements that helps ensure solid communication. Therefore, in this phase, we should:
- Define the needs regarding supplier’s specifications, functional and technical requirements.
- Recognize the problems inherent in managing the actual organizational structure and obstacles that overcome.
- Discover whether the actual resources and capabilities help increase hospital’s ability to create value.
5.2. Evaluation and estimation of supplier’s hidden quality costs
In this phase, the full capabilities of suppliers are being gauged against defined requirements. We believe that the supplier’s quality loss occurs when his performance deviates from a target, the higher the deviation is, the worst the service is rendered, and the higher the purchaser is dissatisfied. This dissatisfaction could be estimated by a cost. According to Taguchi, as indicated in figure 4, the variation of this cost is represented by a quadratic curve. The curve is centered on the target value, which represents the best performance, and determining this best value is not usually a simple task.
Three types of loss functions have been presented in the Taguchi loss function [19], nominal the better (NTB), larger the better (LTB); and smaller the better (STB). Firstly, It is necessary to determine the criteria to be based on to estimate the supplier’s hidden cost, the target value, then the upper and lower specification limits.
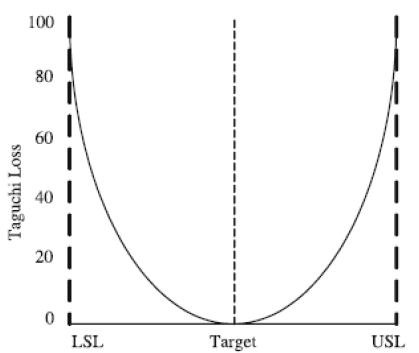 Figure 4. Two-sided loss function with specification preference
5.2.1. Supplier’s hidden costs for quantitative quality characteristic
In this work, we adopt the form NTB for the quantitative quality characteristics which means that the nominal value is the best value. The loss function is given by Eq. 1.
![]() Where k is the loss coefficient, whose value is constant depending on the cost at the specification limits and the width of the specification, is a particular value specification, that presents the value of the product characteristic, and L( ) is the loss associated to [19].
Where k is the loss coefficient, whose value is constant depending on the cost at the specification limits and the width of the specification, is a particular value specification, that presents the value of the product characteristic, and L( ) is the loss associated to [19].
5.2.2. Supplier’s hidden costs for qualitative quality characteristic
For qualitative criteria, we use a one-sided minimum (smaller-is-better) loss function of the form:
![]() where the meanings of L( ), and k are the same as in equation 1. As indicated in figure 5, our philosophy aims to consider that the target value is presented as the best supplier’s profile, which is characterized by the highest performance level at all quality attributes, and where the loss is equal to zero. Any supplier’s distance from the ideal profile generates a cost; the smaller the distance, the lower the hidden cost is. This cost is estimated using TOPSIS method. This method measures this distance based on the supplier’s performance level. It hypothesizes two artificial alternatives: The Ideal alternative that has the best level for all attributes considered, and the negative ideal alternative that has the worst attribute values [28]. TOPSIS allows determining the alternative that is the closest to the ideal solution and farthest from negative ideal alternative.
where the meanings of L( ), and k are the same as in equation 1. As indicated in figure 5, our philosophy aims to consider that the target value is presented as the best supplier’s profile, which is characterized by the highest performance level at all quality attributes, and where the loss is equal to zero. Any supplier’s distance from the ideal profile generates a cost; the smaller the distance, the lower the hidden cost is. This cost is estimated using TOPSIS method. This method measures this distance based on the supplier’s performance level. It hypothesizes two artificial alternatives: The Ideal alternative that has the best level for all attributes considered, and the negative ideal alternative that has the worst attribute values [28]. TOPSIS allows determining the alternative that is the closest to the ideal solution and farthest from negative ideal alternative.
Let assumes that we have m alternatives, and n criteria. We have the score of each option with respect to each criterion. The supplier’s distance from the ideal profile is calculated according to the following steps:
Let xij be the score of option i with respect to criterion j. We have a matrix X = (xij) with dimension m´n. Let J be the set of benefit attributes or criteria (LTB), and let J’ be the set of negative attributes or criteria (SMB).
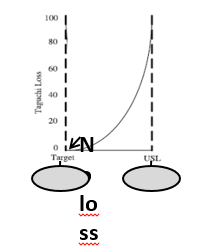 Figure 5. Loss function in case of qualitative criterion
Step 1: We construct normalized decision matrix
This step transforms various attribute dimensions into non-dimensional attributes, which allows comparisons across criteria. Scores or data are normalized as follows:
![]() Step 2: We construct the weighted normalized decision matrix.
Step 2: We construct the weighted normalized decision matrix.
In this step, we assume that we have a set of weights for each criteria wj for j = 1,…,n. We multiply each column of the normalized decision matrix by its associated weight. An element of the new matrix is:
![]() Step 3: We determine the ideal and negative ideal solutions.
Step 3: We determine the ideal and negative ideal solutions.
Ideal solution:
![]() Where vj*={ max (vij) if j ÎJ ; min (vij) if j ÎJ’ }
Where vj*={ max (vij) if j ÎJ ; min (vij) if j ÎJ’ }
Negative ideal solution:
![]() Where v’ = { min (vij) if j ÎJ ; max (vij) if j ÎJ’ }
Where v’ = { min (vij) if j ÎJ ; max (vij) if j ÎJ’ }
Step 4: We calculate the separation measures for each alternative.
The separation from the ideal alternative is:
![]() Similarly, the separation from the negative ideal alternative is:
Similarly, the separation from the negative ideal alternative is:
![]() Step 5: We calculate the relative closeness to ideal solution *
Step 5: We calculate the relative closeness to ideal solution *
![]() The supplier’s distance from the ideal profile determines ??, which allows calculating the loss occurred by equation (2).
The supplier’s distance from the ideal profile determines ??, which allows calculating the loss occurred by equation (2).
5.3. Analysis and decision
There are significant costs associated with organizational structure management and supplier’s performance. The choice of centralization or decentralization structure may reduce supplier’s flexibility and therefore makes it difficult to be responsive to changing purchasing management. Furthermore, the structure chosen changes the distance and the number of touch points between hospitals entry and suppliers. Poor planning and oversight in such a highly complex demand leads to unnecessary expenses. For example, when many “hands” are involved, the right products in the right mix and volumes may not be in the right places at the right time. Therefore, this method allows us to evaluate our satisfaction with supplier’s quality in the current structure, and to be taken into account before taking any decision of change.
5.4. Supplier’s Monitoring
The movement of the healthcare system organization from one form to another often requires change within the organization itself. Therefore, the organization shall operate procedures for approval and continued monitoring of all its suppliers whose products or services may affect product safety. Monitoring a supplier’s performance will provide an indication of changes within the suppliers’ systems and procedures that could lead to potential issues. The results of evaluations and follow-up actions shall be recorded, for future decisions.
6. Practical case study: Military hospital of Rabat
We choose in this study the Mohamed V Military Hospital of Rabat/Morocco. This hospital carries the SEGMA status, and has been subject to the change of the structure from centralization to decentralization many times from the year 2000. The objective of this study is to report the experience of this hospital in the involvement of different types of structure in the management of medical products, materials and methods from 2001 to 2003. Taking into account the total number of suppliers who participated during this period, as shown in figure 6, we find that 47% of these suppliers participated during the decentralization period, 36% of them participated during centralization, and only 17% participated in both strategies. Our study will be focused on the estimation of hidden quality costs of suppliers, who have been involved in the purchase of medical products, in both strategies: centralization in 2001, and decentralization in 2003, in order to study the impact of organizational structure on supplier’s behavior.
6.1. Definition of needs
As a result of the team efforts, and as recent data are confidential, we accessed to the suppliers’ evaluation data in 2001 (centralization), and those in 2003 (decentralization). We highlight that old data will not have a significant impact on our approach. In 2001, the hospital suffered from the unavailability of medical products, and the poor quality delivered by the suppliers, which was evaluated on several bases (see figure 7). The question which arises when changing the organizational structure from centralization to decentralization is whether this change will help suppliers to improve their performance or to get it worse. Therefore, in this section we will estimate the hidden quality cost behind the non-quality provided by suppliers in both strategies.
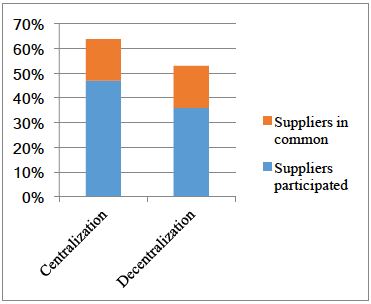 Figure 6. Suppliers participated in the period 2001-2003
6.2. Evaluation and estimation
6.2.1. Principle criteria for supplier’s hidden quality costs
For the purpose of estimating supplier’s hidden quality costs in the case of this hospital, we select three principle criteria: the delivery, the validity period as a single quantitative criterion, and quality as a multiple qualitative criterion, which is subdivided into five sub attributes. The objective is to estimate the supplier’s
hidden quality costs in seven cases as presented in the table 2.
6.2.2. Estimation of supplier’s hidden quality costs
To apply the existing Taguchi loss function for quantitative quality characteristic, and the developed method for qualitative quality characteristic, we develop a purchasing model, in which we assume that the purchaser only knows the prices that might have different impacts on product quality and delivery. We estimate the loss associated to 7 suppliers according to these seven criteria.
– Quantitative quality characteristic
To calculate the loss associated to the quantitative criteria, we first need to specify the upper specification limit and lower specification limit for each criterion. For the case of this hospital, they are determined as follow:
- The maximum acceptable delivery and the minimum acceptable delivery are 7 days.
- The minimum period of validity is 18 months.
The average price of the market is 80.
As shown in table 3, we assume that the effect of price on delivery and validity period follows an exponential function, where delta price term shows the difference between the supplier price and the minimum price showed in the market. Then the estimation of the loss occurred in both structures, is determined in table 4 and 5.
– Qualitative quality characteristic
To estimate the loss associated to the quality criterion for each supplier, we suppose that: The maximum deviation from the ideal profile is 40%
- For the purchaser’s orientation, the weight for each sub-criterion in the quality criterion is 0.2
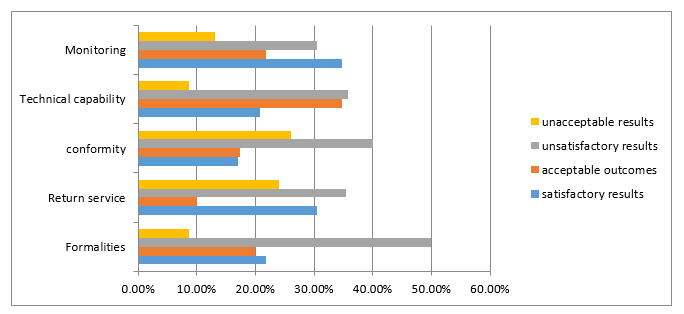 Figure 7. Supplier’s evaluation criteria
Table 2. Criteria for supplier’s hidden quality costs and their determination
| Quantitative quality characteristic | 1. Delivery | Costs to catch up the purchase unavailability as consequence of the supplier’s delay or to pay extra fees to store the command for later use as a result of an order delivered in advance. | |
| 2. Period of validity | Costs generated by expired medications due to suppliers that do not respect the validity period. | ||
| Qualitative quality characteristic | 3.Quality | 3.1. Monitoring | Costs to unlock the logistics problem in the hospital’s upstream supply chain, generated by supplier’s bad manufacturing practices, which include criteria for personnel, facilities, equipment, materials, manufacturing operations, labeling, packaging, quality control and, stability testing. These costs imply a supplier’s bad conformity. |
| 3.2. Technical capability | Costs to maximize the return potential of the hospital’s pharmacy generated by suppliers who have a bad experience in pharmaceutical returns service, and also to generate the minimum return credit for the hospital’s outdated pharmaceuticals. | ||
| 3.3. Conformity | Costs to avoid unavailability of medicines in the pharmacy, and to monitor and check the supplier ongoing process of reviewing the degree to which programmed activities are completed and objectives are being met. | ||
| 3.4. Return service | Costs related to small errors of medications structure which can cause patients death. Hospital pharmacy policy requires providers to establish a continuous, systematic, and criteria-based evaluation system, such as the form and dose of drug use, that will help ensure the appropriate use of drugs. | ||
| 3.5.Formalities | Costs to assure continuity of hospital’s supply and reliability of medicines quality, due to a supplier’s bad technical capability. Hospital’s pharmacy analysis confirms the reasonableness of the type and amount of resources proposed by the supplier. This analysis covers the proposed types and quantities of materials, labor, processes, special tooling, facilities, the reasonableness of scrap and spoilage, and other factors set forth in the supplier’s proposal. | ||
Table 3. Functions used to describe the effects of price on delivery and loss coefficients values.
| Delivery in advance | Late delivery | Period of validity in advance | |
| Impact of price |
High |
Medium |
Medium |
| Price function | |||
| K | 333.3 | 222.22 | 111.1 |
First, we have to determine for each supplier the independent variable yi in equation 2. For this purpose, we rate each attribute of each alternative in the form of a matrix. To study the impact of these matrices values on final results, we assume that we have 2 experts; each one of them is assigned with the task of evaluating each supplier against each sub-criterion in each strategy. Then we determine the ideal solution, the ideal negative solution, and consequently the relative closeness to the ideal solution according to each expert (See table 6).
To get the values of k, we first need to specify the upper specification limit for each measure. As mentioned earlier, a loss of 100% will take place if a supplier image is 40% far away from the ideal profile. The other numerical measure that we need to model is how price affect quality characteristics. The expert might have different priorities regarding these criteria. For instance, one expert might be interested in high quality, while another in on-time delivery. For this reason, we assume that price effect is considered as medium or high in both centralized and decentralized structure. We use an exponential function to model the price effect for all experts. Substituting these values in equation 2, we obtain the following loss coefficient values k, as shown in Table 7.
Table 4. Loss function results for delivery criterion
| Suppliers | y (days) | Loss L(y) | |
| Centralization | S2 | -8 | 21331.2 |
| S4 | -5 | 8332.5 | |
| S3 | -9 | 26997.3 | |
| S1 | 0 | 0 | |
| S5 | 10 | 22220 | |
| S6 | 7 | 10887.8 | |
| S7 | 14 | 43551.2 | |
| Decentralization | S6 | -9 | 26997.3 |
| S4 | -4 | 5332.8 | |
| S2 | -3 | 2999.7 | |
| S3 | 9 | 17998.2 | |
| S5 | 10 | 22220 | |
| S1 | 12 | 31996.8 | |
| S7 | 14 | 43551.2 |
Table5. Loss function results for period of validity criterion
| Centralization | Decentralization | |||
| y (Month) | L(y) | y (Month) | L(y) | |
| S1 | 2,8 | 871.024 | 2 | 444.4 |
| S2 | 4,5 | 2249.775 | 3,4 | 1284.316 |
| S3 | 2,3 | 587.719 | 5,2 | 3004.144 |
| S4 | 3,6 | 1439.856 | 3,6 | 1439.856 |
| S6 | 4,7 | 2454.199 | 3,1 | 1067.671 |
| S5 | 5,9 | 3867.391 | 6,5 | 4693.975 |
| S7 | 6,9 | 5289.471 | 6,7 | 4987.279 |
Table 6. Particular value specification results for each structure
| Centralization | Decentralization | |||
| Expert 1 | Expert 2 | Expert 1 | Expert 2 | |
| S1 | 0.95299848 | 0.98239346 | 0.7435345 | 0.794534 |
| S2 | 0.79439686 | 0.69798985 | 0.5469879 | 0.537699 |
| S3 | 0.59252325 | 0.540469002 | 0.2435345 | 0.265476 |
| S4 | 0.80358862 | 0.79417179 | 0.6967687 | 0.7176987 |
| S5 | 0.99745556 | 0.96301608 | 0.2276879 | 0.19756789 |
| S6 | 0.87174095 | 0.85333792 | 0.1632234 | 0.1624908 |
| S7 | 0.52251934 | 0.55605416 | 0.2987698 | 0.283423 |
Table7. Functions used to describe the effects of price on quality and loss coefficients values
| Price function | k | |
| Medium | 2222,22 | |
| High | 3333,3 |
After determining the y values for each supplier in each strategy, and the loss coefficients values k, we calculate the loss occurred in each case as presented in table 8.
Table8. The supplier’s hidden quality loss values according to quality criterion
| Centralization | Expert 1 | Medium | High | ||
| y | L(y) | L(y) | |||
| S1 | 0,95299848 | 2018,2156 | 3027,3234 | ||
| S2 | 0,79439686 | 1402,35569 | 2103,53354 | ||
| S3 | 0,59252325 | 780,178424 | 1170,26764 | ||
| S4 | 0,80358862 | 1434,99603 | 2152,49404 | ||
| S5 | 0,99745556 | 2210,90588 | 3316,35882 | ||
| S6 | 0,87174095 | 1688,72152 | 2533,08228 | ||
| S7 | 0,52251934 | 606,719401 | 910,079101 | ||
| Expert 2 | Medium | High | |||
| y | L(y) | L(y) | |||
| S1 | 0,98239346 | 2144,63835 | 3216,95753 | ||
| S2 | 0,69798985 | 1082,63324 | 1623,94986 | ||
| S3 | 0,60469002 | 812,547475 | 1218,82121 | ||
| S4 | 0,79417179 | 1401,56117 | 2102,34175 | ||
| S5 | 0,96301608 | 2060,86821 | 3091,30232 | ||
| S6 | 0,85333792 | 1618,17405 | 2427,26108 | ||
| S7 | 0,55605416 | 687,09586 | 1030,64379 | ||
| Decentralization | Expert 1 | Medium | High | ||
| y | L1(y) | L2(y) | |||
| S1 | 0,7435345 | 1228,52894 | 1842,79341 | ||
| S2 | 0,5469879 | 664,872824 | 997,309236 | ||
| S3 | 0,2435345 | 131,796577 | 197,694865 | ||
| S4 | 0,6967687 | 1078,84837 | 1618,27255 | ||
| S5 | 0,3876879 | 334,0009 | 501,001349 | ||
| S6 | 0,1632234 | 59,203582 | 88,805373 | ||
| S7 | 0,2987698 | 198,361113 | 297,541669 | ||
| Expert 2 | Medium | High | |||
| y | L1(y) | L2(y) | |||
| S1 | 0,794534 | 1402,83992 | 2104,25988 | ||
| S2 | 0,537699 | 642,482941 | 963,724411 | ||
| S3 | 0,265476 | 156,615115 | 234,922673 | ||
| S4 | 0,7176987 | 1144,63616 | 1716,95424 | ||
| S5 | 0,356789 | 282,882483 | 424,323725 | ||
| S6 | 0,198769 | 87,7971562 | 131,695734 | ||
| S7 | 0,283423 | 178,506208 | 267,759312 |
6.3. Analysis and decision
We assume that the effect of price on delivery and validity
period is the same in both centralization and decentralization strategies. However, there is a big change at the level of the supplier’s hidden costs. The figure 8 indicates that loss results for the delivery criterion are much greater in the case of decentralization. The purpose of having several suppliers allows to benefit from the specific superiorities of each supplier in his specialty and to spread their risks. However, a purchase in small quantity leads to less favorable price and costs relationship. This decreases the chance of negotiating effectively the delivery deadlines, and does not help to put pressure on suppliers to meet the delivery date. The figure 9 shows that for most of suppliers, the cost relative to period of validity is high in the case of centralization. In fact, most of suppliers have medicines on stock whose period of validity have been already started, which constitutes a loss to the organization as long as they are stored. In one hand, the supplier tries to get the maximum profit, by lowering the unit purchase price to encourage the buyer. In other hand, the buyer is mainly based on maximizing the cost criterion, and does not pay enough attention to the period of validity. As a result, the buyer procures to optimize purchasing costs; but, in return the stocks in the hospital pharmacy hides a huge loss.
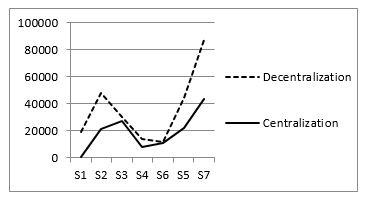 Figure 8. Loss results for delivery criterion in both structures
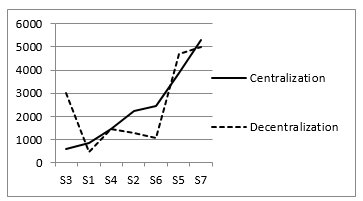 Figure 9. Loss results for period of validity criterion in both structures
In figure 10, the results determining the closest supplier to the best profile differ from one expert to another. In centralization strategy, the first expert indicates that S1 is the closest one, the second expert marks S3, while both experts’ opinion answers for the decentralization strategy coincide at the same level for S6, which explains that experts’ experiences bring different points of view on suppliers’ evaluation.
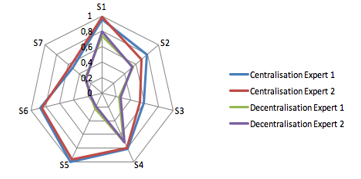 Figure 10. Expert’s evaluation results
There are two parameters that might impact the supplier’s loss function results: the value y, and the loss coefficient k. In one hand, the value y is influenced by the experts’ evaluation (figure 11 shows that although both curves are almost symmetric for each strategy and follow the same trend, the maximum difference value is up to 5,6% in centralization strategy). In other hand, the loss coefficient is influenced by the determination of the impact of price on quality criterion, which is different from an organizational structure to another. As indicated in Figure 12, an increase in the loss coefficient results in an increase of the loss function, whose variation presented in an offset curve with a huge difference that comes to a maximum of 40%. Relatively speaking, the difference between experts’ evaluations in centralization and decentralization strategy doesn’t have a big impact on the variation of supplier’s loss function in both structures which shows the effectiveness of our method.
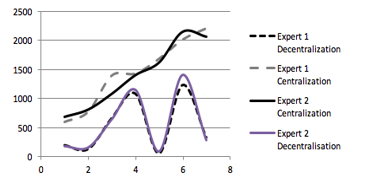 Figure 11. Variation of loss function in the case of medium impact of price on quality in both strategies
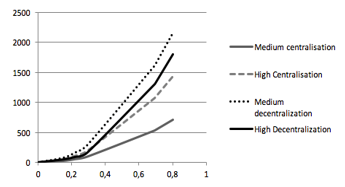 Figure 12. Variation of loss function in the case of first expert in both strategies
As shown in table 9, supplier’s hidden quality costs are higher in the case of centralization, and this is due to:
- Centralization avoids sharing the responsibilities that can lead to coordination difficulties, and promotes decision-making consistent with the defined strategy.
- The centralized purchasing team may lack expertise on certain products, and their distance from user expectations may cause dissatisfaction.
- An error on a purchase will have multiple consequences, to the extent that the volumes purchased are more important, whether in terms of quality or delivery.
- Communication problems may occur between the various hospitals and the centralized purchasing site.
- Increased risk of dependence on suppliers as there is a risk of having too many purchases from few suppliers.
Table 9. Supplier’s hidden quality costs in both organizational structures
|
Centralization |
Decentralization |
Gain (C – D)/ C |
|
| S1 | 2889,2396 | 19226,7289 | 0,13190022 |
| S2 | 22733,5557 | 27662,1728 | 0,03414751 |
| S3 | 27777,4784 | 3131,49658 | -0,1707576 |
| S4 | 9767,49603 | 6411,64837 | -0,0232507 |
| S5 | 13098,7059 | 1401,6719 | -0,0810419 |
| S6 | 23908,7215 | 22279,2036 | -0,0112899 |
| S7 | 44157,9194 | 43749,56111 | -0,00282927 |
7. Conclusion
The purchasing organizational structure is considerably changed according to many factors. However, this change doesn’t take into account its impact on supplier’s hidden quality costs. In this study, a deciding making approach is elaborated for the hospital sector. Regarding to this new approach, a new method of measuring supplier’s hidden quality costs is developed. The idea is to use improved Taguchi quality loss function in order to measure the loss associated to supplier’s bad quality and help the manager to take an appropriate decision regarding the purchasing structure. Based on this work, we conclude that an erroneous value of the loss coefficient can result in misallocation of the loss function value in centralization and decentralization strategy. Therefore, future research needs to address this coefficient, which represents the impact of price on quality, differs from a structure to another and which is considered as an important component of quality loss function.
- Jenoui, A. Abouabdellah, “Estimating supplier’s hidden quality costs with Taguchi quality loss function and Topsis method”. In 10th International Colloquium on Logistics and Supply Chain Management, Rabat, Morocco, 2017. https://doi.org/ 10.1109/LOGISTIQUA.2017.7962881
- Abouabdellah, A. Cherkaoui, “Decision Support System for Predicting the degree of a cancer patient’s empowerment”. Journal of Theoretical and Applied Information Technology, 60(3), 517-523, 2014.
- Marie, C. Giuliani, A. Abouabdellah, A. Cherkaoui, “The empowerment of patients factoring: Reporting to a holonic approach”. In 9th Conference on service systems and service management, Troyes, France, 2006.
- Serrou, A. Abouabdellah, “Logistics in the hospital: Methodology for measuring performance”. ARPN journal of engineering and applied sciences, 11(5), 250-256, 2016.
- Serrou, A. Abouabdellah, “Study grouping pharmacies impact on the performance of the hospital supply chain”. In 6th International conference on industrial engineering and systems management, Seville, Spain, 2015.
- Serrou, A. Abouabdellah, “Study of Improved fiscal performance of hospital supply chain pharmacies by centralizing”. In 45th International conference on computers & industrial engineering, Metz, France, 2015.
- Pi, C. Low, Int J AdvManuf, “Supplier Evaluation and Selection Using Taguchi Loss Functions”. The International Journal of Advanced Manufacturing Technology, 5 (1), 1123-1130, 2005. https://doi.org/10.1007/s00170-003-1975-5
- Trouiller, Technical support for improving the management and organization of hospital pharmacies, 2013.
- Dumoulin, Analyse du système d’approvisionnement pharmaceutique au Maroc : l’expérience de regroupement des achats depuis 2001, 2004.
- Saharidis, G.K.D., Kouikoglou, V.S., Dallery, Y. “Centralized and decentralized control polices for a two-stage stochastic supply chain with subcontracting”. International Journal of Production Economics. 11(6), 117-126, 2009. https://doi.org/10.1016/j.ijpe.2008.10.001
- Chen, J.M, Chen, T.-H. “The multi-item replenishment problem in a two-echelon supply chain: the effect of centralization versus decentralization”. Computers & Operations Research. 32(10), 3191-3207, 2005. https://doi.org/10.1016/j.cor.2004.05.007
- Chang, M.H, Harrington, J.E., Jr. “Centralization vs. Decentralization in a Multi-Unit Organization: A Computational Model of a Retail Chain as a Multi-Agent Adaptive System”. Management Science. 46(10), 1427-1440, 2000. https://doi.org/10.1287/mnsc.46.11.1427.12085
- Behdani, B.Lukszo, Z.Adhitya, A.Srinivasan, “Decentralized vs. centralized management of abnormal situations in a multi-plant enterprise using an agent-based approach, in Computer Aided Chemical Engineering; 28(C), 1219-1224, 2010. https://doi.org/10.1016/S1570-7946(10)28204-4
- Hall, Ma, Tomkins, “A cost of quality analysis of a building project: Towards a complete methodology for design and build”. Construction Management and Economics Journal. 19 (7), 727-740, 2001.
- Kazaz, M. Birgonul, “The evidence of poor quality in high rise and medium rise housing units: A case study of mass housing projects in Turkey”. Building and environment journal. 40 (11), 1548-1556, 2005. https://doi.org/10.1016/j.buildenv.2004.11.023
- Love, “Auditing the indirect consequences of rework in construction: A case based approach”. Management and audit journal. 17 (3), 138-146, 2002. https://doi.org/10.1108/02686900210419921
- Love, H. Li, “Knocking down walls and building bridges overcoming the problems associated with quality certification”. Construction management and economics journal. 18(3), 321–332, 1999.
- Love, D. Edwards, “Determinants of rework in building construction projects”. Engineering Construction & Architectural Management. 11(4), 259–274, 2004.
- Kethley, T. A. Waller, “Improving Customer Service in the Real Estate Industry: A Property Selection Model Using Taguchi Loss Functions”. Total Quality Management. 13(6), 739-748, 2002.
- Quigley, C. McNamara, “Evaluating Product Quality: An Application of the Taguchi Quality Loss Concept”. International Journal of Purchasing Materials. 28(3), 619-628, 1992.
- Kethley, T. A. Waller, “Improving Customer Service in the Real Estate Industry: A Property Selection Model Using Taguchi Loss Functions”. Total Quality Management. 13(6), 739-748, 2002. https://doi.org/10.1080/0954412022000010109.
- C. Li, “Quality Loss Functions for the Measurement of Service Quality”. The International Journal of Advanced Manufacturing Technology, 2(5), 29-37, 2003. https://doi.org/ 10.1007/s001700300004.
- Kethley, B. Waller, T. Festervand, “Improving customer service in the real estate industry: a property selection model using Taguchi loss functions”. Total Quality Management, 13(6), 739–748, 2002. https://doi.org/ 10.1080/0954412022000010109
- W. Kim, W. Liao, “Estimating hidden quality costs with quality loss functions”. Accounting Horizons. 8(1), 8–18, 1994.
- Kotler, “Strategies for marketing service excellence”. The 1st Global Conf, Management Centre, Europe, Brussels, 1991.
- K. Krishnan, “Increasing the visibility of hidden failure cost”. Measuring Business Excellence, 10(4), 77–101, 2006.
- Timmerman, “An approach to vendor performance evaluation”. Journal of Purchasing and Supply Management, 1(7), 27-32, 1986.
- E. Gregory, “Source selection: a matrix approach”. Journal of Purchasing and Materials Management. 22(2), 24–29, 1986.
- R. Soukup, “Supplier selection strategies”. Journal of Purchasing and Materials Management. 28(2), 7-12, 1987.
- Thompson, “Vendor prole analysis”. Journal of Purchasing and Materials Management. 26 (1), 11-18, 1990.
- Barbarosoglu, T. Yazgac, “An application of the analytic hierarchy process to the supplier selection problem”. Production and Inventory Management Journal, 38(1), 14–21, 1997.
- Nydick, R. P. Hill, “Using the Analytic Hierarchy Process to structure the supplier selection procedure”. International Journal of Purchasing and Materials Management, 25(2), 31–36, 1992.
- Sarkis, S. Talluri, “A model for strategic supplier selection”. In 9th International IPSERA Conference, London, UK, 2000.
- S. Chaudhry, F. G. Forst, J. L. Zydiak, “Vendor selection with price breaks”. European Journal of Operational Research, 16(6), 52–66, 1993.
- C. Rosenthal, J. L. Zydiak, S. S. Chaudhry, “Vendor selection with bundling”. Decision Sciences, 26 (1), 35- 48, 1995.
- P. Bua, W. M. Jackson, “A goal programming model for purchase planning”. Journal of Purchasing and Materials Management, 19(3), 27–34, 1983.
- A.Weber, L. M. Ellram, “Supplier selection using multi objective programming: a decision support system approach”. International Journal of Physical Distribution and Logistics Management. 23(2), 3-14, 1992.
- Jenoui, A. Abouabdellah, “System of multisourcing supplier’s selection and evaluation in the hospital sector integrating the criteria: Total cost, Gap time, Risk performance”. ARPN Journal of Engineering and Applied Sciences. 11(17), 10433-37, 2015.
- Jenoui, A. Abouabdellah, “Implementation of a decision support system heuristic for selecting suppliers in the hospital sector”. In 6th International conference on industrial engineering and systems management, Seville, Spain, 2015.
- Jenoui, A. Abouabdellah, ” Single or multiple sourcing strategy: a mathematical model for decision making in the hospital sector”. In 11th International conference on intelligent systems: theories and applications, Mohamedia, Morocco, 2016.
No related articles were found.